


Kansas Geological Survey, Open-file Report 2017-3
Equus Beds Groundwater Management District No. 2 Sustainability Assessment
by J. J. Butler, Jr., D. O. Whittemore, and B. B. Wilson
KGS Open File Report 2017-3
January 2017
Executive Summary
The objective of this study was to assess the prospects for sustainability of the portions of the High Plains aquifer (HPA) in the Equus Beds Groundwater Management District No. 2 (GMD2) in south-central Kansas. For the purposes of this report, sustainability is defined as being achieved when spatially averaged water levels are stable with time, i.e. the average annual water-level change over an area is zero for a period of several years. Given the temporal variability in annual precipitation and groundwater use, there will be year-to-year rises and falls in spatially averaged water levels across GMD2. However, those changes will average out to zero over a period of several years if the aquifer is being pumped at a sustainable level. The specific purpose of this study was to determine the average annual water use that would produce stable areally averaged water levels over a given area. That annual water use is defined as Qstable in this report.
The water-balance approach used here for assessing the sustainability of the HPA in GMD2 was recently developed at the Kansas Geological Survey to take advantage of conditions common to the HPA in Kansas. This data-driven approach uses annually collected data on groundwater levels and reported water use that can be readily processed to directly calculate Qstable. The approach considers the complete picture of aquifer inflows and outflows at a scale of tens to thousands of square miles and was specifically developed for seasonably pumped aquifers, i.e. aquifers for which irrigation is the main water use, that are at a mature stage of development. All components of the water budget contributing to Qstable (recharge from the land surface, inflow from streams, etc.) are lumped into one term to significantly reduce data requirements and considerably reduce the level of uncertainty relative to alternative approaches. Over time, the resulting analyses can be readily updated to account for changing climatic and hydrologic conditions. In this study, the approach was applied at four spatial scales: that of the entire district, the portions of individual counties lying within the district, the portions of townships lying within the district, and areas defined by GMD2 staff (henceforth, defined areas).
The major conclusion of this study is that the average annual water use over much of the HPA in GMD2 has been close to a sustainable level during the periods considered here (1996-2014 and 2005-2014). This conclusion is consistent with the maps of water-level changes over these periods, which show modest water-level declines over most of the area with relatively large water-level increases restricted to an area that primarily lies within Harvey County. The relative sustainability of the HPA within GMD2, however, varies with the scale and location of the analysis. The major findings of the sustainability assessment for the different scales of analysis are as follows:
- District-level assessment--The average annual reported water use appears to have been very close to the sustainable level for both assessment periods. Considering the results from all analyses, the average Qstable is 180,308 ac-ft/yr, 1.2% below the average annual reported water use for GMD2.
- County-level assessment--The findings of this assessment vary among the counties. All but McPherson County are at least somewhat dependent on infrequent years of high inflow to maintain near stable water levels.
- Harvey County--The average annual reported water use is very close to (0.2% above) Qstable (48,060 ac-ft/yr), consistent with the water-level rises and modest water-level declines observed during the periods of analysis.
- McPherson County--The average annual reported water use is above (8.0%) Qstable (29,485 ac-ft/yr), consistent with the water-level declines observed during the periods of analysis.
- Reno County--The average annual reported water use is slightly above (2.6%) Qstable (59,695 ac-ft/yr), consistent with the modest water-level declines observed during the periods of analysis.
- Sedgwick County--The average annual reported water use is close to (0.5% above) Qstable (41,343 ac-ft/yr), consistent with the water-level rises and modest declines observed during the periods of analysis.
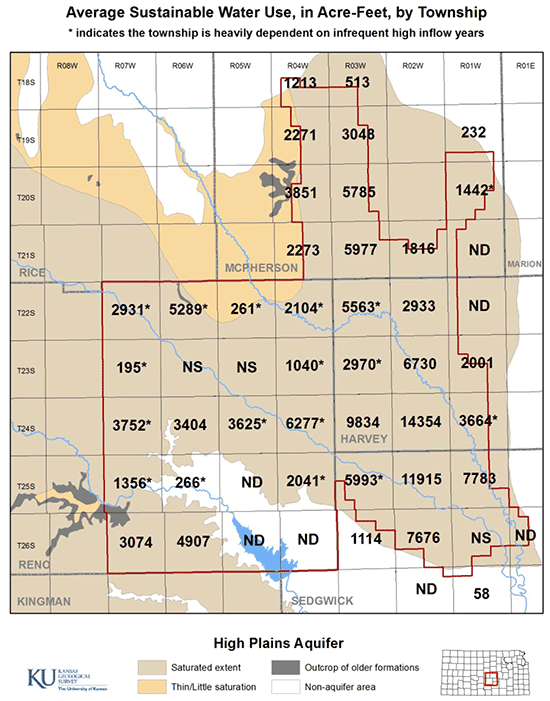
- 3. Township-level assessment--The findings of this assessment vary among the township-range units within GMD2.
- Harvey County--Portions of nine township-range units in this county lie within GMD2, eight of which have sufficient data for analysis. In general, the aquifer in these units has an average annual water use that is slightly above to very slightly below the sustainable level, consistent with the water-level rises and modest water-level declines observed during the analysis periods. However, three of the nine township-range units (T22S-03W, T23S-03W, and T24S-01W) appear to be dependent on inflows produced by years of high precipitation following drought years. In the absence of those high inflow years, the average annual water use would be appreciably above the sustainable level in these areas.
- McPherson County--Portions of 12 township-range units in this county lie within GMD2, 11 of which have sufficient data for analysis. In general, the aquifer in these units has an average annual water use that is much further above the sustainable level than in the other counties in GMD2, consistent with the relatively large water-level declines observed during the analysis periods. This is likely a reflection of lower natural recharge and less stream-aquifer interaction as a result of low permeability material between the land surface and the water table and the absence of major streams in most areas of the county.
- Reno County--Twenty township-range units in this county lie within GMD2, 17 of which have sufficient data for analysis. In general, the aquifer in these units has an average annual water use that is very slightly to somewhat above the sustainable level, consistent with the modest water-level declines observed during the periods of analysis. Twelve of the township-range units appear to be dependent on inflows produced by years of high precipitation following drought years. In the absence of those high inflow years, the average annual water use would be considerably above the sustainable level in those units, many of which are crossed by the Arkansas or Little Arkansas rivers.
- Sedgwick County--Portions of nine township-range units in this county lie within GMD2, seven of which have sufficient data for analysis. In general, the aquifer in these units has an average annual water use that is very slightly to somewhat above the sustainable level, consistent with the water-level rises and modest declines observed during the periods of analysis. One of the township- range units (T25S-03W) appears to be dependent on inflows produced by years of high precipitation following drought years. In the absence of those high inflow years, the average annual use would be considerably above the sustainable level in that unit.
- Western expansion area in Reno County--There are four full townships and one partial township in this expansion area. Three of the townships have sufficient data for analysis, but a trend in water use in one of these prevented the attainment of statistically significant relationships. The portion of the aquifer in the two other townships (22S-08W and 25S-08W) appears to be developed for an average annual water use that is somewhat above the sustainable level, although the continued increase in water use in these townships indicates that these areas may still be in a relatively early stage of development. In both townships, the system appears to be dependent on inflows produced by years of high precipitation following drought years.
- Defined area assessment--The findings of the assessment vary among the 45 defined areas within GMD2. In general, the results for the defined areas are consistent with the results for the townships in which they are located, so results from only nine of the 45 areas will be summarized here. Three of these areas are those for which statistically significant results could not be obtained at the township level (Group 1) and six are areas along the eastern boundary of GMD2 (Group 2). The findings are summarized here by these two groupings.
- Group 1--The common factor linking these three areas is that they have a much higher proportion of industrial water use (Arkansas River Hutchinson and Arkansas River Wichita defined areas) or non-irrigation use that is neither industrial nor municipal (Maize defined area) than other areas. Moreover, in all three areas, the monitoring wells are primarily located in areas dominated by irrigation pumping. The portions of the aquifer dominated by irrigation pumping appear to be operating with an average annual water use that is somewhat above the sustainable level and, in all cases, appear to be heavily dependent on infrequent high inflow years to maintain the aquifer reasonably close to near stable water levels. The lack of monitoring wells in areas dominated by non- irrigation pumping prevents estimation of Qstable for those portions of the defined areas.
- Group 2--The common factors linking these six defined areas are their location along the eastern border of GMD2 and their relatively small number of monitoring wells. These areas appear to be operating with an average annual water use that is slightly to considerably above the sustainable level (Qstable is 0.4% to 13.5% below the average annual water use). Two of the areas (Dog Ear and East Little Arkansas River South defined areas) appear to be heavily dependent on infrequent high inflow years to maintain the aquifer reasonably close to near stable water levels. One area (Park City to Valley Center) is dominated by municipal pumping and has no monitoring wells in the easternmost portion of the area where groundwater use is relatively high.
The calculations for and the results from these analyses, as well as the underlying data, are provided in the appendices accompanying this report. The approach used here is complementary to groundwater flow model simulations of an aquifer's response to various future scenarios, as the Qstable estimates and the insights into aquifer behavior obtained from these analyses can be used to help reduce the uncertainty in the modeled future responses.
The complete report is available as an Adobe Acrobat PDF file with appendices.
Kansas Geological Survey, Geohydrology
Placed online Feb. 17, 2017
Comments to webadmin@kgs.ku.edu
The URL for this page is http://www.kgs.ku.edu/Hydro/Publications/2017/OFR17_3/index.html