Kansas Geological Survey, Open-file Report 2004-62
Back to report...
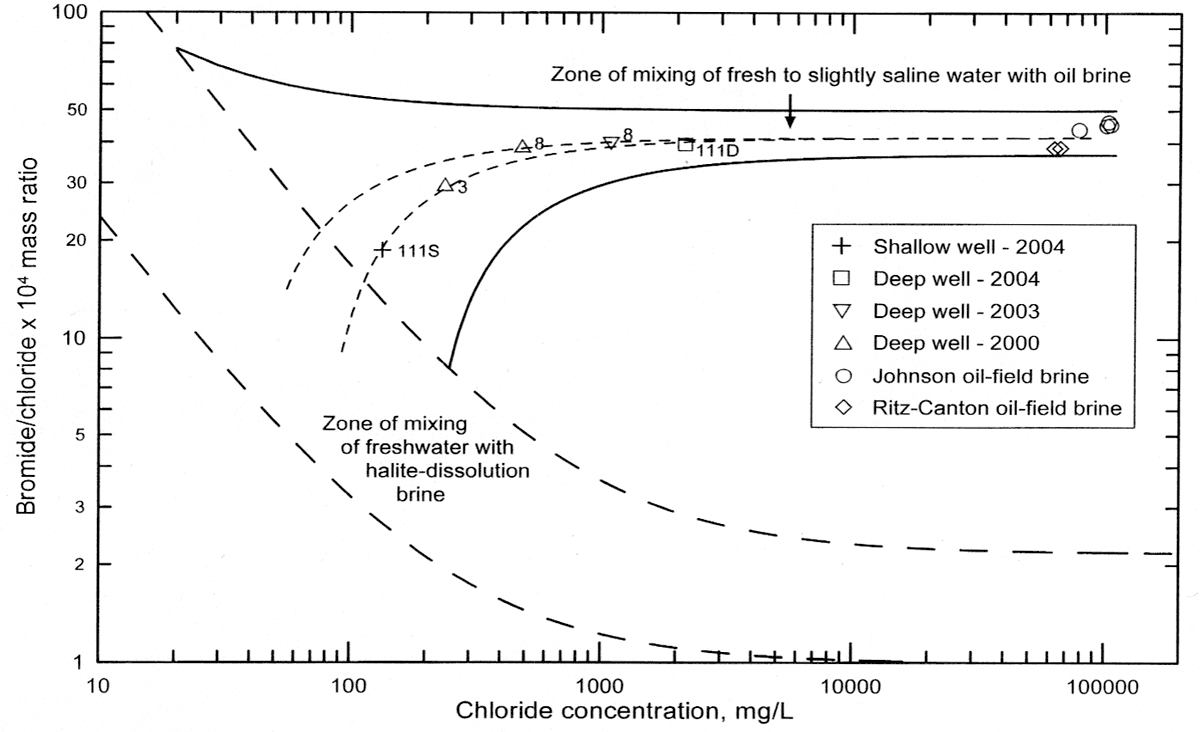
Figure 5. Bromide/chloride versus chloride concentration and mixing relationships for ground waters on the east side of the study area. The solid and long-dashed curves are the same as in Figure 3. The short-dashed curves represent the mixing of freshwaters with oil brine such that the curves pass through points for the well-water samples.
Kansas Geological Survey, Geohydrology
Placed online June 1, 2005
Comments to webadmin@kgs.ku.edu
The URL for this page is HTTP://www.kgs.ku.edu/Hydro/Publications/2004/OFR04_62/fig5.html