Kansas Geological Survey, Open-file Report 2001-51
by
C. D. McElwee, University of Kansas,
and H. C. Ross, U.S. Geological Survey
Prepared for Presentation at
Fall AGU Meeting, San Francisco, CA
Dec. 11, 2001
KGS Open-file Report 2001-51
The GEMS (Geohydrologic Experiment and Monitoring Site) field area has been established (in the Kansas River valley near Lawrence, Kansas) for a variety of reasons relating to research and teaching in hydrogeology at the University of Kansas. Over 70 wells have been installed for various purposes. The site overlies an alluvial aquifer with a total thickness of about 70 feet. The water table is typically about 20 feet below the surface, giving a total saturated thickness of about 50 feet. The upper part of the aquifer is finer material consisting of silt and clay. Typically, the lower 35 feet of the aquifer is sand and gravel. A number of wells through out the site are fully screened through the sand and gravel aquifer. Some of these fully screened wells are larger diameters; however, most wells are constructed of 2 inch PVC casing. Slug tests are widely used in hydrogeology to measure hydraulic conductivity. Over the last several years we have been conducting research to improve the slug test method. We have previously reported the detailed structure of hydraulic conductivity that can be seen in a 5 inch well (McElwee and Zemansky, EOS, v. 80, no. 46, p. F397, 1999) at this site, using multilevel slug tests. The existing 2 inch, fully screened wells are spread out over the site and offer the opportunity for developing a 3-D picture of the hydraulic conductivity distribution. However, it is difficult to develop a system that allows multilevel slug tests to be done accurately and efficiently in a 2 inch well. This is especially true in regions of very high hydraulic conductivity, where the water velocity in the casing will be relatively high. The resistance caused by frictional forces in the equipment must be minimized and a model taking account of these forces must be used. We have developed a system (equipment, software, and technique) for performing multilevel slug tests in 2 inch wells. Some equipment configurations work better than others. The data that we have been able to obtain look promising for delineating the spatial change in hydraulic conductivity over the site. The preliminary data definitely indicate significant changes over the area. With improvements in well installation, such as direct push and other techniques, it might be quite feasible to develop a 3-D picture of hydraulic conductivity over an area using multilevel slug tests in fully screened wells.
The GEMS (Geohydrologic Experiment and Monitoring Site) field area has been established (in the Kansas River valley near Lawrence, Kansas) for a variety of reasons relating to research and teaching in hydrogeology at the University of Kansas. Over 70 wells have been installed for various purposes. The site overlies an alluvial aquifer with a total thickness of about 70 feet. The water table is typically about 20 feet below the surface, giving a total saturated thickness of about 50 feet. The upper part of the aquifer is finer material consisting of silt and clay. Typically, the lower 35 feet of the aquifer is sand and gravel. A number of wells through out the site are fully screened through the sand and gravel aquifer. Some of these fully screened wells are larger diameters; however, most wells are constructed of 2 inch PVC casing. Slug tests are widely used in hydrogeology to measure hydraulic conductivity. Over the last several years we have been conducting research to improve the slug test method. We have previously reported the detailed structure of hydraulic conductivity that can be seen in a 5 inch well (McElwee and Zemansky, EOS, v. 80, no. 46, p. F397, 1999) at this site, using multilevel slug tests. The existing 2 inch, fully screened wells are spread out over the site and offer the opportunity for developing a 3-D picture of the hydraulic conductivity distribution.
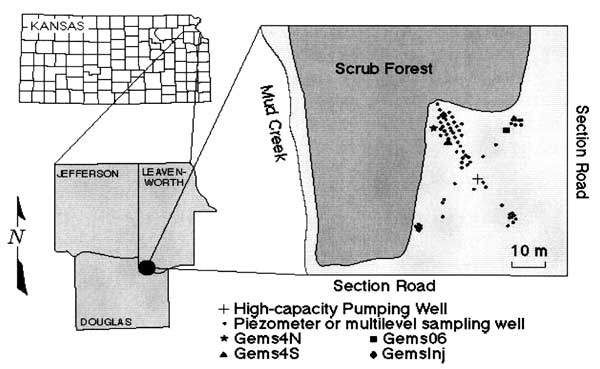
Location map for the Geohydrologic Experimental and Monitoring Site (GEMS).
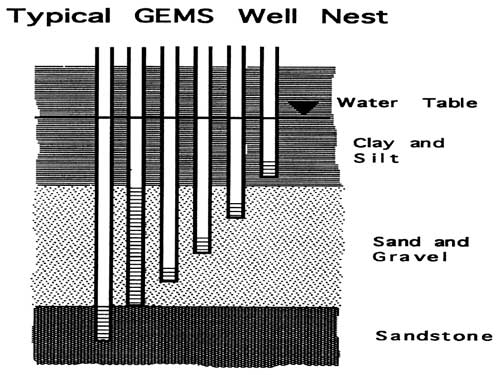
A typical well nest is shown in the figure below. Typically there is a fully screened well and several wells with short screens completed at various depths. In some nests we may have a well completed into the bedrock.
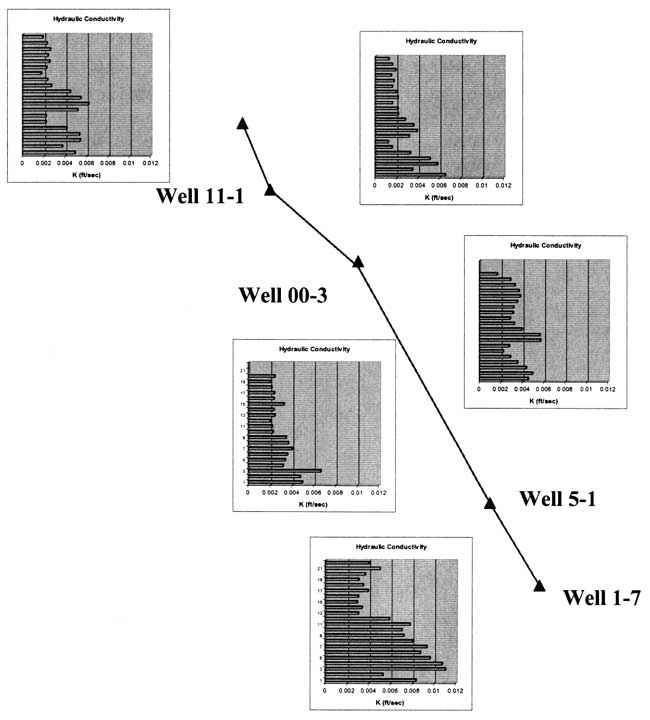
The figure below shows more detail of the well locations at GEMS. We have chosen a set of 5 wells that are screened for at least 30 feet in the lower sand and gravel aquifer for a cross section. This cross section is shown by a solid line in the following diagram. These wells all have 2 inch PVC casing, which makes it difficult to perform multilevel slug tests.
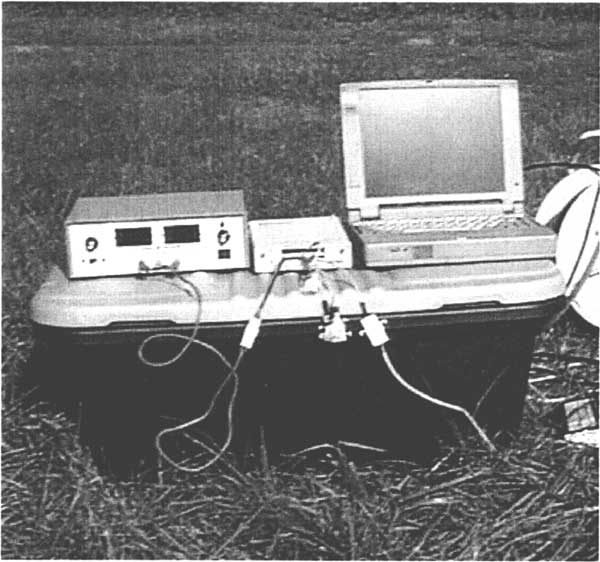
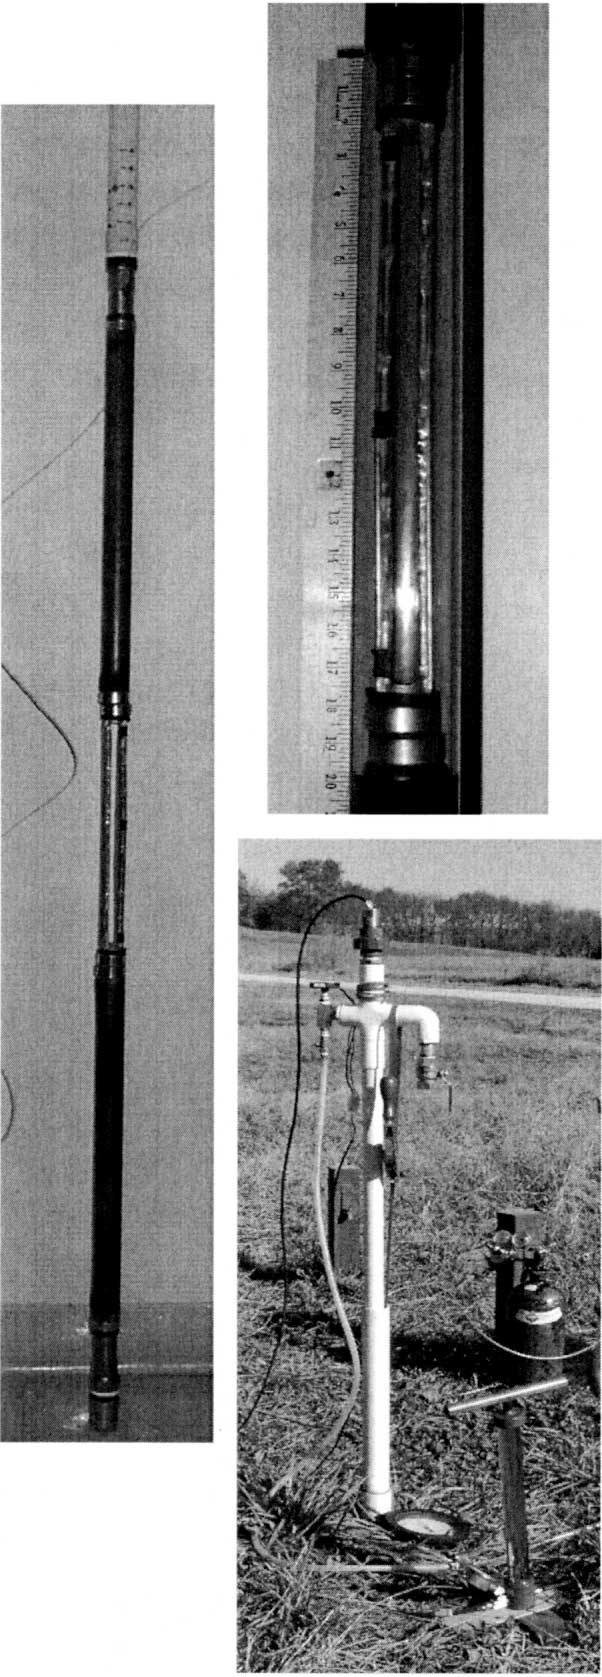
The following 3 pictures show the equipment used in this multilevel slug testing program. A slimline packer was built on 1.25" rigid copper tubing. The slugged interval is 1.65 feet, as shown in one picture. Riser casing of 1.25" PVC in 5 foot lengths with flush threads is used to place the packer at the desired depth. A steel tape is attached near the top of the packer and is used to accurately locate the position of the slugged interval. The well-head assembly, shown in one of the pictures consists of a number of components in a three prong manifold made of PVC. The center arm of the manifold allows a water pressure transducer cable to pass through an air tight adapter. An air pressure transducer, capable of reading pressure or vacuum, is mounted in one arm of the manifold. The remaining arm contains a ball valve to allow the pressure or vacuum to be released quickly. A hand pump connects to the arm containing the air pressure transducer and can be used to create pressure or vacuum in the riser casing to lower or raise the water level, respectively. A precision analog gauge or readout from the data logger can be used to accurately set the desired initial height for the slug test.
Each well in the profile was tested at 1.5 foot intervals for at least 30 feet through the sand and gravel portion of the aquifer. Five slug tests were done at each location. Three tests were done with differing initial heights to check for nonlinearity. One initial height was duplicated for a measure of repeatability. One initial height was of opposite sign to test for directional dependence. The lower two locations were done with a single packer. The first location used a 1.5 foot interval and the next location used a 3.0 foot interval. We assumed horizontal flow to convert the 3.0 foot interval results to 2 intervals of 1.5 feet.
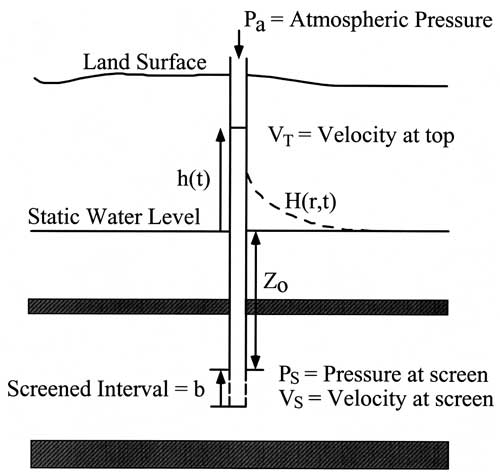
A general nonlinear model based on the Navier-Stokes equation, nonlinear frictional loss, non-Darcian flow, acceleration effects, radius changes in the wellbore, and a Hvorslev model for the aquifer has been developed (McElwee and Zenner, 1998).
The nonlinear model has three parameters: Β which is related to radius changes in the water column, A which is related to the nonlinear head losses, and K the hydraulic conductivity. We find that the model is quite robust in its estimates of K over varying conditions and allows a wide range of slug test data to be analyzed with a greater accuracy than traditional linear methods. An automated processing system implementing the above model has been developed (McElwee, 2001) and was used for processing this data.
The results for the five wells comprising our cross section are show as bar graphs next to the location marker for each well in the following diagram. There is a definite change in the hydraulic conductivity distribution along this cross section. At the northwest well 7-1 there are two layers of higher K separated by a lower K layer in the lower half of the profile. The southeast well 1-7 in contrast has higher values of hydraulic conductivity but no distinct 2 layer behavior.
The data that we have been able to obtain look promising for delineating the spatial change in hydraulic conductivity over the site. The data definitely indicate significant changes over the cross section. We are continuing to take data at other fully screened wells and plan to develop a 3D picture of the hydraulic conductivity distribution at this site. With improvements in well installation, such as direct push and other techniques, it might be quite feasible to develop a 3-D picture of hydraulic conductivity over an area using multilevel slug tests in fully screened wells.
McElwee, C.D., and Zenner, M., 1998, A nonlinear model for analysis of slug-test data: Water Resources Research., v. 34, no. 1, pp. 55-66.
McElwee, C.D., and Zemansky, G.M., 1999, Improved definition of hydraulic conductivity structure using multilevel nonlinear slug tests: EOS, v. 80, no. 46, p. F397. Also KGS Open-File Report no. 99-57, 15 pp. [available online]
McElwee, C.D., 2001, Application of a Nonlinear Slug Test Model: Ground Water, v. 39, no. 5, pp. 737-744.
Kansas Geological Survey, Geohydrology
Placed online Sept. 17, 2007, original report dated 2001
Comments to webadmin@kgs.ku.edu
The URL for this page is http://www.kgs.ku.edu/Hydro/Publications/2001/OFR01_51/index.html