Kansas Geological Survey, Open-file Report 1999-57
by
C. D. McElwee, University of Kansas,
and G. M. Zemansky, Compass Environmental, Inc.
Prepared for Presentation at
Fall AGU Meeting, San Francisco, CA
Dec. 15, 1999
KGS Open-file Report 1999-57
The major control on the transport and fate of a pollutant as it moves through an aquifer is the spatial distribution of hydraulic conductivity. Although stochastic theories or fractal representations can represent the hydraulic conductivity in a generic sense, it is becoming increasingly apparent that site-specific features (such as high conductivity zones) need to be quantified in order to reliably predict contaminant movement and design a remediation plan for a given site.
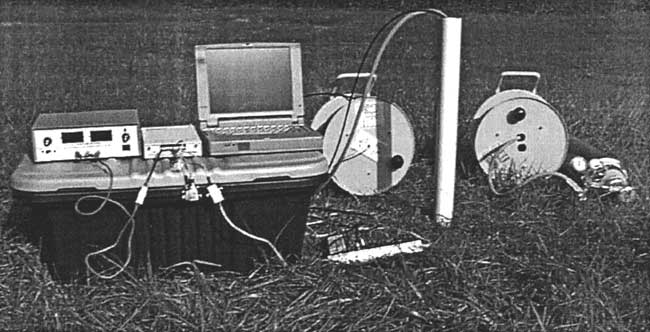
A field site in the Kansas River alluvium (coarse sand and gravel overlain by silt and clay) exhibits very high conductivities and nonlinear behavior for slug tests in the sand and gravel region. We know from extensive drilling, sampling, and a tracer test that the hydraulic conductivity varies a great deal spatially. The slug tests are performed in wells that are fully screened throughout the sand and gravel interval using a multilevel packer system with a piston for slug test initiation, allowing accurate determination of the initial head and starting time for the slug test.
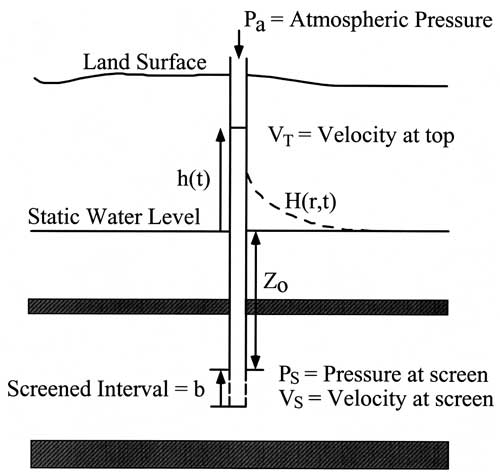
A general nonlinear model based on the Navier-Stokes equation, nonlinear frictional loss, non-Darcian flow, acceleration effects, radius changes in the wellbore, and a Hvorslev model for the aquifer has been developed (C.D. McElwee and M.A. Zenner, Water Resources Research, pp. 55-66, Jan. 1998). The nonlinear model has three parameters: β which is related to radius changes in the water column, A which is related to the nonlinear head losses, and K the hydraulic conductivity. We find that the model is quite robust in its estimates of K over varying conditions and allows a wide range of slug test data to be analyzed with a greater accuracy than traditional linear methods.
One well has been extensively studied to determine the potential of nonlinear slug tests to accurately delineate the hydraulic conductivity distribution there. Results from a bromide tracer test indicate that there are two zones of considerably higher hydraulic conductivity in the vicinity of this well. The first series of multilevel slug tests was performed using a 2 foot slugged interval (17 locations) and was analyzed with the nonlinear model. The analysis results did indeed show the presence of two zones of higher hydraulic conductivity. A second series of multilevel slug tests was performed using a 1 foot slugged interval (34 locations) to see if more detail in the hydraulic conductivity distribution could be seen. Finally, a third series was used to test the region around one peak, using a 0.5 foot interval. After analysis with the nonlinear slug-test model, we do see more detail in the results for the hydraulic conductivity distribution. In some regions of low hydraulic conductivity, the results of the earlier survey are confirmed on average while some additional small structure is revealed. The largest difference in the two series occurs in delineating the two zones of higher hydraulic conductivity. The 1 foot and 0.5 foot interval surveys suggests that the gradation into zones of higher conductivity is sharper than seen previously and that the maximum conductivity observed in the high conductivity zones is larger than previously measured. The results at this point are very positive for better definition of the hydraulic conductivity distribution using multilevel slug tests analyzed with the nonlinear slug-test model.
The major control on the transport and fate of a pollutant as it moves through an aquifer is the spatial distribution of hydraulic conductivity. Although stochastic theories or fractal representations can represent the hydraulic conductivity in a generic sense, it is becoming increasingly apparent that site-specific features (such as high conductivity zones) need to be quantified in order to reliably predict contaminant movement and design a remediation plan for a given site.
A field site in the Kansas River alluvium (coarse sand and gravel overlain by silt and clay) exhibits very high conductivities and nonlinear behavior for slug tests in the sand and gravel region. We know from extensive drilling, sampling, and a tracer test that the hydraulic conductivity varies a great deal spatially. The slug tests are performed in wells that are fully screened throughout the sand and gravel interval using a multilevel packer system with a piston for slug test initiation, allowing accurate determination of the initial head and starting time for the slug test.
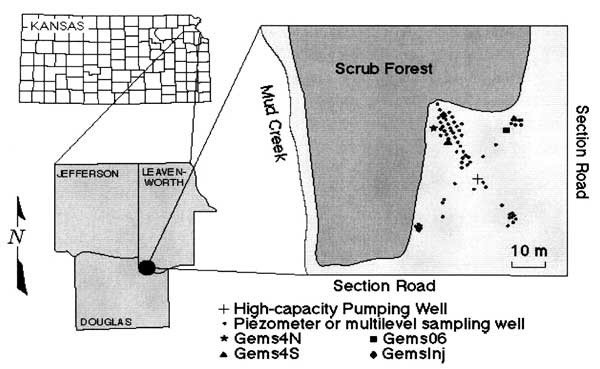
Location map for the Geohydrologic Experimental and Monitoring Site (GEMS).
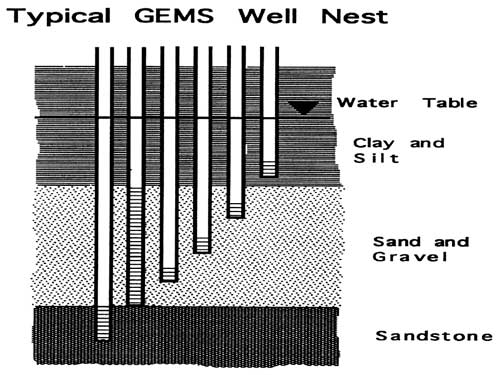
A typical well nest is shown in the figure below. Typically there is a fully screened well and several wells with short screens completed at various depths. In some nests we may have a well completed into the bedrock.
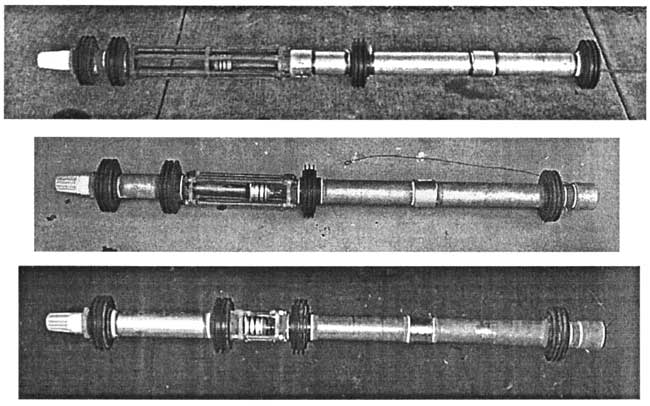
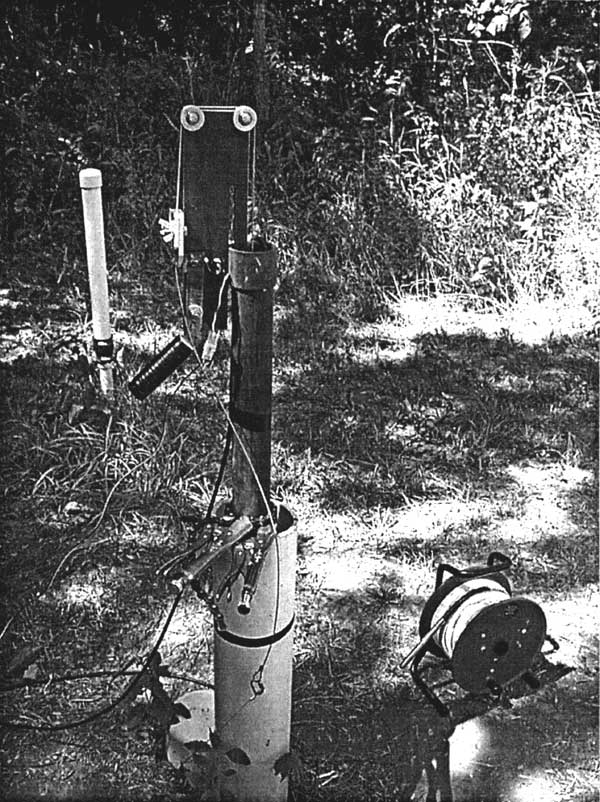
The slug tests are initiated either with pump rods attached to the piston or by a cable releasing a spring loaded piston. The following photo shows the cable arrangement for releasing the piston. When the handle is lifted, the piston is pulled to the open position by a spring under tension, thus starting the slug test. Typically each vertical location is tested with a series of 4 slug tests with varying initial heads by adding 4, 2, 1, and 2 liters of water. The repeat 2 liter tests are for quality control and to verify repeatability.
The 4 slug tests at each location are analyzed as a suite to test for nonlinear behavior and to give better noise suppression. It can be seen from the following plots (for the 2 liter test) of slug-test responses with depth, for the 2 foot slugged interval, that the nature of the slug tests vary from overdamped to oscillatory. It appears that there are two zones of higher conductivity where oscillations occur.
A general nonlinear model based on the Navier-Stokes equation, nonlinear frictional loss, non-Darcian flow, acceleration effects, radius changes in the wellbore, and a Hvorslev model for the aquifer has been developed.
The nonlinear model has three parameters: β which is related to radius changes in the water column, A which is related to the nonlinear head losses, and K the hydraulic conductivity. We find that the model is quite robust in its estimates of K over varying conditions and allows a wide range of slug test data to be analyzed with a greater accuracy than traditional linear methods.
The GEMS Injection Well has been extensively studied to determine the potential of slug testing to accurately delineate the hydraulic conductivity distribution. Results from a bromide tracer test indicate that there are two zones of considerably higher hydraulic conductivity in the vicinity of this well. The first series (4 tests at each location) of multilevel slug tests was performed using a 2 foot slugged interval (17 locations) and each suite of 4 tests was analyzed simultaneously with the nonlinear model. The analysis results (shown below) do indicate the presence of two zones of higher hydraulic conductivity. A second series (4 tests at each location) of multilevel slug tests was performed using a 1 foot slugged interval (34 locations) to see if more detail in the hydraulic conductivity distribution could be seen. Finally, a third series was used to test the region around one peak, using a 0.5 foot interval. The results of all these tests and analyses are shown below, along with the screen average calculated from a suite of slug tests over the entire screen length.
Decreasing the slugged interval does show more detail in the results for the hydraulic conductivity distribution. In some regions of low hydraulic conductivity, the results of the various surveys approximately agree, while some additional small structure is revealed by the smaller slugged interval tests. The largest difference in the surveys occurs in delineating the two zones of higher hydraulic conductivity. The smaller interval surveys indicate that the gradation into zones of higher conductivity is sharper and more complex than seen previously. The maximum conductivity observed in the high conductivity zones is larger for the smaller interval tests. The results at this point are very positive for better definition of the hydraulic conductivity distribution using multilevel slug tests analyzed with the nonlinear slug-test model.
McElwee, C.D., and Zenner, M., 1998, A nonlinear model for analysis of slug-test data: Water Resources Research., v. 34, no. 1, pp. 55-66.
McElwee, C.D., 1998, Multilevel nonlinear slug tests to characterize high conductivity aquifers: KGS Open-File Report no. 98-62, 45 pp.
Kansas Geological Survey, Geohydrology
Placed online Nov. 14, 2007, original report dated Dec. 1999
Comments to webadmin@kgs.ku.edu
The URL for this page is http://www.kgs.ku.edu/Hydro/Publications/1999/OFR99_57/index.html