Kansas Geological Survey, Open-file Report 97-45
Part of the Upper Arkansas River Corridor Study
KGS Open File Report 97-45
July 1997
A Kansas Water Plan Project
In cooperation with the Kansas Water Office Division of Water Resources, Kansas Department of Agriculture Division of Plant Health, Kansas Department of Agriculture Southwest Kansas Groundwater Management District No. 3 Kansas Department of Health and Environment Southwest Kansas Local Environmental Planning Group and other local, state, and federal agencies and units of government
The Upper Arkansas River Corridor Study is investigating the impact of contaminated Arkansas River flows on ground-water resources within the Arkansas River valley and the links between the contamination and water-level declines in the High Plains aquifer (comprising the Ogallala Formation and undifferentiated Quaternary sediments). The Arkansas River in southeastern Colorado and southwestern Kansas is one of the most saline rivers in the United States. Diversion of water for irrigation and evapotranspiration in Colorado have substantially decreased the flow and greatly increased the salinity of the river water entering Kansas. In addition to salinity, the concentrations of many other dissolved constituents in the river water have increased.
Ground-water levels have declined in the High Plains aquifer in southwest Kansas due to decreased recharge from the Arkansas River and pumpage from the aquifer. Arkansas River flow which enters Kansas from Colorado is lost between the state line and Dodge City due to infiltration through the streambed, diversion from the river for irrigation, and evaporation. Saline water from the river and from irrigated fields is infiltrating to and contaminating the ground water in the alluvial and High Plains aquifers in the upper Arkansas River corridor. Ground-water declines in the High Plains aquifer have also decreased the amount of fresh subsurface flow to the alluvium that can dilute salinity and other constituent concentrations. Another ground-water quality problem in the upper Arkansas River corridor is increasing nitrate concentrations. Municipal ground water supplies which are or may be threatened by salinity and nitrate contamination include those for Syracuse, Lakin, Garden City, Cimarron, and Dodge City.
The distribution of salinity and the mechanisms for its entrance into and movement within the High Plains aquifer are not well known. An assessment of the source(s), migration, present distribution, and possible future extent of the ground-water contamination is critical for developing plans for minimizing or mitigating ground water-quality problems in the river corridor. The Upper Arkansas River Corridor Study was developed to provide information regarding salinity within the Arkansas River and associated aquifers within the study area to enable agencies, municipalities, farmers, and industries in the region to better manage water resources in order to minimize or mitigate water-quality problems. This report provides basic map products which are being used to assist in this investigation.
The basic objectives comprise major parts of the objectives listed under the water-quality and ground-water decline issues in the subsection on the Arkansas River Corridor Subbasin in the Upper Arkansas Basin section of the Kansas Water Plan:
The study was proposed as a 5-year plan in which the Kansas Geological Survey will design and conduct hydrogeological and geochemical investigations in cooperation with several local and state agencies. Information on the study is also being communicated to other entities in the area, including ditch companies, municipalities, and federal agencies. Descriptions of components of the objectives and scope of work for the overall project are listed in the second report for the study (Whittemore et al., 1996).
The study area comprises approximately 3,560 mi2 along the Arkansas River corridor from the Colorado state line through Hamilton, Kearny, Finney, Gray, and Ford counties. The area includes the Intensive Groundwater Use Control Area (IGUCA) of the upper Arkansas River valley, the portions of Hamilton, Kearny, and Finney counties which use ditch irrigation, the Garden City Study Area of the Division of Water Resources, and a buffer zone outside of these areas. The buffer zone was selected to include freshwaters in the High Plains aquifer just outside of the area affected by salinity. Most of the maps generated for the study area include the entire 5-county area. Maps showing the configuration of the ground-water table and the saturated thickness of the High Plains Aquifer focus on Hamilton, Kearny, and Finney counties.
The study area lies within the High Plains region of the Great Plains physiographic province. North of the Arkansas River floodplain the upland surface is nearly level and is covered by loess. Sand dunes are the dominant topographic features south of the Arkansas River floodplain and the topography can be described as rolling, hummocky, or undulating depending on the thickness of the dune sand and the complexity of the dunes. There are no substantial tributaries to the Arkansas River from Hamilton County eastward to the middle ofFord County. Mulberry Creek joins the Arkansas River in eastern Ford County near the town ofFord.
Maps were compiled to display characteristics important to the study. The regional maps include both the study area and the rest of the enclosing counties. The regional maps are valuable to the study in that they display characteristics of adjoining areas that assist in relative comparisons of features within the study area. More detailed maps of the water levels and saturated thickness were also produced for the High Plains aquifer in Hamilton, Kearny, and western Finney counties (the Garden City Study Area of the Division of Water Resources) where most of the initial research has been focused. Most of the source data used in the regional map compositions can be obtained through the Data Access and Support Center (DASC) at the Kansas Geological Survey. Some of the text in the section below has been obtained from the DASC core metadata catalog, which can be viewed on-line at the URL http://www.kansasgis.org/. Data for the water level and saturated thickness maps were obtained from the Kansas Geological Survey, Division of Water Resources, Groundwater Management District No. 3, and the U.S. Geological Survey.
Regional maps prepared for this report address the following topical areas: Land Cover, Plate A; Soils, Plate B; Surface Geology, Plate C; Water Rights, Plate D; and Bedrock Elevation, Plate E. The maps for the Garden City Study Area include Elevation of Pre development Water Level Surface, Plate F; Elevation of 1985 Water Level Surface, Plate G; Elevation of 1994 Water Level Surface, Plate H; Change in Saturated Thickness from Predevelopment to 1985, Plate I; and Change in Saturated Thickness from 1985 to 1994, Plate J. The specifications and descriptions of the maps (plates A-J) included in this report are as follows:
Map theme: Land Use, Land Cover
Map scale: 1:500,000
Source scale: 1:100,000 (approximately)
Data source: Kansas Applied Remote Sensing, 1993
This dataset was compiled into map form at the Kansas Geological Survey, Geohydrology Section, by Fritz Kessler, Graduate Research Assistant and by Lee Bissinger, Graduate Research Assistant, under the supervision of Jeff Schloss, Research Assistant.
Available as an Acrobat PDF file, 22 MB.
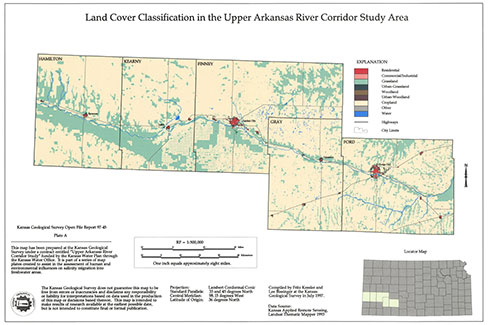
The Land cover database depicts 10 general land cover classes for the State of Kansas. The database was compiled from a digital classification of Landsat Thematic Mapper (TM) imagery by the Kansas Applied Remote Sensing (KARS) Program. These data are suited for county-level and watershed-level analyses that involve land use and land cover.
Land cover classifications in the 5 county region are residential, commercial and industrial, grassland, urban grassland, woodland, urban woodland, cropland, water, and other. In terms of acreage, cropland and grassland are the dominant land uses within the study area. The term cropland is generic and refers to all land which is used to grow agricultural crops. A distinction can be made between the two major categories of cropland (dryland and irrigated) by comparing Plate A with Plate D which shows the locations of water rights within the study area. A large supply of good quality water is required for effective irrigation. Cropland is generally irrigated except where the quantity and/or quality of ground water limits or precludes its use for irrigation. Where the predominant land use is cropland and there are dense clusters of water rights, a large percentage of croplands are being irrigated. Examples of this can be seen in eastern Kearny, western Finney, and much of Gray County. Where cropland is predominant and water rights are sparse or non-existent, dryland farming techniques are being used to grow crops. The best examples of this are found in much of northern and southern Hamilton and northwestern Kearny counties.
The largest areas of grasslands are those in which the topography restricts land use, where the soils are too sandy to be used effectively for cropland, or where there is an insufficient quantity of good quality ground water for irrigation. The large area of grassland to the south of the Arkansas River in Hamilton and southwestern Kearny Counties is a good example of a location where the soils, topography, and limited availability of ground water all serve to restrict land use. This belt of grassland coincides with the belt of sand dunes shown in Plate C. Early irrigation development in the 5-county region was primarily on flat ground where water diverted from the Arkansas River or pumped from wells could be used in flood irrigation. Later use of center pivot systems supplied with water from wells allowed development of irrigated crop land on the sand dunes overlying the High Plains aquifer as well as additional irrigation on uplands where the water table is much deeper. Two large areas of grassland remain in Finney County south of the Arkansas River. This land use is a result of restrictions for crops related to topography and sandy soils and use for non-crop purposes such as residences and a game refuge.
Part of the sand dune area in southeastern Kearny and southern Finney counties appears as a grid-like pattern of small cusped diamonds of green for grassland within the yellow representing cropland. Each green diamond represents the area left in grassland between 4 adjoining fields irrigated by center pivots. The circular fields irrigated by the center pivots are usually within a quarter section. Thus, the diamond-shaped grasslands remaining occur as a grid with a half-mile spacing. This pattern generally only occurs in the sand dunes. Dryland and irrigated croplands in relatively flat lying regions with suitable soils cover essentially all of the field area with no substantial grassland remaining.
There are an unusually large number of small bodies of water indicated on the land cover map in Finney, Gray, and Ford counties. The land cover classification was performed using a satellite image which was taken shortly after an extended period of unusually high rainfall. The land cover imagery was collected on July 1, 1989. Weather stations in the region recorded total rainfall averaging nearly 9 inches from June 1 to July 1, an exceptionally large percentage of the mean annual rainfall of approximately 19 to 20 inches. Most of the small bodies of water indicated on the land cover map represent small closed depressions in areas with slowly permeable soils (clayey to silty, Plate B). During periods of heavy rainfall these depressions can fill with water and remain flooded for short periods of time.
Map theme: Surface Soils
Map scale: 1:500,000
Source scale: variable
Data source: U.S. Department of Agriculture, Natural Resources Conservation Service (NRCS), 1994
Scientific authors: Donald Whittemore and Richard Sleezer.
This dataset was compiled into map form by Lee Bissinger, Graduate Research Assistant and by Fritz Kessler, Graduate Research Assistant, under the supervision of Jeff Schloss, Research Assistant.
Available as an Acrobat PDF file, 27 MB.
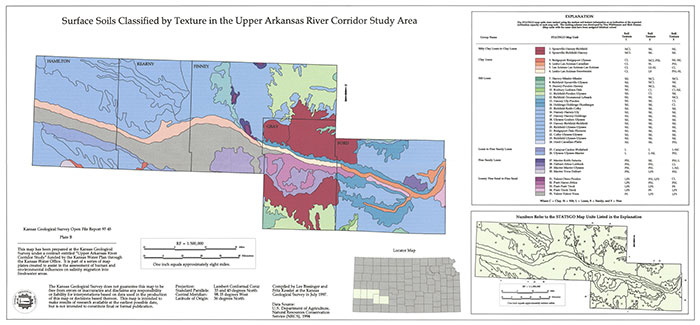
This plate was constructed using the STATSGO database. STATSGO is a digital soils map and database developed by the National Resource Conservation Service as a part of the National Cooperative Soil Survey. The STATSGO soil maps are compiled by generalizing more detailed soil survey maps which were originally constructed at scales of 1:24,000 or 1:20,000. Map unit composition for a STATSGO map is determined by transecting or sampling areas on more detailed maps and expanding the data statistically to characterize the whole map unit. The map data are compiled in 1-by 2-degree topographic quadrangle units and merged and distributed as statewide coverages. The soil map units are linked to attributes in the Map Unit Interpretations Record relational database which gives the proportionate extent of the component soils and their properties for each soil map unit.
Soil map units for the 5 county area being studied were grouped on the basis of the surface soil texture of the three most prevalent soil series within each STATSGO soil map unit. The STATSGO map units were then ranked using the surface soil texture information as an indication of the expected infiltration capacity of each map unit. The principal assumption was that soils with fine textured surface horizons (i.e. clay, silty clay, etc.) would have slower infiltration rates than soils with coarse textured surface horizons (i.e. sand, loamy sand, loamy fine sand, etc.). The ranking scheme was developed at the Kansas Geological Survey, Geohydrology Section, by Don Whittemore, Senior Scientist and Section Chief, and by Rich Sleezer, Graduate Research Assistant.
The spatial patterns of STATSGO map units in and near the Arkansas River Valley are largely a function of the spatial patterns of soil parent material in this region. For this reason, there are many similarities between the STATSGO map and the Surface Geology map (plate C). Most of the soils within the study area have formed in three parent materials: loess, alluvium, and eolian sand (dune sand). Loessial soils such as the Spearville, Harney, Richfield, and Ulysses soils are found on uplands above the Arkansas River Valley. Alluvial soils such as the such as the Bridgeport, Lesho, Las Animas, Canadian, and Sweetwater are found adjacent to the Arkansas River and its tributaries. Soils formed in eolian sand such as the Attica, Pratt, Tivoli, and Valent series are found in the Arkansas River valley on the south side of the river. Soils formed in loess have surface textures of silty clay loam or silt loam and have slow to moderately slow infiltration rates. Soils formed in alluvium have a wide range of surface textures from clay loam to loamy sand and infiltration rates vary from slow to rapid. Soils formed in eolian sands have surface textures of fine sandy loam to fine sand and infiltration rates are moderately rapid to very rapid.
Map theme: Surface Geology
Map scale: 1:500,000
Source scale: variable
Data source: Kansas Geological Survey, Automated Cartography, 1992
This dataset was compiled into map form at the Kansas Geological Survey, Geohydrology Section, by Lee Bissinger, Graduate Research Assistant and Fritz Kessler, Graduate Research Assistant, under the supervision of Jeff Schloss, Research Assistant.
Available as an Acrobat PDF file, 22 MB.
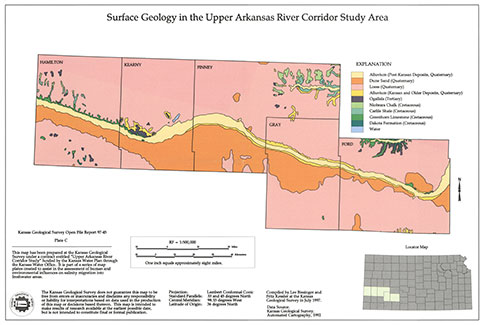
The source database is an Arc/Info implementation of the 1:500,000 scale Geology Map of Kansas, M-23, 1991. This work was performed by the Automated Cartography section of the Kansas Geological Survey, under contract to the Kansas Water Office. The goal of this project was to capture, in Arc/Info structures, the spatial and attribute information portrayed on this map. The data for Map M-23 was digitized from an original paper copy publication of the Geology Map of Kansas, Map M-l, 1964. That map incorporated a 1:500,000 scale, USGS base map. Because of this source and scale, there were some edge matching problems with the state boundary as maintained by the Kansas Cartographic Database (KCD). Two classes of spatial features are represented in the Arc/Info version of the geology map: polygons depicting major geologic units and lines demarking the bases of key geologic formations within the units.
Spatial patterns of surficial geology are very similar to those seen in the STATSGO soils map. Most of the area is covered by loess, alluvium, and dune sand, all of which are of Quaternary age. There are relatively small outcrops of the Ogallala Formation (Tertiary) as well as the Cretaceous Niobrara Chalk, Carlile Shale, Greenhorn Limestone and Dakota Formation. The surficial geology of the study area can be used in conjunction with the soils and water rights maps to help interpret land use patterns and to delineate the boundaries of the Quaternary alluvial aquifer within the study area. The area of post-Kansan alluvial deposits constitutes the approximate area of the modern Arkansas River floodplain. The Kansan and older Quaternary alluvial sediments occur as terraces at somewhat higher elevations relative to the modern floodplain of the river.
Map theme: Water Rights
Map scale: 1:500,000
Source scale: variable
Data source: Kansas Department of Agriculture, Water Resources Division, 1993 This dataset was compiled into map form at the Kansas Geological Survey, Geohydrology Section, by Lee Bissinger, Graduate Research Assistant, under the supervision of Jeff Schloss, Research Assistant.
Available as an Acrobat PDF file, 21 MB.
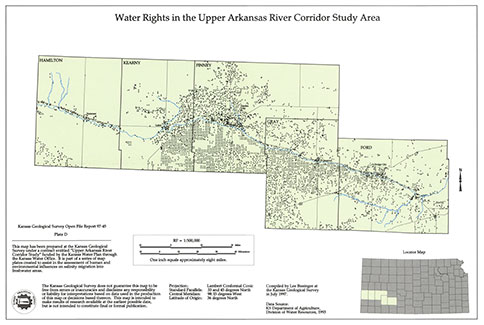
The Water Information Management and Analysis System (WIMAS) is a method of visualizing and summarizing water-appropriations and water-use information contained in the Water Resources Information System (WRIS). It provides an overview of all the water rights and pertinent hydrologic information in an area that is available from no other source. The WRIS is the original source database maintained by the Division of Water Resources, Kansas Department of Agriculture for water appropriation and water use information in their mission to manage water appropriations in the State of Kansas. WIMAS consists of a set of Arc Macro Language scripts used with the Arc/Info GIS and a coverage developed from the WRIS database. It also includes numerous other coverages such as land survey lines, roads, and streams to be used in visually relating the water resources information. The basic WIMAS programming was initially developed by the U.S. Geological Survey and has since undergone several revisions to serve further needs. The purpose of WIMAS is to improve the accessibility to and enhance the use of the water appropriations and water use data kept by the Division of Water Resources. WIMAS allows the user to retrieve information from the Division's WRIS database by source of water or type of use for any given county, subbasin drainage area, or user-defined area.
The distribution of the water rights in the study area generally indicates the presence of sufficient saturated thickness in the High Plains and alluvial aquifers for large capacity pumping from wells. Some of the rights represent water appropriated for ditch diversions from the Arkansas River used in flood irrigation. Several water rights indicate wells obtaining water from the Dakota aquifer. Most of the wells with water rights are used for irrigation, although some of the wells supply water for public supplies, industry, and stockyards. Areas with few or no water rights generally represent the absence of the High Plains or alluvial aquifers, or saturated thicknesses which are insufficient for large capacity pumping.
The band of points along the Arkansas River valley in Hamilton County primarily indicates wells drawing water from the alluvial aquifer. The High Plains aquifer is either not present or contains insufficient saturated thickness to supply substantial quantities of water to the north and south of the river valley in this county. Many of the points in Kearny, Finney, Gray, and Ford counties are arranged in a grid-like pattern. These points usually represent more recent wells installed for center pivot irrigation. As most fields irrigated by center pivots occupy a circle within a quarter section, the distance between the grid-like points is approximately a half mile. The grid pattern is especially prominent through the area of sand dunes south of the Arkansas River in southeastern Kearny, southern Finney, and central Gray counties. These areas represent wells installed for center pivot irrigation more recently than the older rights for flood irrigation. The points in the grid pattern correlate with the land cover pattern of cropland circles and small grassland diamonds in the same areas in Plate A.
Map theme: Altitude of Bedrock Isolines
Map scale: 1:500,000
Contour interval: 50 feet
Source scale: 1:500,000
Data source: U.S. Geological Survey, 1995
This dataset was compiled into map form at the Kansas Geological Survey, Geohydrology Section, by Lee Bissinger, Graduate Research Assistant, and by Jeff Schloss, Research Assistant.
Available as an Acrobat PDF file, 19 MB.
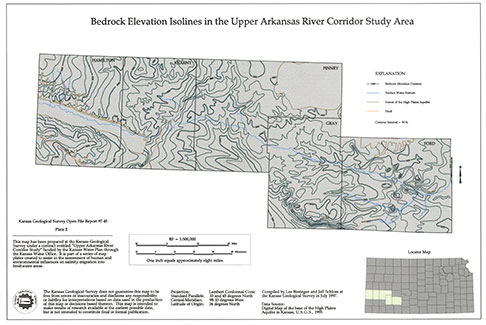
The isolines shown in this map are taken directly from an Arc/Info coverage produced by the U.S. Geological Survey in 1995. This digital map contains information on the altitude of the base of the High Plains aquifer in Kansas, which includes the Ogallala, Great Bend, and Equus Beds aquifers according to the metadata which is provided with the map. It was developed from 1:500,000 scale source information as part of a multi-layered digital database for the major aquifers in Kansas. Potential uses of this digital map include studies addressing the location, quantity, quality, use, management, and protection of ground-water resources in Kansas.
The bedrock surface underlying the High Plains aquifer generally slopes downward in an east to south-southeast direction. The steeper slope of the bedrock surface in a zone along the Bear Creek Fault zone is visible from southwestern to east-central Kearny County. This zone coincides with the substantial increase in the thickness of the High Plains aquifer sediments. The bedrock surface shows prominent valleys and ridges, especially from western Finney County through Gray and Ford counties. The bedrock valleys represent locations with greater thicknesses of the High Plains aquifer which are reflected in the greater distribution of points for water rights in Plate D. The ridges and highs have smaller aquifer thicknesses. For example, the high in southeast Gray County has little saturated thickness and no large capacity wells, as indicated by the absence of points for water rights in the same area in Plate D.
Configuration of the bedrock surface along the Arkansas River corridor could be important in understanding differences in the water quality observed in the High Plains aquifer as affected by the infiltration of saline river water. If the avenue of contamination is primarily downward seepage through aquifer sediments, the water quality in the bedrock valleys might be expected to be fresher than in shallower thicknesses of the aquifer. If contamination via the gravel packs of large diameter wells is important, increased salinity might be seen even in wells that penetrate the aquifer in the bedrock valleys.
Map theme: Elevation of Pre development Water Level Surface
Map scale: 1 :250,000
Contour interval: 50 feet
Source scale: N/A
Data source: Kansas Geological Survey, Geohydrology Section, 1939-1942
This dataset was compiled into map form at the Kansas Geological Survey, Geohydrology Section, by Ming-Shu Tsou, Graduate Research Assistant.
Available as an Acrobat PDF file, 22 MB.
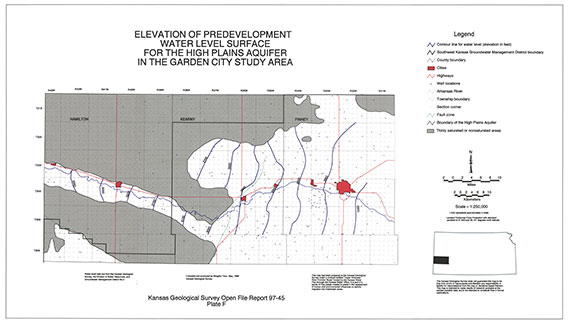
Water-level data used to create this map primarily originated with measurements collected by the U.S. Geological Survey and the Kansas Geological Survey in 1939-1942 for Hamilton and Kearny counties (McLaughlin, 1943) and 1940 for Finney County (Latta, 1944). The USGS used these early data to determine predevelopment water levels for wells later chosen for the state water-level network. The predevelopment water-level values accompany the annual water-level measurements in the computer data base of the Kansas Geological Survey. Although there were some wells extracting water for irrigation and municipal use from the High Plains aquifer during 1939-1942, the amounts were much smaller than for more recent periods. A great increase in installation of wells for irrigation use occurred starting in the 1950's and continued through the 1980's. Since the 1980's, the increase in the number of wells has slowed due to appropriation of essentially all of the water in the study area and the moratorium on new (in contrast to replacement) water rights applications.
The data used from the KGS database were limited by the types of geologic units that the wells penetrate. The geologic constraints required that the well be representative of what is considered to be the High Plains aquifer in Finney and most of Kearny counties and the alluvial aquifer of the Arkansas River in central Hamilton County and southwestern Kearny County. Not all of the water-level data is accompanied by geologic codes or information allowing conclusive determination of codes. A combination of location, water level, and predominant well construction information for the area was used to select the data most appropriate for the map. Wells which are known to penetrate any bedrock were excluded from the dataset (including the Dakota Formation, Niobrara Chalk, and undifferentiated Lower Cretaceous/Upper Jurassic rocks or undifferentiated Lower Cretaceous rocks). Wells completed only in Quaternary alluvium were also excluded in the area where the High Plains aquifer underlies the alluvium. If the geologic code was not listed for a well in the High Plains aquifer area but well depth was available, the water-level data were used only if the well depth is greater than 60 ft to exclude the alluvial aquifer. The area where data for alluvial wells were used is the bedrock valley of the Arkansas River extending through central Hamilton County into southwestern Kearny County to the center of Range 37 West. The High Plains aquifer containing substantial saturated thickness is located in the non-shaded map area outside the bedrock valley. For this study, the High Plains aquifer is composed of undifferentiated Quaternary deposits and the Tertiary Ogallala Formation. The shaded map area represents locations where the High Plains and alluvial aquifers are not present or where saturated thicknesses are too thin to be of use for high capacity wells.
Depth to water values were subtracted from land surface elevations to derive the elevations of the water-table above mean sea-level. Contour lines are included only for the High Plains aquifer in Townships 22 South to 25 South and the alluvial aquifer in the bedrock valley of the Arkansas River. Data points are also shown for the thinly saturated or non-saturated areas of the High Plains aquifer and for Townships 21 and 26 South. These data were used to help remove edge effects in the contours.
Characterization and quantification of aspects of the hydrology of the study area are necessary for both conceptual and mathematical models of the water flow and budget in the system, including determination of the link between the Arkansas River and ground-water-level changes, and the transport of salinity. Water inputs to the Garden City study area include primarily precipitation and surface flow in the Arkansas River, although a small amount of subsurface water also enters from the west across the state line. Water outputs mainly comprise evapotranspiration, Arkansas River flow, and ground-water outflow.
The general direction of ground-water flow as indicated by the water-level surface contours for the predevelopment period in the Upper Arkansas River Corridor Study Area map is to the east. The distance between the contours is relatively even, reflecting a generally uniform slope of the regional water-level surface. The isolines do not curve markedly where they cross the Arkansas River along most of the valley shown in the map. This indicates that discharge from the aquifer to the river and recharge from the river to the aquifer were not large. Thus, the river level was probably close to that of the water-level surface along most of the corridor. The slight upstream curve in the corridor near Garden City suggests that the aquifer may have been discharging a moderate amount of water to the river downstream of Holcomb. The southsouthwest to north-northeast slant of the isoline near Deerfield may also indicate some discharge of ground water to the river. This discharge could have been the recharge from Lake McKinney, canals, and irrigated fields that received water diverted from the Arkansas River. In general, the conditions indicate that the alluvial and High Plains aquifers acted as one system in contrast to current conditions.
Map theme: Elevation of Water Level Surface in 1985
Map scale: 1:250,000
Contour interval 50 feet
Source scale: N/A
Data source: Kansas Geological Survey, Geohydrology Section; Kansas Department of Agriculture, Water Resources Division; and Groundwater Management District No. 3, 1984, 1985, 1986
This dataset was compiled into map form at the Kansas Geological Survey, Geohydrology Section, by Ming-Shu Tsou, Graduate Research Assistant.
Available as an Acrobat PDF file, 23 MB.
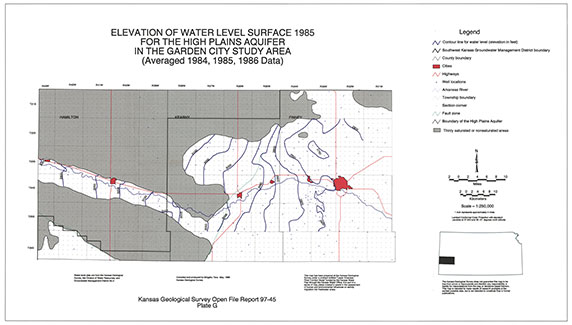
The data selection and map generation information are the same as those described for Plate F, except for the different time represented by the water-level measurements. Water-level data used to create this map originated with winter measurement data collected by the USGS and by the Water Resources Division of the Kansas Department of Agriculture as a part of the state water-level network. Additional measurements collected by the Division of Water Resources for the Garden City Study Area and by Southwest Kansas Groundwater Management District No. 3 were added to the database. Water-level measurements are generally taken between November 31st and March 1st to allow ground water to recover to static levels during the winter since most of the wells measured are used for irrigation. The data were extracted from the water-level database maintained at the KGS. The water-level data used are an average of the measurements available for the winters of 1984, 1985, and 1986.
The position of the 1985 water-level isolines in the bedrock valley in Hamilton and southwestern Kearny counties did not substantially change in position, showing that water levels were similar in this portion of the Arkansas River valley to the predevelopment period. In contrast, the water-level isolines for the High Plains aquifer area in 1985 show a general westward shift relative to those for predevelopment, indicating the drop in water table caused by pumping withdrawals. In addition to the westward shift, the distances between the isolines are not uniform and there are pronounced bends caused by the uneven distribution of withdrawals and recharge.
The large bend toward the east and the great distance between the 3000 and 2950 foot isolines in central Kearny County north of Lakin and northwest of Deerfield indicate recharge of the High Plains aquifer by seepage from Lake McKinney and the Amazon and Great Eastern ditches. Lake McKinney is located in the northwest part of Township 24 South, Range 35 West. The smaller separation between the isolines to the north of the Arkansas River in east-central Kearny and west-central Finney counties indicates the larger hydraulic gradient to an area of great water-table declines to the northwest of Garden City. The slant in the 2950 foot isoline near and just north of the Arkansas River suggests that the irrigation diversion seepage causes ground water discharge to the river. South of the river, the south-southwest to north-northeast slant of the 2950 foot isoline probably reflects the outward flow of recharge from the South Side ditch irrigation area. The 2850 and 2800 foot isolines just north of the Arkansas River in Finney County indicate a pronounced flow of water northward from the river. This reflects recharge from the river through the alluvial aquifer to the underlying High Plains aquifer and flow northward into the area of great ground-water declines. The flow outward from the river valley also appears to the south of the river between Holcomb and Garden City.
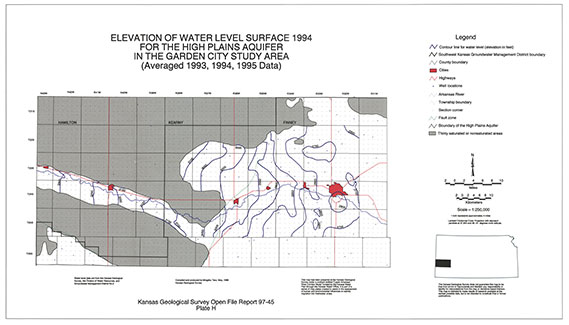
Map theme: Elevation of Water Level Surface in 1994
Map scale: 1 :250,000
Contour interval 50 feet
Source scale: N/A
Data source: Kansas Geological Survey, Geohydrology Section; Kansas Department of Agriculture, Water Resources Division; and Groundwater Management District No. 3, 1993, 1994, 1995
Available as an Acrobat PDF file, 23 MB.
This dataset was compiled into map form at the Kansas Geological Survey, Geohydrology Section, by Ming-Shu Tsou, Graduate Research Assistant.
The data selection and map generation information are the same as those described for Plates F and G, except for the different time represented by the water-level measurements. The water-level data used are an average of the measurements available for the winters of 1993, 1994, and 1995. A similar process was used in data averaging as for Plate G.
The water-level surface in the bedrock valley of Hamilton and southwestern Kearny counties remained relatively similar to that in 1985 and predevelopment, whereas the isolines continued a general westward shift with time over much of the High Plains aquifer area due to continued water-table declines. In general, the largest changes were south of the Arkansas River from south of Lakin to southeast of Garden City and north of the river to the east of Garden City. The area to the north of the river from Lakin to Deerfield remained relatively constant, suggesting that continued seepage of river water diverted to Lake McKinney, major irrigation canals, and ditch irrigated fields helped to maintain ground-water levels. Water-table declines south of the river have produced water-level surface isolines that increasingly bend to the southwest. Thus, flow gradients from the South Side Ditch service area and the river downstream of this area appear to have increased towards the southeast. Outward flow from the river to both the northeast and the southeast is indicated in the Garden City area and the river corridor to the east.
Map theme: Saturated Thickness Change from Predevelopment to 1985
Map scale: 1:250,000
Contour interval 20 feet
Source scale: N/A
Data source: Kansas Geological Survey, Geohydrology Section; Kansas Department of Agriculture, Water Resources Division; and Groundwater Management District No. 3, 1984, 1985, 1986
This dataset was compiled into map form at the Kansas Geological Survey, Geohydrology Section, by Ming-Shu Tsou, Graduate Research Assistant.
Available as an Acrobat PDF file, 24 MB.
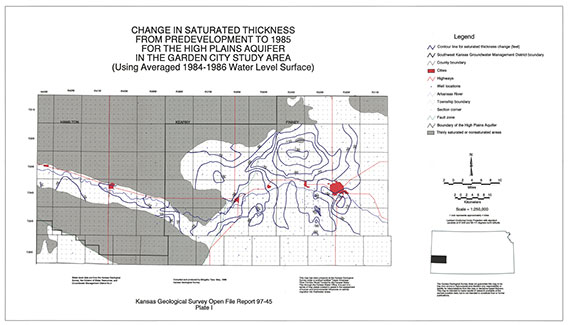
The data selection and map generation information are the same as those described for Plates F and G, except for the process used to obtain the saturated thickness values. The saturated thickness for each well with data for the 1984-1986 period was computed by subtracting the averaged 1985 depth to water (the value used to obtain the average 1985 waterlevel elevation in Plate G) from the depth to bedrock underlying the High Plains aquifer. Negative values indicate a decrease in the saturated thickness and positive values indicate an increase.
Decreases in the saturated thickness of the unconsolidated aquifers from around 1940 to 1985 occurred over nearly all of the Garden City study area. Declines were generally small (near 10 feet or less) in the alluvial aquifer of the bedrock valley in Hamilton and southwestern Kearny counties. The saturated thickness decreased most in the High Plains aquifer north of the Deerfield to Garden City section of the river corridor. Over 130ft of saturated thickness was lost to ground-water consumption in the center of this area. The influence of seepage from the Arkansas River, Lake McKinney, the main Amazon canal, and the South Side Ditch area can be seen in the nose of smaller decreases in saturated thicknesses that extends from the end of the bedrock valley towards Deerfield. East of this nose and south of the river corridor, saturated thickness declines in the High Plains aquifer were generally in the range of 30 to 50 feet. East of Garden City, both to the north and south of the river valley, saturated thicknesses decreased less than 30 feet.
Map theme: Saturated Thickness Change from 1985 to 1994
Map scale: 1:250,000
Contour interval 20 feet
Source scale: N/A
Data source: Kansas Geological Survey, Geohydrology Section; Kansas Department of Agriculture, Water Resources Division; and Groundwater Management District No. 3, 1984-1986 and 1993-1995
This dataset was compiled into map form at the Kansas Geological Survey, Geohydrology Section, by Ming-Shu Tsou, Graduate Research Assistant.
Available as an Acrobat PDF file, 22 MB.
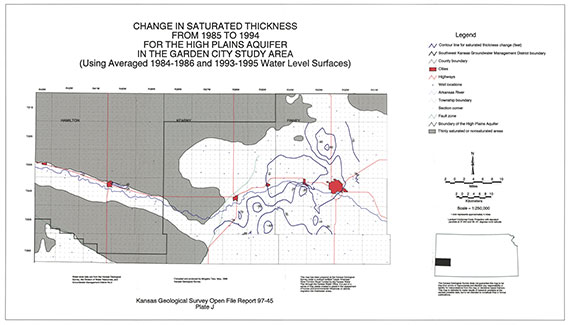
The data selection and map generation information are the same as those described for Plates F-H, except for the process used to obtain the saturated thickness values. The saturated thickness for each well with data for the 1993-1995 and 1984-1986 periods was computed by subtracting the averaged 1994 depth to water (used for computing water-level elevation for Plate H) from the 1985 depth to water (the value used for computations in Plate G. Negative values indicate a decrease in the saturated thickness and positive values indicate an increase.
Saturated thickness changes from 1985 to 1994 were generally less than 10 feet in the alluvial aquifer in the bedrock valley of the Arkansas River in Hamilton and southwestern Kearny counties. The area of small changes extended eastward into the High Plains aquifer in central Kearny County, including most of the service area of the South Side ditch. Thicknesses increased greater than 10 feet in the area north of the river from Deerfield to Holcomb. This could reflect the continued seepage from ditch diversion waters during smaller average consumption of ground water. The greatest declines in the saturated thickness of the High Plains aquifer occurred in the regions starting several miles to the north of Garden City and several miles to the south of the Arkansas River between Lakin and Garden City.
Latta, B.F., 1944, Geology and ground-water resources of Finney and Gray counties, Kansas, with analyses, by E.O. Holmes: Kansas Geological Survey, Bulletin 55, 272 p. [available online]
McLaughlin, T.G., 1943, Geology and ground-water resources of Hamilton and Kearny counties, Kansas, with analyses by E.O. Holmes: Kansas Geological Survey, Bulletin 49, 220 p. [available online]
Whittemore, D.O., Tsou, M., and Grauer, J., 1996, Upper Arkansas River corridor study: Inventory of available data and development of conceptual models: Kansas Geological Survey, Open-File Report 96-19, 83 p.
Kansas Geological Survey
Placed online Feb. 15, 2017
Comments to webadmin@kgs.ku.edu
The URL for this page is http://www.kgs.ku.edu/Hydro/Publications/1997/OFR97_45/index.htm