![]()
Prev Page--Walnut Creek || Next Page--Well Records
Chemical Character of Ground Water
Chemical character of ground water in Rush County is indicated by analyses of samples of water collected from 51 wells and a seep. The analyses of two water samples from Walnut Creek also are included. Results of the chemical analyses are given in milligrams per liter in table 10, but many of the data were examined using units of milliequivalents per liter. Milligrams per liter can be converted to milliequivalents per liter (meq/l) by multiplying milligrams per liter by the factors given in table 11.
Table 10--Chemical analyses of water from selected wells, Walnut Creek, and one seep1. [Dissolved constituents and hardness given in milligrams per liter.2]
| Well number |
Sample number (figs. 11-13, 18) |
Depth (feet) |
Geologic source3 |
Date of collection |
Temp. (° C) |
Dissolved solids (evaporated at 180 ° C) |
Silica (SiO2) |
Total iron (Fe) |
Total manganese (Mn) |
Calcium (Ca) |
Magnesium (Mg) |
Sodium4 | Bicar- bonate (HCO3) |
Sulfate (SO4) |
Chloride (Cl) |
Fluoride (F) |
Nitrate5 (NO3) |
Hardness as CaCO3 |
Specific conductance (micromhos at 25°C) |
pH | Sodium adsorption ratio |
|
|---|---|---|---|---|---|---|---|---|---|---|---|---|---|---|---|---|---|---|---|---|---|---|
| Ca+Mg | Non- carbonate |
|||||||||||||||||||||
| 16-16W-32ccb | 1 | 266 | Kd | 5-12-1960 | 16.0 | 1,440 | 9.5 | .21 | 0.00 | 19 | 13 | 510 | 332 | 210 | 510 | 3.3 | 3.4 | 100 | 0 | 2,650 | 22 | |
| 16-17W-16dcd | 2 | 370 | Kd | 5-12-1960 | 15.5 | 1,270 | 5.0 | .32 | .00 | 11 | 11 | 460 | 277 | 200 | 440 | 3.4 | .4 | 72 | 0 | 2,170 | 23 | |
| 22aaa | 3 | 320 | Kd | 10-6-1960 | 16.5 | 1,410 | 8.0 | .56 | .00 | 13 | 9.6 | 510 | 274 | 190 | 540 | 3.4 | 1.6 | 72 | 0 | 2,680 | 26 | |
| 16-18W-6dac | 4 | 230 | Kd | 5-13-1960 | 15.5 | 2,090 | 8.5 | .02 | .00 | 14 | 19 | 760 | 307 | 260 | 880 | 3.7 | 2.8 | 110 | 0 | 3,870 | 31 | |
| 6dac2 | 5 | seep | 5-13-1960 | 13.0 | 17,400 | 2,000 | 360 | 4,000 | 190 | 1,400 | 9,600 | 6,500 | 6,300 | 29,800 | ||||||||
| 27cdd | 6 | 209 | Kd | 5-12-1960 | 14.0 | 1,870 | 8.0 | .42 | .00 | 19 | 11 | 680 | 356 | 270 | 700 | 4.4 | 3.8 | 92 | 0 | 3,430 | 31 | |
| 16-19W-17bab | 7 | 400 | Kd | 5-13-1960 | 18.5 | 1,030 | 8.0 | .39 | .00 | 8.3 | 16 | 360 | 398 | 180 | 240 | 5.6 | 2.9 | 86 | 0 | 1,800 | 16 | |
| 16-20W-5bbd | 8 | 530 | Kd | 5-13-1960 | 18.0 | 1,300 | 8.5 | .07 | .00 | 8.3 | 9.6 | 480 | 431 | 220 | 360 | 5.2 | 3.8 | 60 | 0 | 2,320 | 28 | |
| 21ddc | 9 | 54 | Qu | 5-13-1960 | 14.5 | 412 | 46 | .01 | .00 | 89 | 20 | 20 | 290 | 37 | 39 | .5 | 18 | 300 | 66 | 700 | .5 | |
| 17-16W-20aaa | 10 | 315 | Kd | 10-13-1960 | 1,000 | 6.0 | .54 | .00 | 7.4 | 1.3 | 390 | 442 | 88 | 290 | 4.4 | 2.1 | 24 | 0 | 1,870 | 35 | ||
| 17-17W-28dcd | 11 | 230 | Kd | 5-12-1960 | 15.5 | 1,790 | 7.0 | .16 | .00 | 18 | 22 | 640 | 321 | 240 | 700 | 3.6 | 4.9 | 140 | 0 | 3,320 | 24 | |
| 17-18W-20daa | 12 | 300 | Kd | 10-12-1960 | 1,360 | 8.0 | .09 | .07 | 10 | 5.1 | 500 | 273 | 190 | 500 | 3.8 | 1.9 | 46 | 0 | 2,370 | 32 | ||
| 28aad | 13 | 335 | Kd | 5-12-1960 | 16.5 | 3,660 | 8.0 | .30 | .00 | 38 | 29 | 1,300 | 249 | 290 | 1,800 | 3.2 | 7.1 | 210 | 10 | 6,740 | 38 | |
| 33acd | 14 | 300 | Kd | 4-1-1960 | 1,300 | 6.0 | .17 | .00 | 13 | 11 | 460 | 294 | 220 | 430 | 3.6 | 1.9 | 78 | 0 | 2,370 | 8.0 | 23 | |
| 33dbc | 15 | 300 | Kd | 5-5-1959 | 1,320 | 7.5 | .14 | .00 | 14 | 5.1 | 480 | 284 | 220 | 440 | 3.7 | 1.2 | 56 | 0 | 2,370 | 7.8 | 28 | |
| 34bbd | 16 | 302 | Kd | 5-8-1961 | 1,300 | 9.0 | 1.2 | .05 | 31 | 9.4 | 450 | 307 | 210 | 430 | 3.2 | .9 | 120 | 0 | 2,400 | 7.8 | 18 | |
| 17-19W-27ddc | 17 | 320 | Kd | 5-16-1960 | 16.5 | 1,950 | 6.0 | .08 | .00 | 100 | 46 | 550 | 432 | 450 | 580 | 4.1 | .4 | 440 | 87 | 3,370 | 11 | |
| 17-20W-29cdd | 18 | 285 | Kd | 5-13-1960 | 17.0 | 1,200 | 10 | .10 | .00 | 49 | 36 | 340 | 298 | 360 | 260 | 2.8 | 3.8 | 270 | 26 | 1,900 | 9.0 | |
| 36abb | 19 | 325 | Kd | 10-12-1960 | 884 | 6.0 | 2.7 | .00 | 9.1 | 3.3 | 320 | 268 | 160 | 240 | 3.2 | 1.3 | 36 | 0 | 1,640 | 23 | ||
| 18-16W-16bbb | 20 | 86 | Qv | 8-5-1960 | 15.0 | 374 | 47 | .18 | .00 | 94 | 9.1 | 19 | 304 | 30 | 19 | .2 | 5.8 | 270 | 22 | 590 | .5 | |
| 19bba | 21 | 55 | Qv | 8-19-1960 | 13.0 | 789 | 34 | .27 | .55 | 160 | 19 | 84 | 458 | 190 | 57 | .7 | 7.1 | 490 | 110 | 1,270 | 1.7 | |
| 23aaa | 22 | 75 | Qv | 5-25-1961 | 444 | 31 | .01 | .00 | 110 | 11 | 28 | 346 | 48 | 38 | .2 | 2.9 | 330 | 46 | 760 | 7.6 | .6 | |
| 23add | 23 | stream | 8-24-1960 | 22.0 | 441 | 28 | 3.2 | .62 | 95 | 10 | 45 | 296 | 80 | 31 | .5 | 6.2 | 280 | 36 | 730 | 1.2 | ||
| 28cdc | 24 | 168 | Kd | 5-17-1960 | 14.5 | 773 | 8.0 | .36 | .00 | 9.1 | 15 | 270 | 554 | 140 | 46 | 4.5 | 1.3 | 84 | 0 | 1,310 | 13 | |
| 18-17W-11cda | 25 | 86 | Qv | 8-17-1960 | 13.0 | 420 | 50 | .27 | .00 | 100 | 11 | 24 | 271 | 17 | 76 | .4 | 5.8 | 300 | 78 | 690 | .6 | |
| 14cdc | 26 | 70 | Qv | 8-19-1960 | 12.0 | 487 | 36 | 1.8 | .70 | 100 | 12 | 46 | 337 | 93 | 24 | .3 | 4.9 | 310 | 36 | 790 | 1.2 | |
| 18ccc | 27 | 224 | Kd | 10-7-1960 | 1,270 | 9.0 | .46 | .00 | 21 | 10 | 460 | 336 | 140 | 460 | 3.0 | .4 | 94 | 0 | 2,360 | 21 | ||
| 27aba | 28 | 59 | Qv | 8-24-1960 | 12.0 | 369 | 43 | .20 | .00 | 93 | 8.8 | 18 | 288 | 40 | 15 | .3 | 9.3 | 270 | 32 | 590 | .5 | |
| 28bcc | 29 | 63 | Qv | 8-11-1960 | 12.0 | 446 | 41 | 2.2 | .31 | 100 | 10 | 31 | 300 | 85 | 22 | .2 | 4.2 | 300 | 57 | 720 | .8 | |
| 34bca | 30 | 175 | Kd | 10-11-1960 | 650 | 8.0 | .38 | .00 | 18 | 9.5 | 220 | 407 | 120 | 70 | 2.6 | 1.9 | 84 | 0 | 1,160 | 10 | ||
| 18-18W-9aab | 31 | 265 | Kd | 10-12-1960 | 1,320 | 8.0 | 1.1 | .00 | 14 | 5.6 | 480 | 298 | 230 | 440 | 4.2 | 1.8 | 58 | 0 | 2,470 | 27 | ||
| 25bcb | 32 | 67 | Qv | 8-22-1960 | 12.0 | 568 | 35 | 1.5 | .47 | 120 | 11 | 62 | 378 | 99 | 46 | .4 | 6.2 | 350 | 40 | 930 | 1.5 | |
| 26dda | 33 | 187 | Kd | 10-12-1960 | 500 | 8.0 | .36 | .00 | 29 | 10 | 150 | 329 | 52 | 84 | 1.6 | .4 | 110 | 0 | 920 | 6.1 | ||
| 28aac | 34 | 83 | Qv | 7-22-1961 | 415 | 26 | .62 | .12 | 114 | 11 | 19 | 351 | 53 | 19 | .2 | .4 | 330 | 42 | 630 | 7.8 | .5 | |
| 30ddc | 35 | 70 | Qv | 8-11-1960 | 12.0 | 420 | 35 | .18 | .42 | 100 | 7.3 | 28 | 300 | 47 | 27 | .3 | 23 | 290 | 46 | 700 | .7 | |
| 31dda | 36 | 150 | Kd | 10-11-1960 | 14.5 | 644 | 9.0 | 1.1 | .00 | 10 | 2.7 | 240 | 354 | 95 | 110 | 2.8 | 1.8 | 36 | 0 | 1,160 | 17 | |
| 34bbb | 37 | 59 | Qv | 8-22-1960 | 12.0 | 665 | 33 | .18 | .00 | 140 | 12 | 66 | 340 | 180 | 49 | .5 | 18 | 400 | 120 | 1,050 | 1.4 | |
| 36dca | 38 | 54 | Qt | 8-19-1960 | 12.0 | 414 | 31 | .18 | .00 | 120 | 9.0 | 13 | 316 | 40 | 17 | .2 | 34 | 320 | 66 | 710 | .3 | |
| 18-19W-21cdb | 39 | 58 | Qv | 8-11-1960 | 13.0 | 488 | 45 | .18 | .00 | 120 | 11 | 29 | 334 | 90 | 23 | .2 | 6.2 | 340 | 68 | 740 | .7 | |
| 27aaa | 40 | 64 | Qv | 8-11-1960 | 12.0 | 549 | 36 | .29 | .00 | 140 | 10 | 32 | 293 | 140 | 34 | .2 | 23 | 380 | 140 | 850 | .7 | |
| 18-20W-14ccb | 41 | 44 | Qv | 8-11-1960 | 12.0 | 463 | 52 | .20 | .00 | 120 | 11 | 19 | 322 | 63 | 21 | .3 | 15 | 340 | 68 | 710 | .5 | |
| 15ccb | 42 | 63 | Qv | 8-11-1960 | 13.0 | 465 | 50 | .20 | .00 | 120 | 12 | 20 | 310 | 79 | 22 | .3 | 14 | 340 | 82 | 730 | .5 | |
| 19acc | 43 | 54 | Qv | 8-11-1960 | 12.0 | 479 | 50 | .20 | .35 | 110 | 13 | 28 | 356 | 79 | 14 | .3 | 5.8 | 340 | 46 | 780 | .7 | |
| 19ccb | 44 | stream | 8-22-1960 | 21.0 | 418 | 33 | 1.4 | .00 | 89 | 12 | 36 | 277 | 83 | 22 | .5 | 5.8 | 270 | 45 | 680 | 1.0 | ||
| 20dca | 45 | 47 | Qv | 2-6-1961 | 535 | 33 | .10 | .00 | 150 | 10 | 20 | 424 | 89 | 14 | .2 | 7.1 | 420 | 74 | 920 | 7.5 | .4 | |
| 36abb | 46 | 214 | Kd | 10-11-1960 | 14.0 | 1,220 | 8.0 | .55 | .00 | 13 | 4.8 | 450 | 361 | 220 | 340 | 5.6 | 1.0 | 52 | 0 | 2,220 | 27 | |
| 19-16W-23ddb | 47 | 80 | Qv,Kd | 10-7-1960 | 12.0 | 657 | 20 | .53 | .00 | 170 | 16 | 32 | 316 | 74 | 100 | .1 | 88 | 480 | 230 | 1,170 | .6 | |
| 19-17W-27add | 48 | 185 | Kd | 5-17-1960 | 15.5 | 309 | 11 | .06 | .00 | 37 | 17 | 59 | 292 | 19 | 20 | .6 | 1.9 | 160 | 0 | 570 | 2.0 | |
| 19-18W-3aca | 49 | 140 | Qt,Kd | 8-15-1960 | 12.0 | 469 | 33 | .18 | .00 | 120 | 11 | 21 | 312 | 77 | 40 | .2 | 9.7 | 350 | 98 | 790 | .5 | |
| 27ccb | 50 | 390 | Kd | 5-16-1960 | 16.0 | 448 | 8.0 | .71 | .00 | 20 | 13 | 140 | 299 | 28 | 90 | .9 | 1.7 | 100 | 0 | 800 | 6.0 | |
| 19-19W-24ccb | 51 | 290 | Kd | 5-16-1960 | 16.0 | 591 | 11 | .71 | .00 | 19 | 8.9 | 190 | 278 | 120 | 93 | 3.0 | 2.7 | 84 | 0 | 1,050 | 9.0 | |
| 19-20W-4bbb | 52 | 284 | Kd | 10-11-1960 | 13.5 | 861 | 7.0 | .15 | .00 | 10 | 5.1 | 310 | 327 | 200 | 160 | 5.4 | .8 | 46 | 0 | 1,550 | 20 | |
| 17ddc | 53 | 360 | Kd | 5-13-1960 | 14.5 | 1,130 | 14 | .22 | .00 | 6.6 | 7.2 | 420 | 442 | 200 | 250 | 5.2 | 4.4 | 46 | 0 | 1,970 | 27 | |
| 26baa | 54 | 410 | Kd | 5-13-1960 | 19.0 | 745 | 9.5 | 3.0 | .00 | 6.6 | 7.7 | 260 | 317 | 170 | 120 | 4.9 | 3.6 | 48 | 0 | 1,190 | 16 | |
| 1. Samples analyzed by Kansas State Department of Health. 2. One milligram per liter is equivalent to 8.33 pounds of substance per million gallons of water. 3. Kd, Dakota Formation; Qt, terrace deposits; Qu, undifferentiated Pleistocene deposits; Qv, valley-fill deposits. 4. Sodium and potassium expressed as sodium. 5. In areas where the nitrate content of water is known to exceed 45 mg/l, the public should be warned of the potential dangers of using the water for infant feeding (U.S. Public Health Service, 1962, p. 7). |
||||||||||||||||||||||
Table 11--Factors for converting milligrams per liter to milliequivalents per liter.
| Mineral constituents |
Chemical symbol |
Multiply by |
|---|---|---|
| Cations | ||
| Calcium | Ca++ | 0.04990 |
| Magnesium | Mg++ | .08226 |
| Sodium | Na+ | .04350 |
| Potassium | K+ | .02558 |
| Anions | ||
| Carbonate | CO3-- | .03333 |
| Bicarbonate | HCO3- | .01639 |
| Sulfate | SO4-- | .02082 |
| Chloride | Cl-- | .02821 |
| Fluoride | F- | .05264 |
| Nitrate | NO3- | .01613 |
Water from the seep, which is near an abandoned oil well, had unusually large concentrations of dissolved constituents. The sample is not considered to be representative of water from aquifers of Cretaceous or younger age: therefore, the analysis is shown only in table 10 and on figures 11-13, and is not included in the discussion of ranges in concentration of chemical constituents in ground water.
Chemical Constituents in Relation to Use
The following discussion of the chemical constituents of ground water in relation to use has been adapted in part from publications of the U.S. Geological Survey and the State Geological Survey of Kansas. The recommended maximum concentration of chemical constituents in water used for domestic purposes (U.S. Public Health Service, 1962) are summarized in table 12.
Table 12--Recommended maximum concentrations of chemical constituents in water used for domestic purposes (adapted from U.S. Public Health Service, 1962).
| Constituent | Concentration (milligrams per liter) |
|---|---|
| Chloride (Cl) | 250 |
| Fluoride (F) | 1.2 |
| Iron (Fe) | .3 |
| Manganese (Mn) | .05 |
| Nitrate (NO3) | 45 |
| Sulfate (SO4) | 250 |
| Dissolved solids | 500 |
Dissolved solids--When water evaporates, the residue consists of the mineral constituents listed in table 10 and may contain some organic matter and water of crystallization. Water containing more than 1,000 mg/l of dissolved solids is generally objectionable for domestic and municipal use; however, in various sections of the country, and in Rush County, water that contains more than 1,000 mg/l dissolved solids is used with no apparent adverse effect. More than 60 percent of the water samples from the Dakota Formation in Rush County contained more than 1,000 mg/l dissolved solids. The dissolved-solids concentration of water samples ranged from 309 to 3,660 mg/l. Of 53 samples, 19 contained less than 500 mg/l, 14 contained 500 to 1,000 mg/l, and 20 contained 1,000 or more mg/l dissolved solids.
Hardness--Hardness in water may be recognized by the increased quantity of soap required to produce lather; it is a major contributor to scale formation in boilers, radiators, water heaters, and pipes. Akaline earths, mainly calcium and magnesium, commonly cause hardness in water, but iron and manganese may also contribute when they are present in high concentrations.
Carbonate hardness, or temporary hardness, is that part of the hardness that is equivalent to the carbonate and bicarbonate present in water; it can be removed for household use almost completely by boiling the water. Noncarbonate hardness, or permanent hardness, is the remainder of the hardness; it cannot be removed by boiling.
Water that has 60 mg/l or less of hardness is usually considered to be soft and suitable for most purposes without further softening. Moderate hardness, which ranges from 61 to 120 mg/l, does not seriously interfere with the use of water for most purposes, but it does increase the amount of soap required. Water with hardness ranging from 121 to 180 mg/l is considered to be hard, and laundries and industries may profitably soften such supplies. Water with hardness of more than 180 mg/l is very hard and generally requires softening before use. The preceding ranges in hardness are from Durfor and Becker (1964).
The calcium and magnesium hardness of water samples collected in Rush County ranged from 24 to 490 mg/l. Of 53 samples, 26 were very hard, 2 were hard, 14 were moderately hard, and 11 were soft.
Iron--Some iron is present in most ground water. The quantity present may vary significantly from place to place, even within the same aquifer. When water contains 0.1 to 0.3 mg/l or more of iron in solution, the iron upon oxidation may precipitate as a red sediment. Iron may give a disagreeable taste to water, it may stain clothing, cooking utensils, and plumbing fixtures, and it may be objectionable in the preparation of foods and beverages. Iron can be removed from most water by aeration and filtration, but chemical treatment also may be required.
The concentration of total iron in water samples collected from wells in Rush County ranged from 0.01 to 3.0 mg/l. The sample from Walnut Creek near the east side of the county had a concentration of 3.2 mg/l. Of 53 samples, 28 contained less than 0.30 mg/l, and 25 contained 0.30 mg/l or more of iron.
Manganese--Manganese has properties similar to iron and is considered with iron when evaluating the usefulness of water. Only 10 samples of water collected in Rush County contained measurable amounts of manganese and the concentration present ranged from 0.05 to 0.70 mg/l.
Chloride--Chloride is widely distributed in nature; it is an abundant constituent of sea water, oil-field brines, and streams and lakes in arid or semiarid regions. In ground water the concentration of chloride may range from a few to more than 100,000 mg/l. Small quantities of chloride may be dissolved from most rock materials. Chloride has little effect on the suitability of water for ordinary use unless concentrations are high enough to make the water impotable or corrosive. The removal of chloride from water is costly and uneconomic for most present-day uses. Water containing 200 to 300 mg/l of chloride, and an equivalent amount of sodium, may have a salty taste.
The chloride content of water samples collected in Rush County ranged from 14 to 1,800 mg/l. Of 53 samples, 35 contained 250 mg/l or less, and 18 contained more than 250 mg/l of chloride.
Fluoride--Fluoride generally is present in ground water in small quantities. Knowledge of the concentration of fluoride in water used by children is quite important, as concentrations of about 1 mg/l in drinking water lessens the incidence of tooth decay (Dean and others, 1941). The use of water containing more than 1.5 mg/l fluoride during the time of formation of permanent teeth may cause mottled tooth enamel (Dean, 1936).
The fluoride concentration of samples of water from Rush County ranged from 0.1 to 5.6 mg/l. Of 53 samples, 25 contained 1.2 mg/l or less and 28 contained more than 1.2 mg/l of fluoride.
Sulfate--Sulfate in ground water is derived chiefly from solution of gypsum and anhydrite, or by oxidation of sulfides of iron. Water containing more than 250 mg/l sulfate will have a laxative effect on some of those who drink it.
The sulfate content of water samples in Rush County ranged from 17 to 450 mg/l. Of 53 samples, 48 contained less than 250 mg/l and 5 contained more than 250 mg/l of sulfate.
Sodium--Sodium commonly is present in ground water and its concentration may range from a few milligrams per liter in water in some aquifers to more than 100,000 mg/l in brines. Water containing 130 to 200 mg/l of sodium, and an equivalent amount of chloride, may have a salty taste.
A large percentage concentration of sodium in water to be used for irrigation is undesirable because of its effect on soils. The concentration of sodium in water in relation to its use for irrigation is discussed in a later section.
The concentration of sodium in water samples in Rush County ranged from 13 to 1,300 mg/l. Of 53 samples, 29 contained less than 250 mg/l and 24 contained more than 250 mg/l of sodium.
Nitrate--In 1954, a physician in Iowa reported cyanosis, or methemeglobinemia, in infants whose feeding formulas were mixed with water containing high concentrations of nitrate (Comly, 1945). This so-called blue-baby disease appears to be a hazard when waters containing more than 45 mg/l of nitrate are used for infant feeding (Hem, 1970). Older children and adults seemingly are not harmed by moderate concentrations of nitrate in water. Boiling or softening of water for household use will not remove or decrease the nitrate content.
The concentration of nitrate in water samples collected from Rush County ranged from 0.4 to 88 mg/l. Only one sample exceeded 45 mg/l nitrate; all other samples contained less than 35 mg/l. In a recent study by the county agent, 748 wells were sampled and 201 were found to contain water with 45 mg/l or more nitrate (E. L. VanMeter, written commun., 1971). The high concentrations of nitrate were commonly found to result from surface contamination due to improper location and sealing of the well.
Silica--Silica is present in most water and may be deposited with other scale-forming minerals in steam boilers, but it has little effect on the use of water for other purposes.
The concentration of silica in water samples in Rush County ranged from 5.0 to 52 mg/l. Of 53 samples, 31 contained 20 mg/l or less and 22 contained more than 20 mg/l of silica.
Chemical Constituents in Relation to Location and Aquifer
Samples of ground water were collected from 51 wells in Rush County; 30 samples were from the Dakota Formation of Cretaceous age, 19 samples were from aquifers of Pleistocene age, and two samples were from Pleistocene and Dakota deposits. Surface-water samples were collected from Walnut Creek near the east and west county lines.
Aquifer Delineation and Water Type
Figures 11, 12, and 13 are diagrams modified from those proposed by Piper (1944), in which milliequivalents per liter of cations and (or) anions are plotted as percentages of total milliequivalents per liter of cations or anions. The diagrams are useful for comparing the chemical relations of water from different sources and for classifying the water by chemical type. For example, by examination of the values plotted on the diagrams, water from the Dakota Formation can be distinguished readily from water from the Pleistocene deposits. Most of the analyses for water samples from the Dakota indicate water of the sodium chloride type and most of those for samples from the Pleistocene deposits indicate water of the calcium bicarbonate type.
Figure 11--Modified Piper diagram of percent milliequivalents per liter of cations and anions for water samples. Numbers by symbols are sample-identification numbers from table 10.
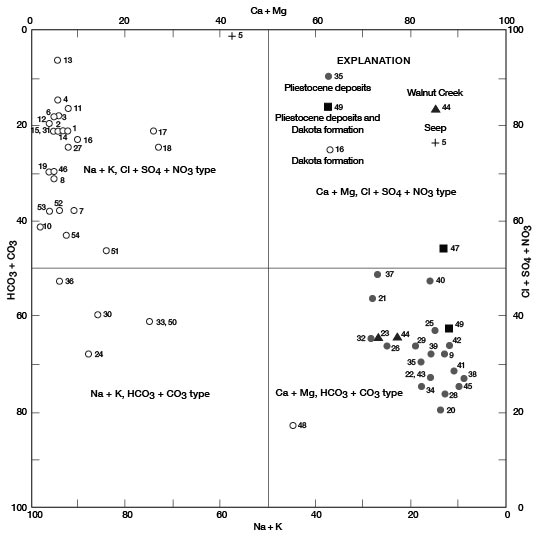
Figure 12--Trilinear diagram of percent milliequivalents per liter of anions for water samples. Numbers by symbols are sample-identification numbers from table 10.
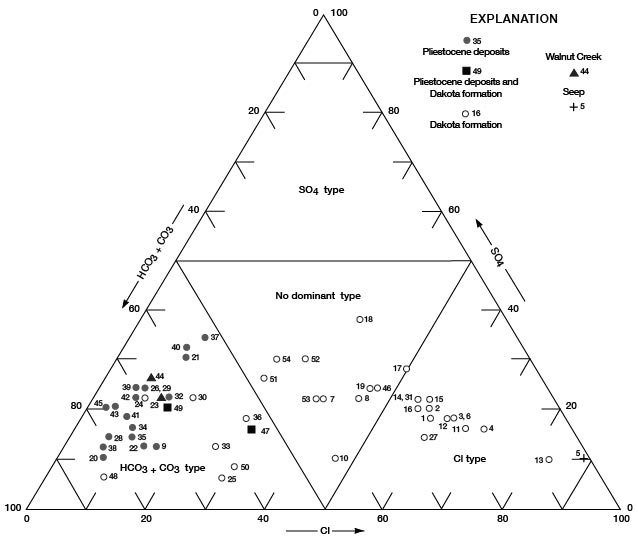
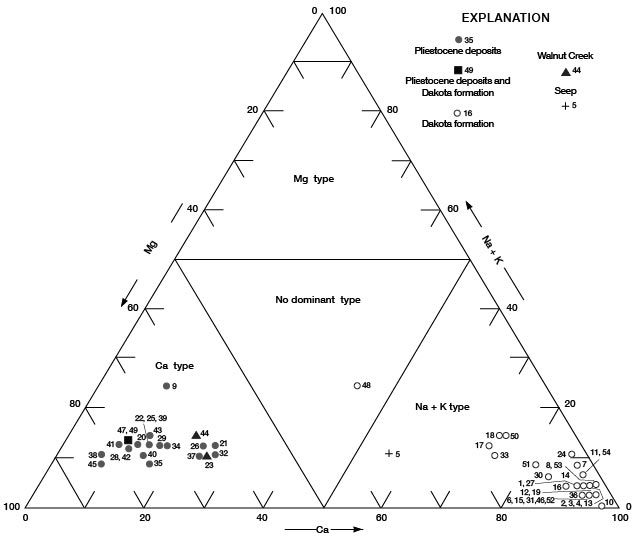
Figure 13--Trilinear diagram of percent milliequivalents per liter of cations for water samples. Numbers by symbols are sample-identification numbers from table 10.
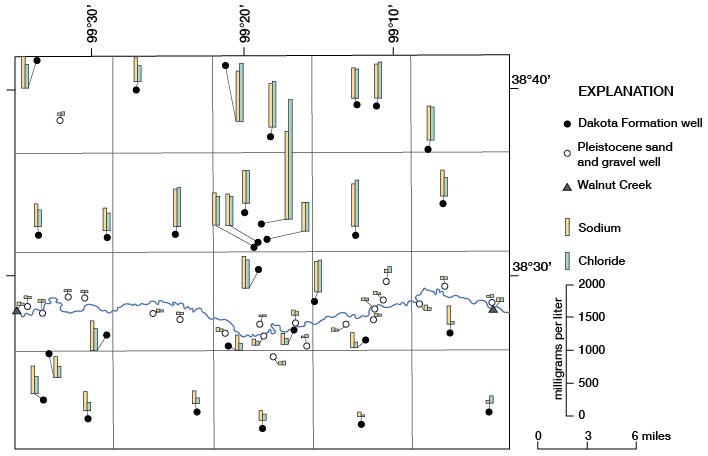
Sodium and Chloride
The large range in concentration of sodium and of chloride by location and aquifer is illustrated on figure 14. A significant decrease in chloride concentration relative to sodium concentration, as well as a noticeable decrease in total sodium and chloride, in water from the Dakota is apparent on the south side of Walnut Creek in Rs. 16-19 W. The reduction in sodium and chloride concentration may have resulted from recharge and dilution of water in the Dakota by water from the sand and gravel of Pleistocene age where the two aquifers are in contact in the valley of Walnut Creek. The area of contact begins somewhere in R. 19 W. and continues eastward through the county.
Figure 14--Concentrations of sodium and chloride in water samples.
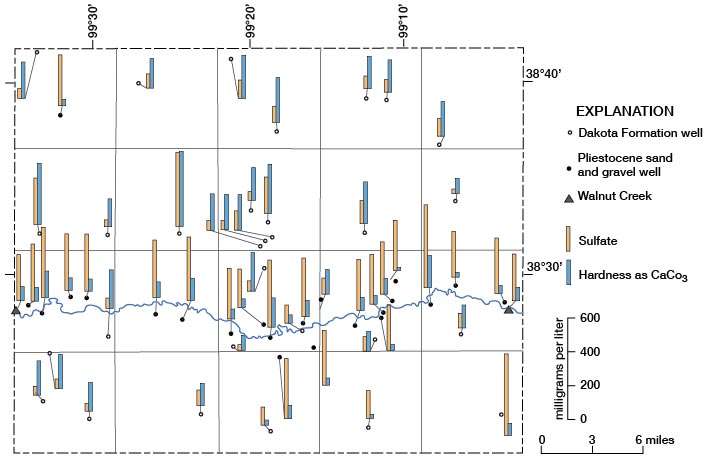
Hardness as CaCO3 and Sulfate
The locations where water samples were collected and the range in concentration of hardness and of sulfate in the water are shown on figure 15. In general, Pleistocene deposits contain water with higher concentrations of hardness and lower concentrations of sulfate than the Dakota. Water from the Dakota has a wide range in concentration of hardness and of sulfate. Figure 15 also indicates a possibility of some recharge and dilution of water in the Dakota by water from Pleistocene deposits, as there is some decrease in sulfate concentration in water from the Dakota on the south side of Walnut Creek.
Figure 15--Concentrations of hardness and sulfate in water samples.
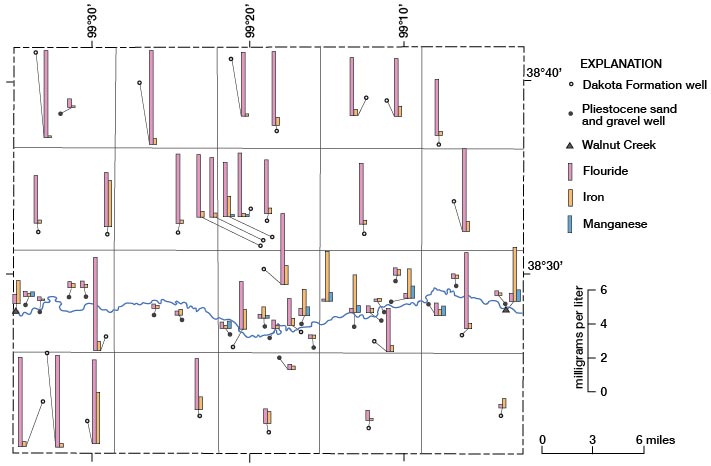
Fluoride, Iron, and Manganese
The locations where water samples were collected and the fluoride, iron, and manganese concentrations in the water are shown on figure 16. The large fluoride concentrations in all but three of the Dakota water samples and the smaller concentrations of fluoride in the water from the Pleistocene aquifers are readily apparent. Concentrations of iron differ greatly in water samples from both aquifers, and no pattern for amount of iron or location of sample is apparent. Manganese was found in 10 of the samples analyzed. Two samples of Dakota water contained small concentrations of manganese, and the sample from Walnut Creek on the east side of the county contained a relatively large concentration. Manganese was contained in seven other samples from the Pleistocene aquifer, but no pattern of concentration or location of samples is discernible.
Figure 16--Concentrations of fluoride, iron, and manganese in water samples.
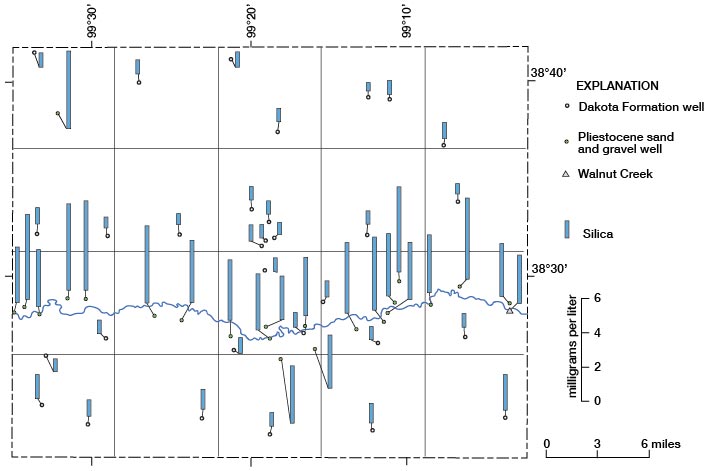
Silica
Inspection of the chemical analyses of water samples from Rush County reveals large differences in concentration of silica in water from the Dakota and in water from the Pleistocene aquifers. None of the 30 samples of water from the Dakota had concentrations that exceeded 14 mg/l of silica, and no samples of water from the Pleistocene deposits had concentrations less than 26 mg/l of silica. Thus, a concentration of 14 mg/l or less of silica for a water sample from an unknown aquifer would indicate a probable source of Dakota Formation for that sample. Figure 17 shows the locations and concentrations of silica for the water samples.
Figure 17--Concentrations of silica in water samples.
Chemical Constituents in Relation to Use of Water for Irrigation
The following discussion of the suitability of water for irrigation is adapted from Agricultural Handbook 60 of the U.S. Department of Agriculture (U.S. Salinity Laboratory Staff, 1954).
The development and maintenance of successful irrigation projects involves controlling the salinity and alkalinity of soils as well as supplying irrigation water to the land. Irrigation water quality, irrigation practices, and soil-drainage conditions are involved in saline and alkali soil control. Inadequate soil drainage and soil management or improper irrigation practices may cause soil to become unproductive through the accumulation of excess soluble salts or exchangeable sodium.
In areas where rainfall is sufficient and soil conditions are ideal, the soluble salts present in the soil are carried downward by percolating water and ultimately reach the water table. The process of dissolving and transporting soluble salts by the downward movement of water through the soil is termed leaching. The amount of water applied to the soil must be in excess of the amount needed by plants, or water will not percolate below the root zone, and mineral matter will accumulate at that point. Zones of impermeable soil near the surface can retard the downward movement of water, the soil may become waterlogged, and salts may be deposited. Unless soil drainage is adequate, leaching operations may not be successful, because leaching requires the passage of water through and away from the root zone.
The chemical characteristics of water that are the most important in determining its quality for irrigation are: (1) total concentration of soluble salts, (2) relative proportion of sodium to other principal cations (calcium, magnesium, and potassium), (3) concentration of boron or other toxic elements, and (4) under some conditions, the concentration of bicarbonate as related to the concentration of calcium plus magnesium.
Diagnosis and classification of the total concentration of soluble salts in irrigation water can be expressed in terms of electrical conductivity (specific conductance). Electrical conductivity is a measure of the capacity of ionized inorganic salts in solution to conduct an electrical current; it is generally expressed in micromhos per centimeter at 25°C. The electrical conductivity can be determined accurately in the laboratory, or an approximation of the electrical conductivity can be obtained by multiplying the total milliequivalents per liter of calcium, magnesium, sodium, and potassium by 100, or by dividing the dissolved solids in milligrams per liter by a factor that averages 0.64. However, in Rush County, only eight of the 53 analyses would be close to 0.64. The factor for most of the analyses in Rush County is about 0.60. Water with conductivity values below 750 micromhos per centimeter is satisfactory for irrigation insofar as salt content is concerned, although crops sensitive to salt may be adversely affected by irrigation water with conductivity values in the range 250 to 750 micromhos per centimeter. Water in the range 750 to 2,250 micromhos per centimeter is widely used, and satisfactory crop growth is obtained under favorable soil-drainage conditions and good management, but saline soil conditions will develop when leaching is incomplete. Very few instances are known where water with conductivity values greater than 2,250 micromhos per centimeter has been used successfully. The use of copious quantities of such water on soils and subsoils with excellent drainage may allow the more salt-tolerant crops to be grown.
The alkali hazard of an irrigation water is determined by the absolute and relative concentrations of sodium, potassium, calcium, and magnesium. In the past the relative proportion of sodium to the other principal cations in irrigation water generally was expressed as the percentage of sodium, expressed as milliequivalents, among the principal cations (referred to as the percent sodium). The sodium-adsorption ratio (SAR), used to express the relative activity of sodium ions in exchange reactions with soil, is a better measure of suitability of water for irrigation with respect to the sodium (alkali) hazard. The sodium-adsorption ratio may be determined by the formula
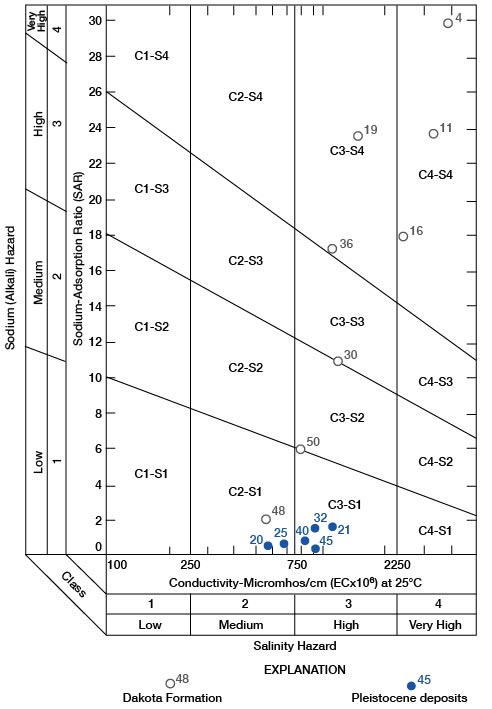
with ionic concentrations expressed in milliequivalents per liter. If the sodium-adsorption ratio and the electrical conductivity of a water are known, the suitability of the water for irrigation can be determined by plotting these values on the diagram shown on figure 18.
Figure 18--Diagram showing suitability of water for irrigation. Numbers by symbols are sample-identification numbers from table 10.
The significance and interpretation of the diagram for the classification of irrigation waters is as follows:
Low-salinity water (C1) can be used for irrigation with most crops on most soils with small probability that soil salinity will develop. A minimum of leaching is required; minimum leaching generally occurs under normal irrigation practices, except in soils of very low permeability.
Medium-salinity water (C2) can be used if moderate leaching occurs. Moderately salt-tolerant plants generally can be grown without special salinity-control practices.
High-salinity water (C3) cannot be used on soils of restricted drainage. Special management for salinity control may be required and plants with good salt tolerance should be grown, even on soils with adequate drainage.
Very high salinity water (C4) may be used occasionally under special circumstances. The soil must be permeable and have excellent drainage, irrigation water must be applied in excess to provide maximum leaching, and extremely salt-tolerant crops must be selected.
Low-sodium water (S1) can be used on most soils with scant danger of the development of harmful levels of exchangeable sodium.
Medium-sodium water (S2) present an alkali hazard in fine-textured soils under low-leaching conditions, unless gypsum is present in the soil. This water is usable on coarse-textured or organic soils of high permeability.
High-sodium water (S3) produces harmful levels of exchangeable sodium in most soils and requires special soil management for successful use. The soil must have good drainage, a high leaching rate, and organic matter additions. Chemical amendments such as calcium chloride, gypsum, sulfur, sulfuric acid, crushed limestone, and others may be required for replacement of exchangeable sodium. Harmful levels of exchangeable sodium may not develop in gypsiferous soils.
Very high sodium water (S4) generally is unsatisfactory for irrigation except at low to medium salinity, where solution of calcium from the soil or the use of a chemical amendment may make these waters usable.
All water samples from the Pleistocene aquifers in Rush County have a low alkali hazard and medium to high salinity hazard. Irrigation is successful in Rush County with water of this quality, which implies acceptable soil drainage with adequate leaching and good soil-management practices. Water from the Dakota is much less acceptable for irrigation. Water from the Dakota cannot be used to irrigate lawns and domestic gardens satisfactorily in much of the county. If the reader will note the position of Dakota water samples on figure 18, he will have a clearer understanding of why water from most of the wells in the Dakota cannot be used for irrigation, even for a garden plot, without careful management.
An appraisal of the quality of irrigation water should be concerned first with the determination of the salinity and alkali hazards by reference to figure 18. Consideration then may be given to independent characteristics, such as boron, other toxic elements, and bicarbonate, any one of which may change the quality rating. Soil-drainage characteristics and management, as well as water quality, must be considered also before water-use recommendations are made. The interested reader is referred to Agricultural Handbook 60 (U.S. Salinity Laboratory Staff, 1954) for a more complete discussion of the suitability of water for irrigation.
Sanitary Quality
The analyses of water listed in table 10 show only the amounts of dissolved mineral matter in the water and do not indicate the sanitary quality of the water. However, high concentrations of certain minerals, such as nitrate or chloride, may indicate pollution of the water supply.
The municipal supplies in Rush County are obtained from properly constructed wells, which meet the requirements of and are periodically examined by the Division of Environmental Health of the Kansas State Department of Health. Many of the people of the county, however, have private water supplies, and precautions should be taken to protect these supplies from pollution. Possible sources of pollution, such as barnyards, privies, and cesspools, should be as far as possible from well locations, and well casings should be sealed to a level below the water table. In general, dug wells are more vulnerable to contamination from the surface than drilled and cased wells, because they often are not effectively cased or sealed at the surface.
Prev Page--Walnut Creek || Next Page--Well Records
Kansas Geological Survey, Geology
Placed on web Aug. 22, 2008; originally published July 1973.
Comments to webadmin@kgs.ku.edu
The URL for this page is http://www.kgs.ku.edu/General/Geology/Rush/07_chem.html