![]()
Prev Page--Rock Units || Next Page--Walnut Creek
Ground Water
The following discussion of ground water in Rush County is devoted principally to the aquifer in Walnut Creek valley, which comprises the valley-fill and terrace deposits. Definitions of the terms used in the discussion are given in the Glossary of Terms.
Source
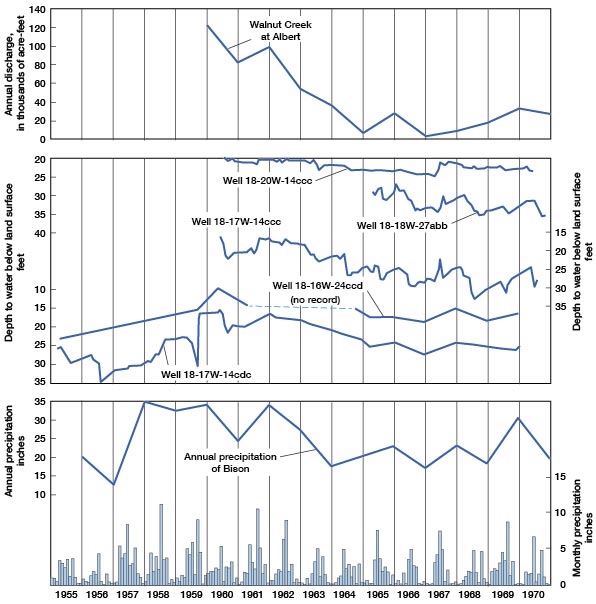
The primary source of ground water in Rush County is local precipitation. For example, the ground water in the valley-fill deposits of Walnut Valley is derived from the rain and snow on the entire watershed of Walnut Creek. Water in the Dakota Formation, on the other hand, is derived from rain and snow on the outcrop of the formation east of Rush County, and from unconsolidated water-saturated deposits, such as those in Walnut and Dry Walnut Creek valleys, that overlie the Dakota. Ground water, thus, consists of water that falls in the form of rain or snow and then percolates through the soil materials to the water table. Figure 9 illustrates the relationship between precipitation, ground-water levels in selected wells, and streamflow in Rush County.
Figure 9--Change in water level in five wells in Walnut Creek valley, monthly precipitation at Bison, and annual discharge of Walnut Creek at Albert.
Occurrence and Movement
Water in the unconsolidated deposits occurs in the interstices between the rock particles. The rate at which water will move through these aquifers depends on the hydraulic gradient and on the shape, size, and interconnection of the contained interstices. The quantity of ground water available to wells also depends on the areal extent and the saturated thickness of the aquifer. Interstices in sand and gravel are larger and better connected than interstices in silt and clay. Thus, water will move freely through a coarse gravel under a low hydraulic gradient, but will move with extreme slowness through clay even under a high hydraulic gradient.
The shape and slope of the water table in 1960 in Walnut Creek valley are shown on plate 1 by contours drawn through points of equal altitude of the water table. Ground water moves downgradient at right angles to the contours. The contours indicate that ground water was moving toward Walnut Creek from both sides of the valley and was discharging into the creek in 1960. The spacing of contours in Walnut Creek valley indicate a hydraulic gradient of about 5 feet per mile at the west boundary of Rush County to 3 feet per mile at the east boundary.
The quantity of water flowing through a given cross-sectional area of an aquifer can be computed by the formula:
Q = pAv = KIA
where Q is the quantity of water,
p is the porosity of the aquifer material,
A is the cross-sectional area,
v is the average velocity of ground water,
K is the hydraulic conductivity,
and I is the hydraulic gradient.
The approximate rate of movement of ground water through an aquifer is obtained by transposition of the above formula to:
V = KI / p
and for the units of feet, days, and miles to:
v = KI / 53 p
In the case of the aquifer in Walnut Creek valley, the amount of water entering Rush County as subsurface inflow at the Ness County line and the amount leaving as subsurface outflow at the Barton County line can be calculated. Additionally, the velocity of the ground water can be calculated. The results of these calculations are given in table 3.
Table 3--Calculated velocity and quantity of water moving through the aquifer at the west and east ends of Walnut Creek valley.
| Average aquifer saturated thickness (feet) |
Assumed porosity (percent) |
Average aquifer width (miles) |
Hydraulic gradient (feet per mile) |
Hydraulic conductivity (feet per day) |
Velocity (feet per day) |
Quantity of water | ||
|---|---|---|---|---|---|---|---|---|
| (Cubic feet per day) |
(Acre-feet per year) |
|||||||
| West end | 20 | 30 | 1 | 5 | 382 | 1.2 | 38,200 | 320 |
| East end | 70 | 30 | 2.5 | 3 | 221 | .4 | 116,000 | 970 |
Storage
The amount of recoverable water stored in an aquifer is a function of the volume of the aquifer and its storage coefficient (S).
Maps showing the configuration of the bedrock surface and the saturated thickness of the valley-fill and terrace deposits of Walnut Creek valley in 1960 are shown on plate 2. On the saturated thickness map the area between each pair of contours was planimetered and multiplied by the average saturated thickness to determine the volume of saturated material. The volume of saturated deposits was calculated to be 1,610,000 acre-feet. Based on an assumed storage coefficient of 0.15, the volume of water available for pumping in 1960 was determined to be 241,500 acre-feet. From a practical point of view, much less would be available for irrigation. Yields from wells would diminish substantially when less than half this quantity of water was pumped from storage.
Changes in Storage
One method of assessing changes in the amount of ground water in an aquifer involves periodic water-level measurements, construction of water-level-change maps from the measurements, and computation of the volume of material and water involved in the change. Unless outside influences such as heavy pumping upset natural conditions, the changes in storage in an aquifer reflect seasonal changes in precipitation and evapotranspiration. Water-level-change maps would illustrate, by minor fluctuations and trends, the essentially static conditions in an undisturbed aquifer. The aquifer in Walnut Creek valley is heavily pumped, and the change maps reveal the effect of large withdrawals of ground water for irrigation.
Changes in storage in the aquifer in Walnut Creek valley are documented by six water-level-change maps (pl. 2). Water-level measurements made in the spring of 1965 and each January from 1966 through 1970 are compared with the base measurements made in the spring of 1960. The maps were planimetered and the changes in volume of saturated material and volume of water were computed (table 4). The changes are all declines when related to the 1960 measurements, but when successive changes are compared, there are 3 years of declines and 2 years of gains.
Table 4--Changes in volume of saturated material and water in storage in Walnut Creek valley from 1960 to indicated year. [Plus (+) and minus (-) indicate increase or decrease in storage, respectively.]
| From 1960 to |
Decrease in volume of saturated material (acre-feet) |
Decrease in volume of water S = 0.15 (acre-feet) |
Change in volume of water between successive years (acre-feet) |
|---|---|---|---|
| 1965 | 257,000 | 38,550 | |
| -300 | |||
| 1966 | 259,000 | 38,850 | |
| -12,150 | |||
| 1967 | 340,000 | 51,000 | |
| +16,650 | |||
| 1968 | 229,000 | 34,350 | |
| -17,250 | |||
| 1969 | 344,000 | 51,600 | |
| +10,950 | |||
| 1970 | 271,000 | 40,650 | |
The volume of water in storage during the time from the spring of 1965 through January 1970 ranged from 189,900 to 207,150 acre-feet.
Discharge
Ground water in Walnut Creek valley is discharged from the aquifer by pumping by wells, evapotranspiration, subsurface outflow, and inflow to streams. In the section on movement of water, the subsurface outflow from the valley was estimated to be about 970 acre-feet per year.
Pumping by Wells
Pumpage from irrigation wells is reported to the Kansas State Board of Agriculture by irrigators. A summary of the estimated annual pumpage from the aquifer in Walnut Creek valley for the years 1958-67, based on the amounts reported, is given in table 5. The average annual pumpage during this period was 14,100 acre-feet.
Table 5--Estimated annual pumpage in Walnut Creek valley, 1958-67.
| Year | Pumpage (acre-feet) |
|---|---|
| 1958 | 5,800 |
| 1959 | 13,300 |
| 1960 | 9,900 |
| 1961 | 9,700 |
| 1962 | 7,300 |
| 1963 | 16,800 |
| 1964 | 18,900 |
| 1965 | 16,000 |
| 1966 | 21,700 |
| 1967 | 21,400 |
Evapotranspiration
Direct evaporation is limited to areas where the water table is near the land surface, such as along stream banks and in streambeds. This condition is restricted to a small part of the valley, and discharge by evaporation probably is not large.
Transpiration by plants from the saturated zone is not confined to the water courses where willow, cottonwood, and other trees are concentrated. Alfalfa may transpire considerable quantities of water from the aquifer. No quantitative estimate of evapotranspiration was made.
Inflow to Streams
Prior to the development of irrigation, Walnut Creek probably was a gaining stream through Rush County except during times of flooding. Examination of streamflow records at Albert, in Barton County 1 mile east of Rush County, indicates an alternating sequence of gaining and losing flow that reflects precipitation and pumping by wells. Streamflow at Albert, which is summarized in table 6, does not all come from ground water. The recorded flow represents two components: (1) overland flow directly from precipitation, and (2) inflow from ground water. No quantitative estimate of inflow to streams was made.
Table 6--Summary of streamflow of Walnut Creek at Albert. From U.S. Geological Survey (1962, 1969, 1967-72)
| Year | Mean daily streamflow cubic feet per second) |
Annual streamflow (acre-feet) |
||
|---|---|---|---|---|
| Maximum | Minimum | Mean | ||
| 1959 | 10,300 | 0.2 | 174 | 126,000 |
| 1960 | 3,850 | .5 | 113 | 81,860 |
| 1961 | 3,450 | 0 | 136 | 98,360 |
| 1962 | 1,770 | 9.6 | 75.2 | 54,480 |
| 1963 | 1,520 | 0 | 50.3 | 36,400 |
| 1964 | 251 | 0 | 9.24 | 6,700 |
| 1965 | 1,090 | 0 | 36.7 | 26,540 |
| 1966 | 232 | 0 | 3.3 | 2,390 |
| 1967 | 2,600 | 0 | 134 | 96,890 |
| 1968 | 1,830 | 0 | 23.7 | 17,190 |
| 1969 | 1,690 | 0 | 43.9 | 31,750 |
| 1970 | 2,820 | 0 | 36.0 | 26,090 |
Recharge
The aquifer in Walnut Creek valley is recharged by subsurface inflow from the west and tributary valleys on the north and south, and by seepage losses from Walnut Creek and tributary creeks during periods of high flow. These two increments of recharge result from local precipitation within Walnut Creek basin.
Subsurface Inflow
In the section on movement of water, subsurface inflow to the aquifer in Walnut Creek valley from the west was estimated to be 38,200 cubic feet per day, or 320 acre-feet per year. The combined subsurface inflow from Sandy, Otter, and Dry Creek valleys and Old Maid Fork valley on the south and Sand Creek valley on the north probably is at least an equivalent amount, although no formal quantitative determination of inflow from tributary valleys was made.
Seepage Losses from Streams
The drainage system of Walnut Creek basin carries large amounts of surface water into the valley. For this water to percolate to the saturated zone, the surface of the stream must be above the water table, and the sediments between the stream channel and the water table must be permeable. The sediments in Walnut Creek valley are permeable and the water table is below stream level after or during the irrigation season, after or during drought, or during some combination of these conditions. When a major flood occurs, the circumstances for recharge are enhanced because the stream may leave its bank and spread completely across the valley.
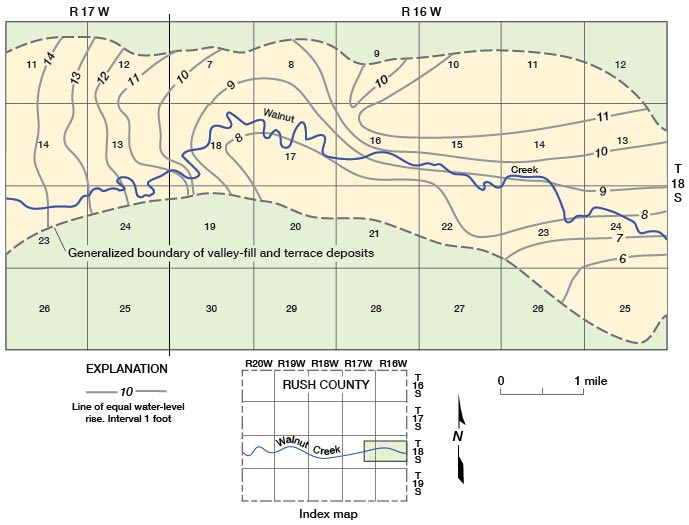
A large amount of recharge occurred during the flood of September 1959. This flood, which was the largest of record for Walnut Creek, spread water completely over the valley. The author had measured water levels in 21 wells in the first half of September 1959. The same wells were remeasured in the spring of 1960. A map showing cbange in water level for part of the valley in eastern Rush County (fig. 10) was constructed and analyzed. The volume of saturated material and the volume of water in storage increased by 104,000 and 15,600 acre-feet, respectively. The surface area of the valley included on the map was about 11,700 acres. Thus, about 1 1/3 feet of water was recharged by the flood of September 1959 to each acre of valley in the mapped area. If this amount of recharge is applied to the entire area of the valley inundated by the flood in Rush County, the total increase in storage would be about 50,000 acre-feet.
Figure 10--Water-level rise in valley-fill and terrace deposits in Walnut Creek valley, eastern Rush County, September 1959 to May-June 1960.
The changes in volume of water between successive years (table 4), when combined with the estimated annual pumpage (table 5), also indicate large amounts of recharge to the aquifer (table 7). Table 7 gives the change in volume of water in the aquifer, the estimated volume of water pumped from the aquifer, and the estimated volume of recharge to the aquifer. The volume of recharge is calculated by adding algebraically the volume of change to the volume pumped.
Table 7--Change in volume of water in, volume of water pumped from, and volume of water recharged to the aquifer in Walnut Creek valley for 1965-69.
| Year | Change (acre-feet) |
Pumpage (acre-feet) |
Recharge (acre-feet) |
|---|---|---|---|
| 1965 | -300 | 16,000 | 15,700 |
| 1966 | -12,150 | 21,700 | 9,550 |
| 1967 | +16,650 | 21,400 | 38,050 |
| 1968 | -17,250 | 20,000 1 | 2,750 |
| 1969 | +10,950 | 20,000 1 | 30,950 |
| Cumulative Total | -2,100 | 99,100 | 97,000 |
| 1. Assumed values | |||
This approach to determination of recharge is dependent on estimated pumpage based on reported usage, an estimated storage coefficient, and the assumption that the stream was losing and not gaining during periods of high flow. The principal evidence for a losing stream is the extensive periods of no flow at Albert.
Even if the estimates for pumpage and storage coefficient are not considered to be of the right order of magnitude, the changes in volume of saturated material are real. The cumulative change in volume of saturated material for the 5-year period 1965-69 is a decline of only 14,000 acre-feet (2,100 acre-feet of water divided by 0.15 storage coefficient). Table 8 expresses the change in volume of saturated material in percent of volume of saturated material in 1960. Beginning in 1965 the volume of saturated material has changed by as much as 7 percent of the 1960 total in 1 year. This indicates that significant recharge occurs, and occurs rapidly. The drainage network of Walnut Creek, which funnels runoff into the valley, thus concentrating precipitation, is the most effective recharge mechanism to the aquifer.
Table 8--Decrease in volume of saturated material in Walnut Creek valley, 1960-70.
| Year | Volume of saturated material (acre-feet) |
Percent of 1960 volume of saturated material |
Percent decrease in 1960 volume of saturated material |
Percent change in volume of saturated material between successive years |
|---|---|---|---|---|
| 1960 | 1,610,000 | |||
| --- | ||||
| 1965 | 1,353,000 | 84 | 16 | |
| 0 | ||||
| 1966 | 1,351,000 | 84 | 16 | |
| -5 | ||||
| 1967 | 1,270,000 | 79 | 21 | |
| +7 | ||||
| 1968 | 1,381,000 | 86 | 14 | |
| -7 | ||||
| 1969 | 1,266,000 | 79 | 21 | |
| +4 | ||||
| 1970 | 1,339,000 | 83 | 17 | |
Prev Page--Rock Units || Next Page--Walnut Creek
Kansas Geological Survey, Geology
Placed on web Aug. 22, 2008; originally published July 1973.
Comments to webadmin@kgs.ku.edu
The URL for this page is http://www.kgs.ku.edu/General/Geology/Rush/05_gw.html