![]()
Prev Page--Geologic Setting || Next Page--Ground Water, part 2
Ground Water
Source and Occurrence
Ground water in Decatur County is derived almost entirely from precipitation within the county or nearby. Part of the precipitation returns to the air by evaporation, part moves away as surface runoff into streams, and part infiltrates into the ground. A very small part percolates downward through the soil and underlying strata until it reaches the water table and becomes ground-water recharge. The ground water moves slowly to points of discharge in directions determined largely by the shape and slope of the water table. Ground water is discharged by springs or wells, by seeps into streams, or by evaporation or transpiration near the land surface, commonly along stream valleys. The movement of ground water in Decatur County is generally eastward, and some ground water leaves the county by subsurface outflow.
Water Table and Movement of Ground Water
The configuration of the water table in Decatur County is shown on plate 1 by water-table contours that connect points of equal altitude of the water level. The water-table contours were compiled from measurements of depth to water in wells and test holes, the surface altitudes of which were determined by plane table and alidade. Water-level measurements and altitudes of land surface for the wells are given in table 6 and for the test holes are given at the end of this report. Ground water moves downgradient at right angles to the contours.
The water table has a generally eastward gradient of 10 to 15 feet per mile. Along the four principal valleys, however, the contours swing sharply upstream, indicating that ground water is moving from the Ogallala Formation toward the stream valleys and into the alluvial deposits. In some localities near the principal valleys, the water table has a gradient of about 50 feet per mile toward the stream valleys. Considerable discharge occurs by evaporation and transpiration along the valley sides where the contact of the Ogallala Formation and the underlying Cretaceous bedrock is near the land surface.
Recharge
Local Precipitation
The mean annual precipitation in Decatur County is about 18 inches, but only a small fraction of the precipitation reaches the water table and becomes ground water. The slope of the land surface and the type of material through which the water must percolate are important factors that affect the amount and frequency of recharge. The broad, flat alluvial surfaces of the principal valleys offer excellent conditions for recharge. The alluvial deposits contain sand, silt, and sandy silt, and the water table is near the land surface; consequently, the infiltration of water generally is relatively rapid. Conversely, in the maturely dissected uplands, the land surface is characterized by waterways and moderately steep slopes underlain by massive beds of silt and buried soils, and the water table lies at a considerable depth. These areas receive relatively little recharge, probably less than half an inch per year.
Streams and Ponds
The four principal streams that flow across Decatur County are entrenched below the water table and receive water from the ground-water reservoir. Thus, they do not constitute sources of recharge, except in local areas where heavy pumping from wells near major streams may have lowered the water table temporarily below the level of the stream channel. The smaller tributary streams are above the water table, and during periods of stream runoff following rain or melting snow, some water seeps into the underlying deposits to supplement the ground water. Surface ponds also constitute a source of recharge where the ponds are above the water table and are underlain by permeable materials.
Infiltration of Irrigation Water
Recharge from water applied for irrigation can amount to 25 or 30 percent of the applied water where good recharge conditions exist. In Decatur County, most of the irrigated land is in the principal valleys where the alluvial deposits consist chiefly of silt, sand, and sandy silt, and where the soil is relatively permeable. Thus, conditions in the valleys are conducive to the return of irrigation water to the groundwater reservoir. Although there were 83 irrigation wells in the county at the time of this investigation in 1962, only a small part of the land was under irrigation. Because irrigation is not extensive and because the areal extent of the alluvial valleys is relatively small, the amount of recharge to the aquifer from the return of irrigation water is not considered significant. However, the return of irrigation water to the ground-water reservoir represents a source of recharge, and as irrigation becomes more extensive, an increasing amount of recharge will occur. Only a few irrigation wells have been drilled in the uplands of Decatur County; thus, the recharge from irrigation water applied in the uplands is negligible.
Discharge
Natural
Before any wells were drilled in Decatur County, the ground-water reservoir was in approximate equilibrium--that is, the average annual recharge plus subsurface inflow of ground water to the county was equal to the average annual discharge plus the outflow of ground water from the county. The factors producing discharge by ground-water movement into the principal stream channels and by evaporation and transpiration by plants in low-lying areas of shallow water table have changed little, and loss by these means still accounts for the major part of the ground-water discharge from the county.
Wells
Municipal water departments reported a use of about 400 acre-feet of ground water in 1961. According to records of the Division of Water Resources of the Kansas State Board of Agriculture, 17,000 acre-feet of ground water per year was appropriated for irrigation as of October 1963. About 3,900 acre-feet of ground water was reported used for irrigation in 1962 by 60 irrigation wells, with more than 20 irrigators not reporting. An estimated annual use of 6,000 to 8,000 acre-feet of ground water is used for irrigation in Decatur County.
Most rural residents obtain water for domestic and livestock purposes from small-diameter drilled wells equipped with cylinder pumps, many of which are powered by windmills. The yields of these wells are small and probably average about 1 gpm (gallon per minute). Because of their considerable number and long pumping periods, however, such wells represent an important withdrawal of ground water, which is estimated to be 750 to 1,000 acre-feet per year for household and livestock purposes.
Inflow and Outflow
As indicated by the water-table contours on plate 1, the movement of ground water in the interstream areas is in an easterly direction. Hence, a small amount of recharge from precipitation that occurs in eastern Rawlins County moves into western Decatur County. Computations using the saturated thickness of water-bearing deposits along geologic section A-A' (pl. 2) near the western edge of the county, the water-table gradient (pl. 1), and an assumed average coefficient of permeability of 300 gpd (gallons per day) per square foot indicate a subsurface inflow of about 5,000 acre-feet per year. The saturated thickness along section B-B' in the eastern part of the county is about equal to the saturated thickness along section A-A'. Assuming equal permeability, the subsurface outflow from Decatur County probably is equal to the subsurface inflow.
Water in Storage
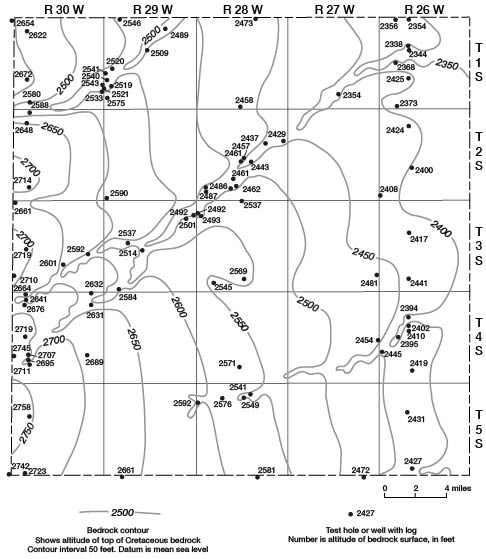
To determine the quantity of ground water in storage in the Pliocene and Pleistocene deposits, a map showing the saturated thickness of the deposits (fig. 3) was prepared by superimposing a contour map of the water table upon a contour map of the bedrock surface (fig. 4) and connecting points of equal saturated thickness. The area between contours was measured with a planimeter and was multiplied by the average saturated thickness to give the volume of saturated materials. Assuming a specific yield (ratio of the volume of water the saturated part of the aquifer will yield, by gravity, to its own volume) of 20 percent from the saturated materials, about 5 million acre-feet of ground water would be available for pumping from the Pliocene and Pleistocene deposits if the deposits were completely drained. From a practical standpoint, much less water than this would be available for pumping.
Figure 3--Saturated thickness of Tertiary and Quaternary deposits.
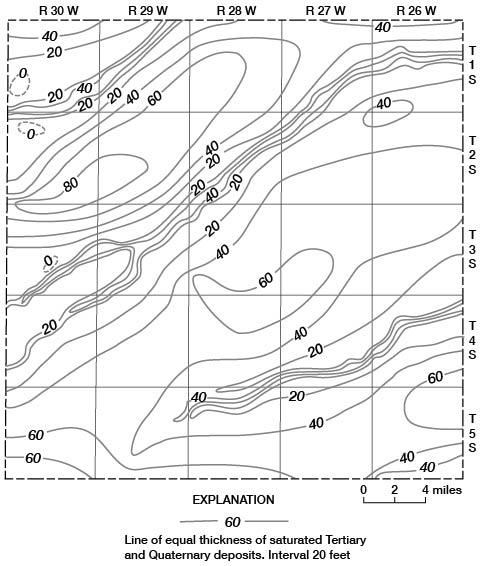
Figure 4--Configuration of Cretaceous bedrock surface beneath Tertiary and Quaternary deposits.
Hydrologic Properties of Water-Bearing Materials
Coefficients of Storage and Transmissibility
The quantity of ground water that an aquifer will yield to wells depends upon the hydrologic properties of the material forming the aquifer. The hydrologic properties of greatest significance are the ability of the aquifer to store and transmit water, which are measured by the coefficients of storage and transmissibility, respectively. Aquifer tests provide the data to compute these coefficients.
The coefficient of storage (S) may be expressed as the change in the stored volume of water per unit surface area of the aquifer per unit change in the component of head normal to that surface.
The coefficient of transmissibility (T) may be expressed as the rate of flow of water, in gallons per day,, through a vertical strip 1 foot wide and extending the full height of the saturated thickness of the aquifer, under a hydraulic gradient of 1 foot per foot, at the prevailing ground-water temperature.
The field coefficient of permeability (P) can be computed by dividing the coefficient of transmissibility by the aquifer thickness (m), and may be expressed as the rate of flow of water, in gallons per day, through a cross-sectional area of 1 square foot, under a hydraulic gradient of 1 foot per foot, at the prevailing ground-water temperature.
Aquifer tests were made in three of the principal valleys. An existing irrigation well and two observation wells constructed at appropriate distances from the pumped well were used for each aquifer test.
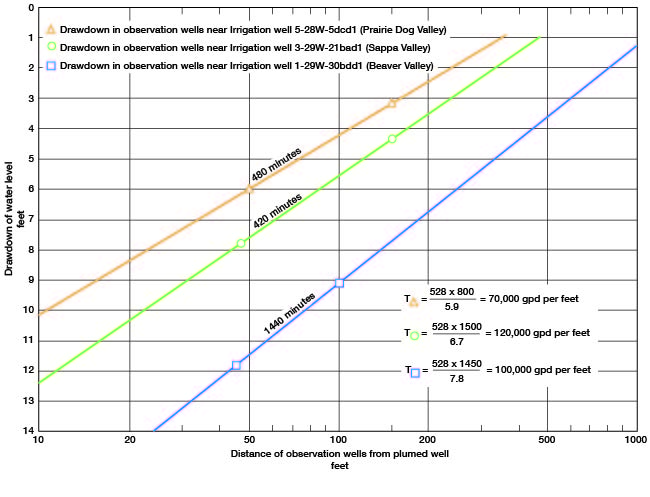
Figure 5 shows the results of the tests using drawdown measurements in the observation wells and analysis by the Thiem method. The coefficients of transmissibility also were computed by the Theis nonequilibrium method and by the Jacob modified nonequilibrium method. The results obtained by these methods were similar to those obtained by the Thiem method shown on figure 5. The theory of these methods and its application are discussed by Ferris and others (1962). The results of the aquifer-test analyses indicated coefficients of transmissibility of 70,000 gpd per foot near well 5-28W-5dcd1 in Prairie Dog Creek valley, 120,000 gpd per foot near well 3-29W-21bad1 in Sappa Creek valley, and 100,000 gpd per foot near well 1-29W-30bdd1 in Beaver Creek valley.
Figure 5--Drawdown of water level in observation wells during aquifer tests.
The aquifer tests indicate the hydrologic properties only in the vicinity of the test, but they are believed to be indicative of the hydrologic properties that can be expected for much of the alluvial deposits along the principal valleys in the county.
Drawdown, Distance, and Time Relationships
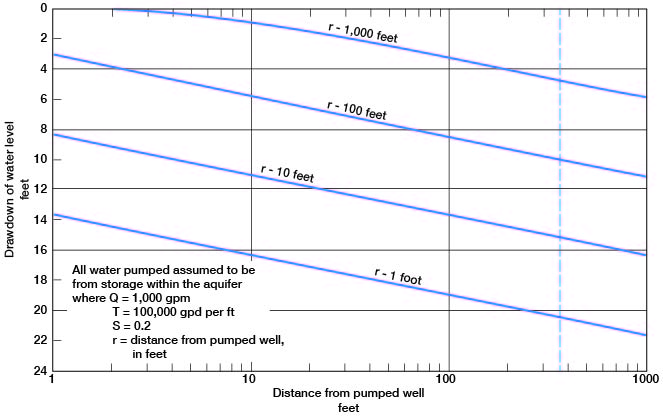
To compute possible future drawdowns in the vicinity of any particular well, assumptions were made that all water pumped would be from storage within the aquifer, that pumping would be continuous at a rate of 1,000 gpm, and that the water-bearing material has a T of 100,000 gpd per foot and an S of 0.2. The computations of drawdown are in error to the extent that these assumptions are in error, but the computations are probably of the right order of magnitude.
Figure 6 shows, under the assumed conditions specified, the drawdown of water level at any distance from the pumped well after 1, 10, 100, and 1,000 days. After 10 days of pumping at a rate of 1,000 gpm, the drawdown 10 feet from the well would be 11 feet, the drawdown 100 feet from the well would be 5.8 feet, and the drawdown 1,000 feet from the well would be nearly 1 foot. After 100 days of pumping, the drawdown 100 feet from the well would be 8.4 feet.
Figure 6--Drawdown of water level at any distance from the pumped well after pumping has begun.
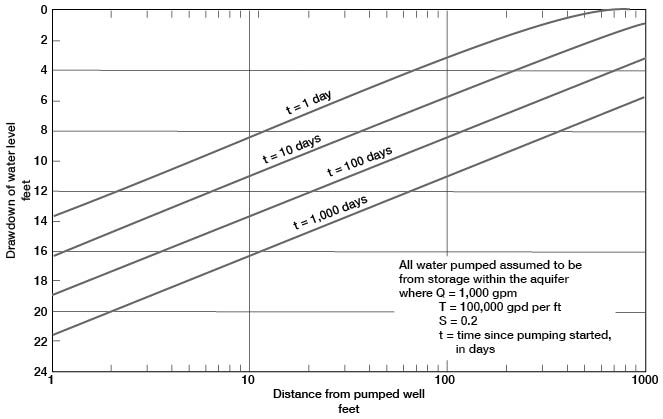
Figure 7 shows the rate of decline caused by pumping under the assumed conditions. The decline of water level 100 feet from a well pumped at 1,000 gpm would be 5.8 feet after 10 days, and 8.4 feet after 100 days.
Figure 7--Drawdown of water level at any time after pumping has begun.
The cone of depression caused by a pumping well will increase in area and depth in response to pumping. Large-yielding wells can interfere with one another unless the wells are spaced at considerable distances. When wells mutually interfere, the drawdown at any one point will be the sum of the drawdowns produced by each well at that point. When wells interfere, the pumping lift in each well is increased and the discharge is decreased. To maintain a constant discharge would further increase the drawdown and extend the cone of depression. In areas where many wells are pumping from the same aquifer, the large cone of depression resulting from mutual interference may not have sufficient time to recover between pumping periods, and the water level may decline persistently.
As shown by the water-table contours on plate 1, ground water in the Ogallala Formation along the edges of the upland areas is moving toward the stream valleys. Because the water table is near the land surface along the valley edges and because of the slow movement of the water, a large part of this water either is evaporated or is transpired by plants. However, if sufficient ground water were pumped from the valley aquifers to appreciably increase the gradient of the water table along the edges of the valleys, it is possible that part of the ground water now lost to evaporation and transpiration in the shallow-water areas along the edges of the valleys could be induced into the deeper part of the valley aquifers, and thus eventually become available for pumping by wells. In addition, increased pumping from a valley aquifer could lower the water level sufficiently to intercept some water that now discharges into streams.
Most of the land irrigated with ground water in Decatur County is in the alluvial valleys, and about half of the land irrigated is in Sappa Creek valley, which extends northeastward across the central and northern parts of the county. If it is assumed that the alluvial deposits within Sappa Valley have an average width of half a mile, a length of 30 miles, an average saturated thickness of 30 feet, and a specific yield of 20 percent, then about 60,000 acre-feet of water is in storage in the alluvial deposits of Sappa Creek valley. Obviously, it would be impossible to pump all this water from the aquifer. However, the amount of water in storage in Sappa Valley, as computed above, is nearly 4 times the amount of ground water appropriated (17,000 acre-feet) in all Decatur County in 1962, and is more than 15 times as much as the ground water pumped for irrigation (3,900 acre-feet) in Decatur County in 1962, as reported by the Division of Water Resources of the Kansas State Board of Agriculture.
Availability
The people of Decatur County are fortunate that potable ground water is available at most places in the county. In some areas, the quantity is sufficient only for domestic and stock supplies. In other areas, yields of several hundred to more than 1,000 gpm are available from wells and, therefore, are sufficient for irrigation or industrial use.
There are two principal aquifers in Decatur County--the alluvial deposits in the stream valleys and the Ogallala Formation that underlies the upland areas. The quantity of water that is available from the aquifers is dependent upon the saturated thickness and the permeability of the deposits. Although the upland areas have considerably more areal extent than the alluvial valleys, the highest-yielding wells are in the major valleys, and it is here that most of the irrigation is practiced. The higher yields are due to the higher permeabilities of the valley deposits.
Depth to water level in the valleys generally ranges from about 10 to 40 feet below land surface. Depth to water level in the uplands exceeds 100 feet below land surface in most places and is 200 feet or more below land surface in some of the topographically higher parts of the county.
Alluvial Valleys
The relatively narrow alluvial deposits along the principal stream valleys are an important source of ground water. The alluvial deposits are shown on the geologic map (pl. 1) as alluvium and the Crete Formation. The alluvium underlies the modern flood plain. The Crete Formation underlies the terrace along the outer margins of the valleys, the terrace ranging in most places from 10 to 25 feet higher than the flood plain. The alluvium of Wisconsinan and Recent age and the fluvial deposits of the Crete Formation are lithologically similar and are in contact with each other. The water table in the alluvial valleys is continuous in both the alluvium and the Crete Formation.
Many domestic and stock wells obtain water from the valley deposits, and most irrigation wells in the county are in the stream valleys. Small to large quantities of ground water are available from the valley deposits at most localities in the principal valleys. In areas of greater saturated thickness, ground water in quantities adequate for irrigation can be obtained. Yields of irrigation wells along Beaver Creek and Sappa Creek valleys range from about 500 gpm to a reported 1,450 gpm, and yields from irrigation wells along Prairie Dog Creek and the North Fork Solomon River valleys range from about 300 to 700 gpm.
Ogallala Formation
The uplands of Decatur County are mantled by deposits of silt, sand, and gravel of the Ogallala Formation, which are as much as 240 feet thick and average about 200 feet thick in most of the upland areas. The saturated thickness of the deposits exceeds 80 feet in places and averages about 45 feet (fig. 3). The Ogallala Formation is the most widespread water-bearing formation in the county. It supplies water for most domestic and stock purposes and for several irrigation wells. Yields of wells in the Ogallala range from a few gallons per minute from domestic and stock wells to a reported 825 gpm from irrigation well 5-30W-35bcb.
Only a few irrigation wells had been drilled in the uplands of Decatur County at the time of this field investigation, although wells in areas of greater saturated thickness may be expected to yield as much as 500 gpm.
Prev Page--Geologic Setting || Next Page--Ground Water, part 2
Kansas Geological Survey, Geology
Placed on web Oct. 8, 2008; originally published Dec. 1969.
Comments to webadmin@kgs.ku.edu
The URL for this page is http://www.kgs.ku.edu/General/Geology/Decatur/04_gw.html