![]()
Prev Page--Ground Water, part 1 || Next Page--Well Records
Ground Water, continued
Utilization
Data on 355 wells are given in table 6. Only part of the domestic and stock wells were visited, but records were made of all municipal and irrigation wells in the county at the time of this investigation. The principal uses of ground water in the county are given below.
Domestic and Stock Supplies
One of the chief uses of ground water in Decatur County is for domestic and stock purposes. Quantities of ground water adequate for domestic and stock needs are available at nearly all places in the county. Most domestic and stock wells are drilled wells equipped with displacement-type pumps. Most pumps are operated by windmills; others are operated by electric or gasoline motors, or by hand.
Municipal Supplies
Data regarding city wells and details of well construction are given in table 6. Data collected at the time of this field investigation regarding municipal water supplies are given below. Dresden (1960 population of 134) had no municipal water supply.Oberlin
Oberlin obtains its water supply from six drilled wells in the alluvial deposits of Sappa Creek valley near the southern and southeastern edges of the city. Each well yields about 300 gpm and is equipped with an electrically driven turbine pump. The elevated storage tank has a capacity of 500,000 gallons. Water used in 1961 was about 112 million gallons, as reported by the city water department.
Norcatur
Norcatur obtains its water supply from three drilled wells in the Ogallala Formation near the northwestern edge of the city. Two of the wells are equipped with electrically driven turbine pumps; the other well is equipped with a diesel-driven centrifugal pump. Storage is provided by an elevated storage tank with a capacity of 50,000 gallons. Water used in 1961 was about 10 million gallons, as reported by the city water department.
Jennings
Jennings obtains its water supply from one drilled well in the alluvial deposits of Prairie Dog Creek valley near the northwestern edge of the city. The well is equipped with an electrically driven turbine pump with a capacity of 200 gpm. Storage is provided by an elevated storage tank with a capacity of 45,000 gallons. Water used in 1961 was about 7 million gallons, as reported by the city water department.
Irrigation Supplies
There were 83 irrigation wells in Decatur County in the fall of 1962, all but 10 of which were in the alluvial valleys. Beaver Creek valley, which extends across the northwestern corner of the county, had the greatest concentration of irrigation wells and also the highest-yielding wells in general. In this valley, a number of irrigation wells have yields exceeding 1,000 gpm, and nearly all have yields exceeding 500 gpm.
Sappa Creek valley had the greatest number of irrigation wells (nearly half) because of its greater length in transversing the county. Yields of several hundred gallons per minute may be obtained from wells in Sappa Creek valley and a few irrigation wells have yields of about 1,000 gpm.
Several irrigation wells were in Prairie Dog Valley. Although most yields were less than those in Beaver Valley or Sappa Valley, the irrigation wells in Prairie Dog Valley yield about 300 to 500 gpm.
The North Fork Solomon Valley extends across the southeastern corner of Decatur County. The length of the valley in the county is about 6 miles, and several irrigation wells were in this part of the valley. The yield of most of these wells ranged from about 300 to 700 gpm.
At the time of this investigation, only 10 irrigation wells were in the uplands deriving water from the Ogallala Formation. Reported yields of irrigation wells in the uplands ranged from 55 to 825 gpm.
According to records of the Division of Water Resources of the Kansas State Board of Agriculture, 17,000 acre-feet of ground water was appropriated for the irrigation of 10,500 acres as of October 1963. Irrigators reported that about 3,900 acre-feet of ground water from 60 irrigation wells was applied in 1962 to about 3,000 acres, with more than 20 irrigators not reporting.
Chemical Quality
The chemical character of ground water in Decatur County is indicated by analyses of samples from wells deriving water from the principal aquifers (table 3). The results of the analyses are given in parts per million. The analyses show only the dissolved mineral constituents and do not indicate the sanitary condition of the water.
Table 3--Chemical analyses of water from selected wells.1 [Dissolved constituents and hardness in parts per million.]
| Well number |
Depth, in feet |
Geologic source |
Date of collection |
Temp. (°F) |
Dissolved solids (evaporated at 180°C) |
Silica (SiO2) |
Iron (Fe) |
Manganese (Mn) |
Calcium (Ca) |
Magnesium (Mg) |
Sodium and Potassium (Na+K) |
Bicarbonate (HCO3) |
Sulfate (SO4) |
Chloride (Cl) |
Fluoride (F) |
Nitrate2 (NO3) |
Hardness as CaCO3 | Specific conductance (micromhos at 25°C) |
|
|---|---|---|---|---|---|---|---|---|---|---|---|---|---|---|---|---|---|---|---|
| Total | Non- carbonate |
||||||||||||||||||
| 1-26W-14bcc | 32 | Alluvium | 5-13-1963 | 57 | 626 | 21 | 0.07 | 130 | 30 | 44 | 390 | 188 | 18 | 0.6 | 2.2 | 448 | 128 | ||
| 1-27W-33dba | 34 | Alluvium | 5-14-1953 | 56 | 428 | 19 | .78 | 101 | 21 | 28 | 393 | 44 | 20 | .4 | 1.8 | 338 | 16 | ||
| 1-28W-27bba | 165 | Ogallala Formation |
5-14-1953 | 56 | 280 | 24 | 1.2 | 43 | 19 | 29 | 239 | 21 | 12 | .9 | 13 | 186 | 0 | ||
| 1-29W-1bbc | 28 | Alluvium | 5-12-1953 | 56 | 1,147 | 33 | .09 | 172 | 48 | 169 | 617 | 282 | 133 | .6 | 5.8 | 626 | 120 | ||
| 1-29W-10cdb | 22 | Alluvium | 5-12-1963 | 55 | 440 | 28 | .89 | 100 | 14 | 35 | 332 | 50 | 31 | .3 | 19 | 307 | 35 | ||
| 1-29W-19ccd | 40 | Alluvium | 8-15-1962 | 648 | 35 | .51 | 0.62 | 109 | 33 | 80 | 551 | 97 | 21 | .9 | .8 | 408 | 0 | 1,080 | |
| 1-29W-30bdd1 | 75 | Alluvium | 9-14-1962 | 55 | 571 | 43 | .03 | .00 | 107 | 27 | 60 | 415 | 82 | 29 | .6 | 18 | 378 | 35 | 890 |
| 1-30W-20ddd | 112 | Ogallala Formation |
5-13-1953 | 56 | 293 | 34 | .71 | 53 | 17 | 25 | 268 | 13 | 12 | .8 | 5.8 | 202 | 0 | ||
| 1-30W-31dad | 43 | Crete Formation |
8-15-1962 | 58 | 557 | 31 | .21 | .35 | 85 | 25 | 83 | 446 | 89 | 23 | 1.1 | .4 | 315 | 0 | 930 |
| 2-26W-11cda | 125 | Ogallala Formation |
5-13-1963 | 55 | 307 | 28 | .06 | 84 | 10 | 10 | 295 | 7.4 | 9.0 | .1 | 13 | 250 | 8 | ||
| 2-27W-4cbb | 92 | Ogallala Formation |
5-14-1963 | 56 | 283 | 22 | .11 | 57 | 18 | 20 | 268 | 18 | 10 | .5 | 5.8 | 216 | 0 | ||
| 2-28W-12cdd | 53 | Alluvium | 5-14-1963 | 55 | 392 | 30 | .66 | 71 | 21 | 44 | 378 | 21 | 18 | .5 | .9 | 264 | 0 | ||
| 2-28W-28bcd | 61 | Alluvium | 8-15-1962 | 547 | 37 | .45 | .44 | 101 | 25 | 59 | 407 | 96 | 24 | .6 | 4.0 | 355 | 21 | 900 | |
| 2-30W-13ddd | 169 | Ogallala Formation |
5-13-1963 | 58 | 306 | 32 | .49 | 48 | 19 | 31 | 254 | 25 | 14 | .7 | 11 | 198 | 0 | ||
| 3-26W-30bcc | 142 | Ogallala Formation |
5-13-1953 | 55 | 269 | 25 | .16 | 64 | 11 | 16 | 254 | 10 | 10 | .3 | 7.5 | 204 | 0 | ||
| 3-28W-32bcb | 205 | Ogallala Formation |
8-16-1962 | 283 | 49 | .03 | .00 | 43 | 17 | 29 | 239 | 12 | 10 | .9 | 4.3 | 178 | 0 | 460 | |
| 3-29W-18cbd | 57 | Alluvium | 8-15-1962 | 58 | 626 | 37 | .01 | .41 | 110 | 35 | 63 | 427 | 113 | 47 | .8 | 10 | 418 | 68 | 1,040 |
| 3-29W-21bad1 | 62 | Alluvium | 9-18-1962 | 55 | 712 | 33 | .02 | .51 | 131 | 34 | 73 | 432 | 178 | 42 | .6 | 7.5 | 466 | 112 | 1,090 |
| 3-29W-31dda | 49 | Alluvium | 9-2-1964 | 56 | 612 | 33 | .00 | .00 | 118 | 21 | 74 | 449 | 95 | 37 | .7 | 12 | 381 | 13 | 970 |
| 3-30W-3cba | 129 | Ogallala Formation |
8-15-1962 | 59 | 296 | 50 | .16 | .04 | 45 | 17 | 29 | 246 | 17 | 10 | .8 | 6.2 | 182 | 0 | 480 |
| 3-30W-27bdc | 50 | Alluvium | 5-12-1953 | 56 | 520 | 22 | .57 | 103 | 28 | 44 | 378 | 99 | 36 | .8 | 1.2 | 372 | 62 | ||
| 4-26W-11abd | 50 | Alluvium | 5-14-1953 | 56 | 391 | 28 | 2.2 | 84 | 19 | 32 | 366 | 28 | 19 | .4 | 1.0 | 288 | 0 | ||
| 4-26W-17ccd | 70 | Alluvium | 8-13-1962 | 398 | 37 | .70 | .18 | 90 | 19 | 27 | 354 | 33 | 17 | .5 | .4 | 302 | 12 | 670 | |
| 4-26W-21ccc | 155 | Ogallala Formation |
5-13-1953 | 59 | 274 | 28 | .49 | 62 | 13 | 17 | 268 | 5.3 | 10 | .3 | 6.6 | 208 | 0 | ||
| 4-27W-17dac | 165 | Ogallala Formation |
8-13-1962 | 282 | 47 | .01 | .00 | 54 | 15 | 22 | 251 | 6.6 | 9.0 | .6 | 4.9 | 196 | 0 | 470 | |
| 4-29W-3dbb | 132 | Ogallala Formation |
5-15-1953 | 58 | 250 | 35 | .60 | 40 | 16 | 23 | 229 | 8.2 | 10 | .9 | 3.6 | 166 | 0 | ||
| 5-26W-20ddd | 110 | Ogallala Formation |
5-15-1953 | 58 | 250 | 27 | .26 | 54 | 14 | 14 | 239 | 8.2 | 10 | .5 | 4.2 | 192 | 0 | ||
| 5-26W-32dbc | Alluvium | 8-14-1962 | 356 | 44 | .35 | .00 | 69 | 20 | 27 | 300 | 23 | 12 | .7 | 13 | 254 | 8 | 590 | ||
| 5-26W-34cad | 55 | Alluvium | 5-15-1953 | 57 | 441 | 19 | 1.9 | 101 | 25 | 25 | 381 | 57 | 25 | .5 | .8 | 355 | 43 | ||
| 5-28W-3dbb | 56 | Alluvium | 8-16-1962 | 457 | 43 | .01 | .14 | 90 | 24 | 40 | 386 | 52 | 16 | .6 | 1.8 | 323 | 7 | 750 | |
| 5-28W-5dcd1 | 58 | Alluvium | 9-11-1962 | 56 | 393 | 42 | .04 | .00 | 90 | 17 | 27 | 334 | 25 | 22 | .3 | 5.8 | 294 | 20 | 640 |
| 5-29W-10bab | 36 | Ogallala Formation |
9-19-1962 | 56 | 385 | 36 | .15 | .00 | 94 | 16 | 24 | 356 | 23 | 9.0 | .6 | 7.1 | 300 | 8 | 620 |
| 5-29W-16bca | 80 | Ogallala Formation |
9-18-1962 | 56 | 299 | 41 | .21 | .00 | 59 | 16 | 18 | 249 | 14 | 9.0 | .3 | 19 | 213 | 9 | 470 |
| 5-29W-20cdc | 110 | Ogallala Formation |
9-19-1962 | 56 | 277 | 49 | .37 | .00 | 50 | 16 | 18 | 232 | 10 | 10 | .8 | 9.3 | 191 | 1 | 430 |
| 5-29W-28bdd | 48 | Alluvium | 8-14-1962 | 403 | 45 | .01 | .06 | 74 | 21 | 37 | 337 | 38 | 13 | .9 | 8.4 | 271 | 0 | 670 | |
| 5-30W-34abb | 62 | Ogallala Formation |
5-12-1953 | 57 | 278 | 29 | .27 | 55 | 18 | 16 | 249 | 16 | 12 | 1.0 | 8.0 | 211 | 7 | ||
| 5-30W-35bcc | 200 | Ogallala Formation |
8-14-1962 | 281 | 43 | .01 | .06 | 58 | 15 | 15 | 251 | 7.4 | 10 | .5 | 8.0 | 206 | 0 | 480 | |
| 1. Samples analyzed by H. A. Stoltenberg, Kansas State Department of Health. 2. In areas where the nitrite content of water is known to exceed 45 ppm, the public should be warned of the potential dangers of using the water for infant feeding (U.S. Public Health Service, 1962, p. 7). |
|||||||||||||||||||
Chemical Constituents in Relation to Use
Ground water in Decatur County is predominantly a calcium bicarbonate type. The water is moderately hard, with most of the hardness resulting from the presence of calcium and magnesium (carbonate hardness). The characteristics and concentrations of the principal chemical constituents are given in table 4. Most samples of water contained less than 500 ppm (parts per million) dissolved solids, and only one sample contained more than 1,000 ppm. The samples were low in nitrate and chloride content. Only one sample exceeded 250 ppm sulfate. The iron content was fairly high in many samples.
Table 4--Quality of water in relation to use. Concentrations as recommended by the U.S. Public Health Service (1962).
| Principal constituents |
Characteristics | Acceptable maximum concentration, in parts per million |
Range in concentration, in parts per million |
|---|---|---|---|
| Dissolved solids | Water high in dissolved solids may have a disagreeable taste or a laxative effect. When water is evaporated, the residue consists mainly of the minerals listed in table 3. | 500 | 250-1,147 |
| Hardness | Hardness is caused by calcium and magnesium. Forms scale in vessels used in heating or evaporative processes. Hardness is commonly noticed by its effect when soap is used with the water. Carbonate hardness can be removed by boiling, noncarbonate hardness cannot. | 166-626 | |
| Iron (Fe) | Stains cooking utensils, plumbing fixtures, and laundry. Water may have a disagreeable taste. | 0.3 | 0-2.2 |
| Fluoride (F) | Fluoride concentration of about 1 ppm in drinking water used by children during the period of calcification of teeth prevents or lessens the incidence of tooth decay; 1.5 ppm may cause mottling of the tooth enamel (Dean, 1936). Bone changes may occur with concentrations of 8-20 ppm. | 1.2 | 0.1-1.1 |
| Nitrate (NO3) | Nitrate concentration of 90 ppm may cause cyanosis in infants (Metzler and Stoltenberg, 1950). Comly (1945) states that concentrations of 45 ppm may be harmful to infants. Adverse effects from drinking high-nitrate water are also possible in older children and adults. | 45 | 0.4-19 |
| Sulfate (SO4) | Derived from solution of gypsum and oxidation of iron sulfides (pyrite, etc.). Concentrations of magnesium sulfate (Epsom salt) and sodium sulfate (Glauber's salt) may have a laxative effect on some persons. | 250 | 5.3-282 |
| Chloride (Cl) | Chloride in ground water may be derived from connate marine water in sediments, surface contamination, or solution of minerals containing chlorides. | 250 | 9-133 |
Ground water in the alluvial valleys is somewhat more mineralized than ground water in the Ogallala Formation. The sulfate content was appreciably higher in the alluvial valleys, particularly along Sappa Creek and Beaver Creek valleys.
Sanitary Considerations
The analyses of water in table 3 give only the dissolved-solids content and do not indicate the sanitary quality of the water. Water containing mineral matter that imparts an objectionable taste or odor may be free from harmful bacteria and safe for drinking. Conversely, water clear and pleasant to the taste may contain harmful bacteria. Great care should be taken to protect domestic and public water supplies from pollution. To guard against contamination, a well must be properly sealed to keep out dust, insects, vermin, debris, and surface water. Wells should not be placed where barnyards, privies, or cesspools are possible sources of pollution.
Suitability of Water for Irrigation
Sodium is required in very limited amounts for most plant growth. However, sodium in high concentrations is not only toxic to plants but also detrimental to the soil, particularly where leaching is not adequate. It has been widely recommended that the percentage of sodium (equivalents per million of sodium divided by total equivalents per million of sodium, potassium, calcium, and magnesium) should not exceed 50 or 60 percent. In 1954, the staff of the U.S. Salinity Laboratory proposed that the sodium hazard of irrigation water could best be expressed in terms of the sodium-adsorption ratio, or SAR. This ratio expresses the relative activity of sodium ions in exchange reactions with soil. The effect of sodium in irrigation water is discussed in detail in U.S. Department of Agriculture Handbook 60 (U.S. Salinity Laboratory Staff, 1954), which was used as a guide for the following discussion of the relation of sodium to irrigation water.
Deterioration of soil that was originally nonsaline and nonalkaline may result if an excess of soluble salts or exchangeable sodium is allowed to accumulate as a result of inadequate leaching and drainage of the soil. If the amount of water applied to the soil is not more than is needed by plants, water will not percolate downward below the root zone, and mineral matter will accumulate. Likewise, impermeable soil zones near the surface can retard the downward movement of water and cause waterlogging of the soil and deposition of salts.
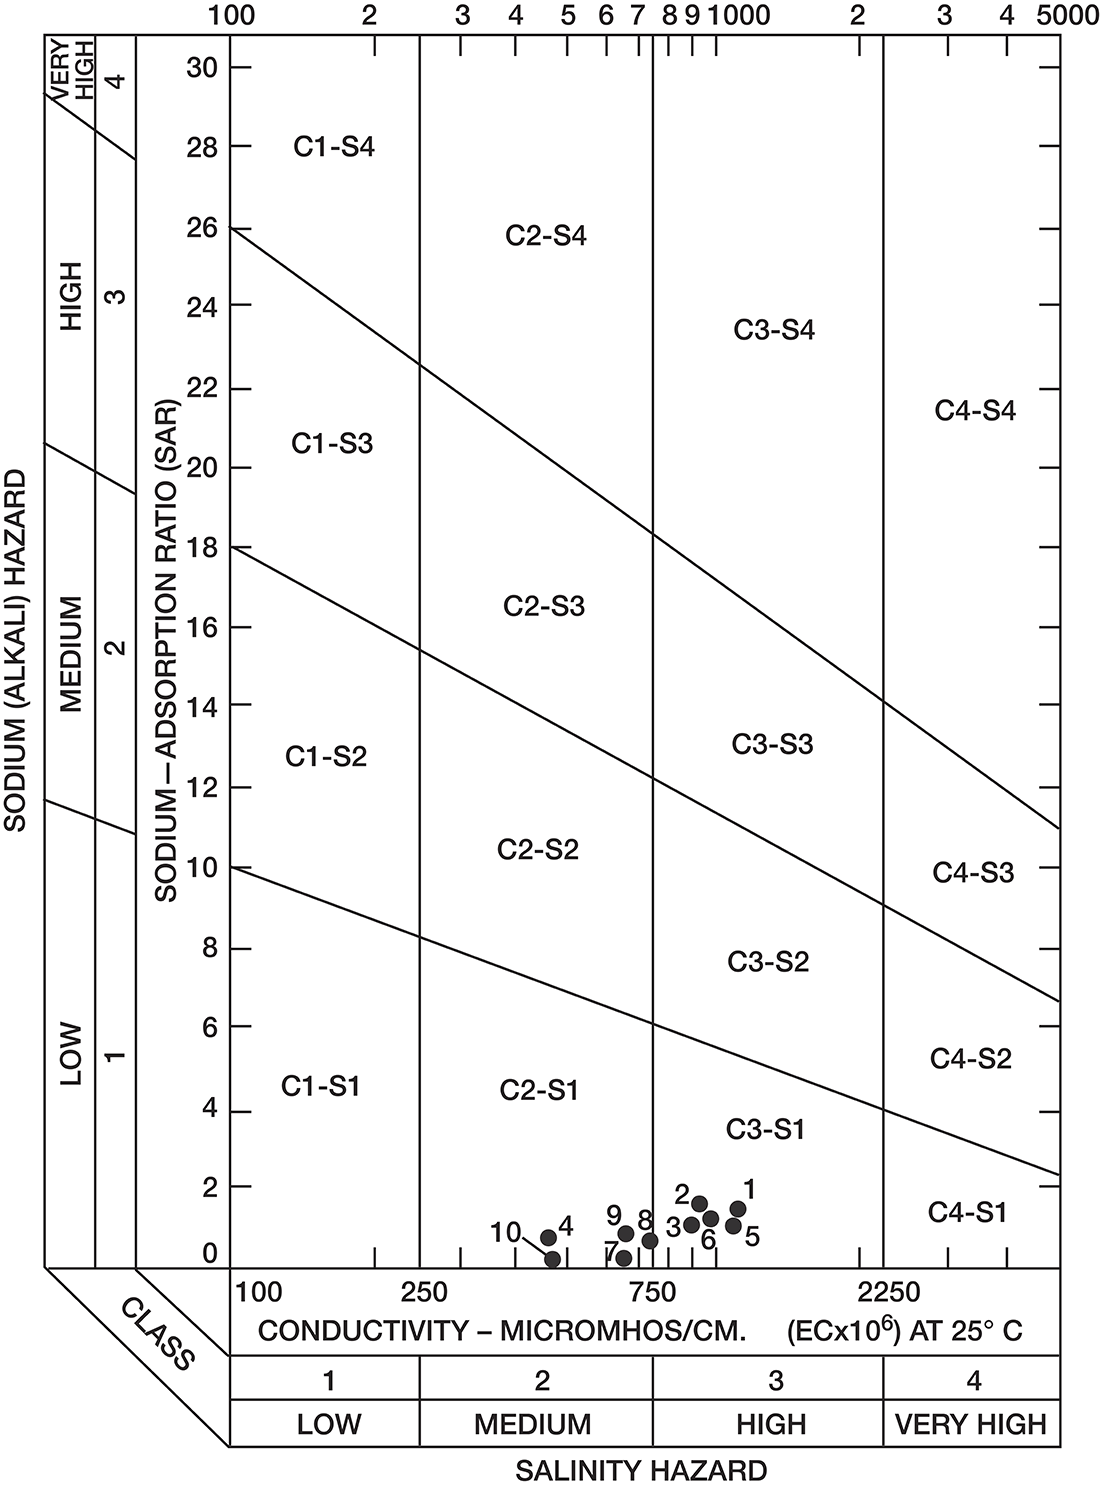
Analyses of water samples from 10 irrigation wells deriving water from the principal aquifers in Decatur County were used to illustrate the suitability of ground water for irrigation (table 5).
Table 5--Suitability for irrigation of ground water from selected wells.
| Well number |
Sample number on figure 8 |
Na (equivalents per million) |
Ca + Mg (equivalents per million) |
SAR | Conductivity (micromhos per centimeter at 25°C) |
|---|---|---|---|---|---|
| 1-29W-19ccd | 1 | 2.91 | 8.15 | 1.45 | 1,080 |
| 1-30W-31dad | 2 | 2.96 | 6.30 | 1.65 | 930 |
| 2-28W-28bcd | 3 | 1.83 | 7.10 | 1.00 | 900 |
| 3-28W-32bcb | 4 | .87 | 3.55 | .65 | 460 |
| 3-29W-21bad1 | 5 | 2.39 | 9.33 | 1.15 | 1,090 |
| 3-29W-31dda | 6 | 2.44 | 7.62 | 1.30 | 970 |
| 4-26W-17ccd | 7 | .74 | 6.05 | .43 | 670 |
| 5-28W-3dbb | 8 | 1.30 | 6.46 | .70 | 750 |
| 5-29W-28bdd | 9 | 1.17 | 5.42 | .65 | 670 |
| 5-30W-35bcc | 10 | .39 | 4.12 | .27 | 480 |
Sodium-adsorption ratios and electrical conductivities are plotted on figure 8 to provide a classification of waters for irrigation use. Low-sodium water (S1) can be used for irrigation on most soils with little danger of development of harmful levels of exchangeable sodium. Medium-sodium water (S2) may be used safely on coarse-textured or organic soils having good permeability, but S2 water will present an appreciable sodium hazard in certain fine-textured soils, especially under poor-leaching conditions. With increasing sodium hazard, harmful levels of exchangeable sodium will result in most soils unless special soil management is practiced, such as good drainage, leaching, and additions of organic matter.
Low-salinity water (C1) can be used for irrigation on most soils with little likelihood that soil salinity will develop. Medium-salinity water (C2) can be used if a moderate amount of leaching occurs. With increasing salinity, less exchangeable sodium can be tolerated and more leaching will be required to prevent salinity damage. On figure 8, all the waters were classified as low-sodium water (S1) and either medium-salinity water (C2) or high-salinity water (C3).
Figure 8--Classification of water used for irrigation (method of the U.S. Salinity Laboratory Staff, 1954). Number by circle refers to table 5.
Prev Page--Ground Water, part 1 || Next Page--Well Records
Kansas Geological Survey, Geology
Placed on web Oct. 8, 2008; originally published Dec. 1969.
Comments to webadmin@kgs.ku.edu
The URL for this page is http://www.kgs.ku.edu/General/Geology/Decatur/04_gw2.html