Kansas Geological Survey, Open-File Rept. 93-1
Annual Report, FY92--Page 19 of 20
Little or no water-quality data is available for northwestern Kansas. Contours drawn in northwestern Kansas in the current draft maps are based on a few points of actual water samples or estimates of water chemistry from the interpretation of geophysical logs of oil and gas wells. The log-interpreted values were made by the U.S. Geological Survey during a regional study of the Great Plains (Dakota) aquifer in the west-central United States. However, the regional TDS and chloride contour maps of the U.S. Geological Survey do not appear consistent in northwestern Kansas; that is, there are different patterns of TDS and chloride concentrations where similar patterns were expected. The KGS is planning to estimate TDS from a more intensive study of available geophysical logs in northwestern Kansas and to estimate chloride from the TDS values. The research will enable revision for better accuracy and consistency of the TDS and chloride maps.
The water-quality distributions for most of the dissolved constituent and chemical property maps are illustrated as contoured intervals with different colors that become more intense with increasing concentration. The maps are prepared by computer extraction and plotting of chemical data for well locations using the database management system ARC/INFO, contouring by hand based on a knowledge of the hydrogeology, digitizing the contours, and generating and plotting maps with ARC/INFO. The maps show distributions for the naturally occurring concentrations or values for water-quality parameters.
Nitrate, one of the inorganic constituents of special interest for drinking water assessment, occurs naturally at low concentrations, below a few milligrams per liter as nitrate-nitrogen, in most aquifers. High nitrate concentrations are derived from anthropogenic activities and are generally local. Thus contouring of nitrate values in a manner similar to the contouring of dissolved constituents with a mainly natural source would produce a regional map that would incorrectly predict nitrate concentrations in the aquifer, because the distances between wells typical for the density of water-quality data available for the Dakota aquifer are much greater than those for wells used to assess the influence of local contamination. The procedure selected for displaying nitrate concentrations involves computer selection of circles filled with different colors for ranges of nitrate values, with the size of the circle proportional to the actual nitrate concentration.
The number of wells in the Dakota aquifer yielding high nitrate concentrations is appreciably larger in the eastern outcrop and subcrop band than in the confined aquifer and the subcrop area overlain by the High Plains aquifer. The eastern outcrop and subcrop area also contains a greater density of all wells than the confined and High Plains subcrop areas. However, the percentage of wells with high nitrate concentrations is also greater in the eastern outcrop and subcrop area compared with the other two types of areas. In the outcrop and subcrop area Lincoln County contains a greater number of wells with high nitrate concentrations than the other counties.
Most of the wells in the outcrop and subcrop area are used for domestic and stock purposes. Although some higher nitrate contents have been found in some of the ground waters collected and analyzed by the KGS, most of the high nitrate concentrations tend to be in samples with older collection dates. Irrigation wells and newer domestic and stock wells tend to yield water with substantially lower nitrate content. The waters at or near the surface in rural areas or small towns often are high in nitrate because of the oxidation of nitrogen-containing animal wastes in barnyard areas and human wastes in septic tanks and drainage lines. Older well construction methods, in which a gravel pack was often placed in the drilled borehole to nearly the surface or in some cases where the annular space was left open, have probably allowed surface or near-surface drainage containing wastes to enter the well. Several older wells in the confined Dakota area near the eastern subcrop and outcrop band also yielded waters with high dissolved nitrate contents, definitely indicating well construction as the problem, because recharge could not penetrate to the confined Dakota aquifer in the time since European settlement of the area. Improved regulations on domestic and stock well construction, promulgated and enforced by the Kansas Department of Health and Environment and carried out by well construction companies, appear to have resulted in better protection of the Dakota aquifer from high nitrate concentrations associated with older well construction practices.
High nitrate concentrations add to the TDS content of a water and are also accompanied by other dissolved constituents that affect their total content in the ground water. The local contamination of ground waters in the Dakota aquifer affects the concentrations of constituents that are naturally present and for which contoured distribution maps have been prepared. Therefore the natural distributions of the constituents most associated with the high nitrate are distorted. The chemistry of the high-nitrate waters was examined to determine the correlation with other dissolved constituents and to remove this distortion in the maps.
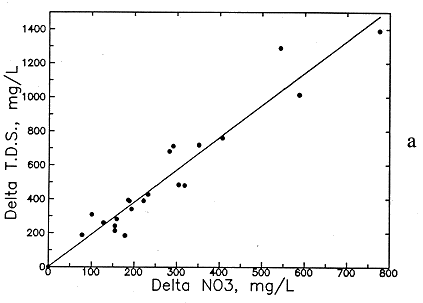
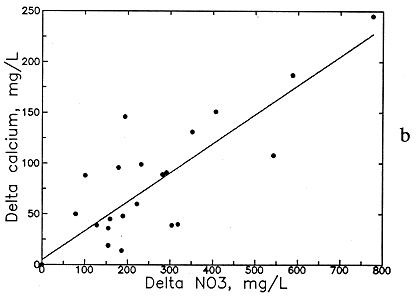
Preliminary examination of the high-nitrate ground waters in the Dakota aquifer indicates that the contents of calcium, sodium, chloride, and magnesium are greater than expected for nearby ground waters. Data for other aquifers also suggest that these are the constituents usually associated with high nitrate. Data for high-nitrate well waters in the Dakota aquifer were then compared with low-nitrate ground waters in the same area containing similar ranges of sulfate and bicarbonate contents to determine calcium, magnesium, sodium, chloride, and TDS concentrations added by the local contamination. The difference (delta) in the concentrations of each constituent and TDS for each pair of high- and low-nitrate analyses was plotted against the nitrate difference, and an equation was fitted to the data based on linear regression. The best correlation was obtained for delta TDS versus delta nitrate (see Figure 54a), but significant correlations were also obtained for delta calcium, magnesium, sodium, and chloride (Figures 54b-56a). The delta calcium plus magnesium represented as hardness associated with the nitrate increase is shown in Figure 56b. The linear regression equations for each association are listed in Table 8. The scatter in the plots is probably related to the various sources of high nitrate, including animal wastes, septic effluents, nitrogen fertilizers, and the oxidation of nitrogen-containing organic matter in soil. Each of these sources could have different relative amounts of cations and anions associated with the nitrate.
Figure 54--Increase in (a) total dissolved solids (TDS) concentration and (b) calcium concentration with increase in nitrate contamination of ground waters in the Dakota aquifer.


Figure 55--Increase in (a) magnesium concentration and (b) sodium and potassium concentration with increase in nitrate contamination of ground waters in the Dakota aquifer.
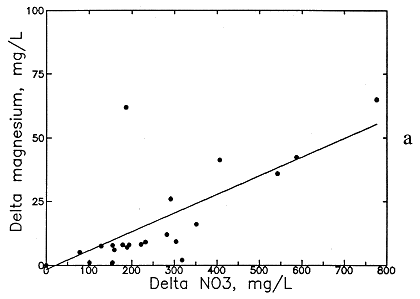
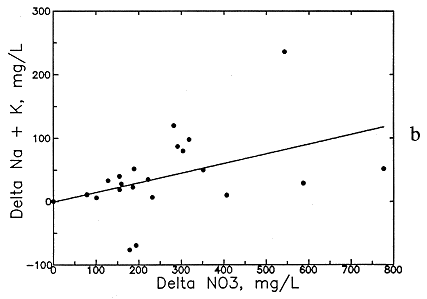
Figure 56--Increase in (a) chloride concentration and (b) hardness concentration with increase in nitrate contamination of ground waters in the Dakota aquifer.
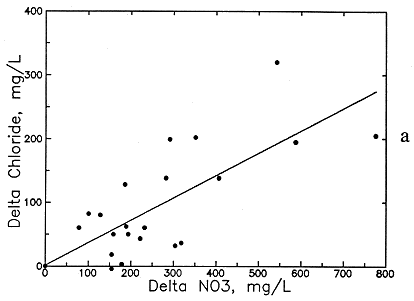
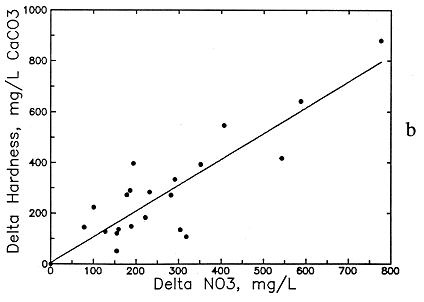
The increases in TDS and hardness from nitrate contamination are several hundred milligrams per liter for many waters (see Figures 54a and 56b) and can be as high as a few hundred milligrams per liter for calcium and chloride (see Figures 54b and 56a) and tens of milligrams per liter for magnesium and sodium (see Figure 55). These increases substantially affect the values used for generating contours for the maps of each of these chemical parameters. Correction equations based on the linear regressions were incorporated into a computer program that links with the database in ARC/INFO. The program examines each record in the database for nitrate and generates a corrected value for each chemical parameter associated with nitrate if the nitrate-nitrogen content in the water-quality record is over 3 mg/l. The corrected values were plotted next to a point for each well along with points and values for the low-nitrate waters on a map to allow revision of the isoconcentration contours.
Table 8.--Equations for the Association of Dissolved Constituents with Nitrate Contamination of Ground Waters in the Dakota Aquifer. The delta concentration refers to the increase in a dissolved constituent concentration (in mg/l) associated with a nitrate-nitrogen content greater than 3 mg/l. The maximum natural nitrate was selected as 3 mg/L nitrate-nitrogen (13.3 mg/l as nitrate).
Equations for nitrate expressed as nitrate-nitrogen
Delta TDS = 8.406 (NO3-N - 3) + 2.1
Delta Hardness as CaCO3 = 4.506 (NO3-N - 3) + 5.6
Delta Ca = 1.269 (NO3-N - 3) + 4.8
Delta Mg = 0.325 (NO3-N - 3)
Delta Cl = 1.556 (NO3-N - 3) + 1.5
Delta Na = 0.675 (NO3-N - 3)
Equations for nitrate expressed as nitrate
Delta TDS = 1.899 delta (NO3 - 13.3) + 2.1
Delta Hardness as CaCO3 = 1.018 (NO3 - 13.3) + 5.6
Delta Ca = 0.287 (NO3 - 13.3) + 4.8
Delta Mg = 0.073 (NO3 - 3)
Delta Cl = 0.352 (NO3 - 13.3) + 1.5
Delta Na = 0.152 (NO3 - 13.3)
The draft fluoride map was originally contoured for the intervals <1, 1-2.5, 2.5-5, and 5 mg/l. The standard for fluoride in public water supplies in Kansas was recently increased from 1.8 mg/l to 4 mg/l to fit the maximum contaminant levels established by the federal government. A level of 2 mg/l is the recommended level. The contours will be revised to reflect these levels by changing to intervals of <1, 1-2, 2-4, 4-6, and >6 mg/l dissolved fluoride.
Table 9--Assessment of water-quality data for the Dakota aquifer based on drinking-water and water-classification limits. Criteria are current primary or secondary drinking-water standards or, in the absence of a promulgated standard, suggested upper limits of the Kansas Department of Health and Environment for drinking water. The two higher limits for chloride and TDS are classification values for fresh and usable water. "Number of < values" means the "Number of values less than the limit of detection."
| Number Analyzed | Concentration (mg/l) | Number above criterion | Percentage above criterion | Limit of detection (mg/l) | Number of < values | ||||||||
|---|---|---|---|---|---|---|---|---|---|---|---|---|---|
| Constituent | Sites | Samples | Minimum | Average | Median | Maximum | Criterion | Sites | Samples | Sites | Samples | ||
| Alkalinity | 864 | 1224 | < 1 | 294 | 260 | 1600 | 300 | 310 | 384 | 35.9 | 31.4 | 1 | 0 |
| Ammonia-N | 68 | 114 | <0.01 | 0.392 | 0.078 | 5.823 | 0.1 | 36 | 52 | 52.9 | 45.6 | 0.01 | 19 |
| Arsenic | 136 | 159 | <0.001 | 0.005 | <0.001 | 0.096 | 0.05 | 2 | 2 | 1.5 | 1.3 | 0.001 | 88 |
| Barium | 104 | 109 | <0.001 | 0.075 | 0.034 | 0.366 | 1 | 0 | 0 | 0.0 | 0.0 | 0.001 | 1 |
| Cadmium | 66 | 71 | <0.001 | 0.001 | <0.001 | 0.020 | 0.005 | 3 | 3 | 4.6 | 4.0 | 0.001 | 54 |
| Calcium | 919 | 1285 | 1.6 | 111 | 71 | 2130 | 200 | 108 | 114 | 11.8 | 8.9 | 0.1 | 0 |
| Chloride | 997 | 1352 | 2.7 | 1229 | 65 | 36500 | 250 | 263 | 327 | 26.4 | 24.2 | 0.1 | 0 |
| Chloride | 997 | 1352 | 2.7 | 1229 | 65 | 36500 | 500 | 188 | 215 | 18.9 | 15.9 | 0.1 | 0 |
| Chloride | 997 | 1352 | 2.7 | 1229 | 65 | 36500 | 5000 | 74 | 75 | 7.4 | 5.6 | 0.1 | 1 |
| Chromium | 103 | 106 | <0.001 | 0.003 | 0.004 | 0.013 | 0.1 | 0 | 0 | 0.0 | 0.0 | 0.001 | 29 |
| Copper | 64 | 74 | <0.001 | 0.013 | 0.003 | 0.330 | 1.3 | 0 | 0 | 0.0 | 0.0 | 0.001 | 17 |
| TDS | 861 | 1218 | 58 | 2908 | 600 | 63800 | 500 | 524 | 685 | 60.9 | 56.2 | 1 | 0 |
| TDS | 861 | 1218 | 58 | 2908 | 600 | 63800 | 1000 | 287 | 368 | 33.3 | 30.2 | 1 | 0 |
| TDS | 861 | 1218 | 58 | 2908 | 600 | 63800 | 1000 | 71 | 72 | 8.3 | 5.9 | 1 | 0 |
| Fluoride | 768 | 1129 | 0.1 | 1.36 | 0.60 | 9.00 | 4 | 61 | 67 | 7.9 | 5.9 | 0.01 | 0 |
| Hardness | 920 | 1291 | 6.1 | 475 | 239 | 9000 | 400 | 256 | 325 | 27.8 | 25.2 | 0.1 | 0 |
| Iron | 691 | 937 | <0.005 | 2.91 | 0.40 | 25.60 | 0.3 | 410 | 508 | 59.3 | 54.2 | 0.005 | 3 |
| Lead | 63 | 69 | <0.001 | 0.006 | 0.003 | 0.040 | 0.015 | 6 | 7 | 9.5 | 10.1 | 0.001 | 21 |
| Magnesium | 916 | 1284 | 0.5 | 46.1 | 14.0 | 1090.0 | 150 | 69 | 70 | 7.5 | 5.5 | 0.1 | 0 |
| Manganese | 295 | 426 | <0.005 | 0.186 | 0.056 | 4.300 | 0.05 | 132 | 214 | 44.8 | 50.2 | 0.005 | 67 |
| Mercury | 88 | 110 | <0.0002 | 0.0004 | <0.0002 | 0.0056 | 0.002 | 6 | 6 | 6.8 | 5.5 | 0.0002 | 74 |
| Nitrate-N | 602 | 804 | 0.02 | 6.80 | 1.13 | 175.98 | 10 | 88 | 107 | 14.6 | 13.3 | 0.01 | 0 |
| Phosphorus | 108 | 191 | <0.01 | 0.565 | 0.06 | 3.261 | 5 | 0 | 0 | 0.0 | 0.0 | 0.01 | 20 |
| Potassium | 472 | 732 | 0.4 | 7.15 | 4.50 | 156.00 | 100 | 4 | 4 | 0.9 | 0.6 | 0.1 | 0 |
| Selenium | 138 | 165 | <0.001 | 0.003 | 0.001 | 0.042 | 0.05 | 0 | 0 | 0.0 | 0.0 | 0.001 | 80 |
| Silica | 538 | 890 | 2 | 18.9 | 16.0 | 61.9 | 50 | 3 | 3 | 0.6 | 0.3 | 0.1 | 0 |
| Silver | 104 | 106 | <0.001 | 0.002 | 0.002 | 0.010 | 0.05 | 0 | 0 | 0.0 | 0.0 | 0.001 | 46 |
| Sodium | 905 | 1273 | 3.2 | 808 | 74 | 22000 | 100 | 426 | 564 | 47.1 | 44.3 | 0.1 | 0 |
| Sulfate | 893 | 1256 | <1 | 329 | 99 | 6200 | 250 | 268 | 268 | 30.0 | 21.3 | 1 | 1 |
| Zinc | 127 | 145 | <0.005 | 0.143 | 0.021 | 2.000 | 5 | 0 | 0 | 0.0 | 0.0 | 0.005 | 29 |
Table 9 reflects the recent changes in the maximum contaminant levels for several heavy metals. The standard for selenium was increased from 0.01 mg/l to 0.05 mg/l, resulting in former exceedances of several percent being reduced to zero. The standard for chromium was increased from 0.05 mg/l to 0.1 mg/l; no exceedances existed before and thus no exceedances occur under the revised standard. The maximum contaminant level for cadmium decreased from 0.01 mg/l to 0.005 mg/l; the result changed the assessment from zero exceedance to a few percent exceedances for the samples collected. The standard for lead changed from the maximum contaminant level to a performance standard in the water system; that is, the lead should not exceed the criterion listed after water treatment. Although this lead level relates to the water in a distribution system as delivered to consumers, the level is used in Table 9 as the criterion because, if exceeded, it either represents a level that must be treated in a public water supply or is a concentration above which rural water users may wish to consider some form of treatment. The exceedances for lead went from zero for the former standard to about 10% for the new level. Most of the waters exceeding the lead performance level are from rural wells that could possibly be obtaining lead from the metals in the well and piping system before the sampling point. The new fluoride standard was already incorporated into table 9 in the FY91 annual report (Macfarlane et al., 1992).