Kansas Geological Survey, Open-File Rept. 93-1
Annual Report, FY92--Page 15 of 20
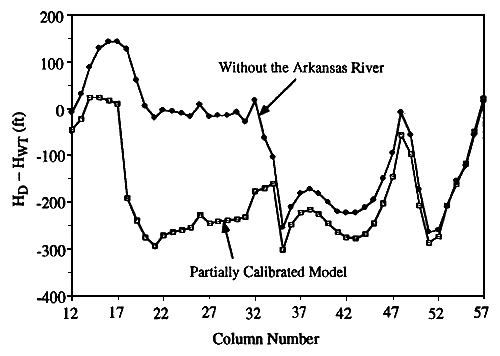
The modifications made to the model grid produce major changes in the head distribution and in the cell-by-cell volumetric flow rate across the upper model boundary in the vicinity and downgradient of column 17 (Figure 39). Heads increase in the upper Dakota aquifer by as much as 200-300 ft (60-90 m) in the vicinity and downgradient of this location and only a small amount of water [0.04 cubic ft/day (0.001 cubic m/day)] is discharged across the upper model boundary. Downgradient from this region to column 32 of the model, heads in the upper Dakota aquifer are approximately equal to the elevation of the water table. However, beyond this point the head difference increases quickly with distance and significant subhydrostatic conditions are present in the upper Dakota aquifer eastward to the Saline River. The rapid increase in the head difference may result because of the increase in the depth to the lower no-flow boundary near the axis of the Scott basin and beginning in column 32. This increases the cross-sectional area of the model and effectively lowers the rate of underflow per unit area through the model and causes a reduction in the head in the Dakota aquifer. Downgradient from the discharge near column 17, recharge to the model is essentially unchanged. Without the river there is a net decrease in the total volumetric flow rate through the model of 24%, which appears to reflect the loss of the Arkansas River valley as a major discharge zone.
Figure 39--Head difference between the upper Dakota aquifer (Hd) and the overlying water table (Hwt) when the Arkansas River is removed from the simulation. The head difference in the partially calibrated model is shown for comparison.

Removal of the Arkansas River in this simulation appears to reconnect the upper Dakota in the western Kansas plains with its elevated recharge area south of the river. Thus it appears that the valley helps to maintain subhydrostatic conditions by short-circuiting some of the underflow back to the surface that otherwise would continue in the flow system. Without the river, heads in the upper Dakota aquifer are at or above land surface near column 17 and for a considerable distance downgradient. This demonstrates that the valley is an important hydrologic feature whose influence is more than local.
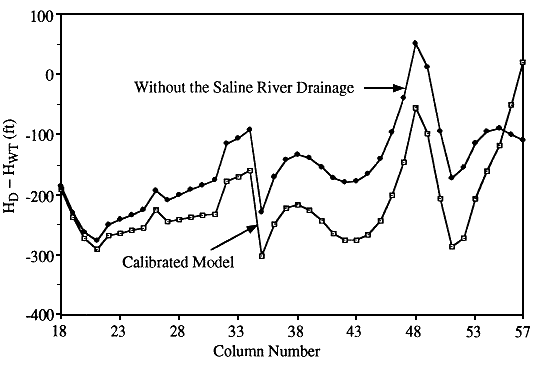
Removal of the Saline River and its tributary streams from the model produces smaller but more widespread and significant changes in head in the model (Figure 40). The increase in head in the upper Dakota ranges from 1 ft (0.3 m) beneath the Arkansas River to slightly more than 100 ft (30 m) in west-central and central Kansas. The discharge across the upper model boundary in the central Kansas dissected plains disappears and becomes recharge to the model. Elsewhere, both the pattern and the amount of recharge and discharge are essentially unchanged, except for Big Creek which discharges a negligible amount of water [0.002 cubic ft/day 6 x 10⁻⁵ cubic m/day). The total water budget for the model decreases by 18%.
Figure 40--Difference in head between the upper Dakota aquifer (Hd) and the overlying water table (Hwt) when the Saline River drainage is removed from the model. The head difference in the partially calibrated model is shown for comparison.

The head increase associated with removing the Saline River and its tributaries can be explained by using a simple model proposed by Belitz (1985). Belitz related the head in a confined aquifer to the hydraulic properties of the system, the head on the overlying water table and in the discharge area, and the geometry of the flow path from the water table to the discharge area (Figure 41):
(KC/KA) (L/D) = (HB - HD)/(HR - HB), (3)
where KA and KC are the horizontal and vertical hydraulic conductivities
of the aquifer and aquitard, respectively, L is the distance from a point in
the confined aquifer to the discharge area, D is the aquitard thickness, and
HB, HD, and HR are the head in the confined aquifer at any point, the head
in the discharge area, and the head on the overlying water table, respectively.
Figure 41--Combined effect of hydraulic conductivity, flow path geometry, and head on the water table and in the discharge area on the head in the confined aquifer at steady state. Modified from Belitz (1985).

Removal of the Saline River drainage from the steady-state model moves
the discharge point beyond the northeast end of the model and increases
the distance L. Because the heads in the overlying water table and in the
discharge area remain fixed, the increase in the distance to the discharge
area must cause an increase in the head in the upper Dakota. In essence,
the hydraulic connection between the aquifer and the overlying water table
improves when the discharge area is moved farther away. In central Kansas
the Saline and Smoky Hill rivers have cut valleys through this aquitard to
the west of the main discharge area of the Dakota aquifer. These valleys
have effectively reduced the lateral distance between the discharge area and
the confined Dakota aquifer in western Kansas and thus have helped generate
subhydrostatic conditions in the upper Dakota aquifer. This effect is suggested
by the slight bending of the 1,500-ft and 1,750-ft potentiometric contours
near where the Saline and Smoky Hill rivers have cut through the Upper
Cretaceous aquitard in Ellis and Russell counties, Kansas (see Figure 19).
Conclusions
The hypothesis that is advanced here is that the upper part of the regional
flow system, including the Dakota aquifer, is influenced primarily by the
Upper Cretaceous aquitard, the Arkansas River in southeastern Colorado,
and the Saline River drainage in central Kansas. The Upper Cretaceous
aquitard is believed to allow significant recharge to the Dakota aquifer from
the overlying water table in southeastern Colorado and in central Kansas
where it is much thinner or absent. The Arkansas River is located just
downgradient from the main recharge area in southeastern Colorado and is
believed to be a major discharge point from the western part of the flow
system. The river influences the downgradient flow system by removing
underflow that otherwise would continue into western Kansas.
Consequently, the flow system beneath the Upper Cretaceous aquitard in
western Kansas is isolated from its recharge area south of the river and from
the overlying water table. The Saline River has eroded through the Upper
Cretaceous aquitard to the west of the main outcrop area of the Dakota
Formation in central Kansas and has effectively reduced the distance between
the deeper, more confined parts of the Dakota aquifer and the discharge area.
This has resulted in a further reduction of head in the Dakota aquifer upgradient
from the discharge area. The Smoky Hill River in central Kansas may also
influence the upgradient flow system in a similar way.
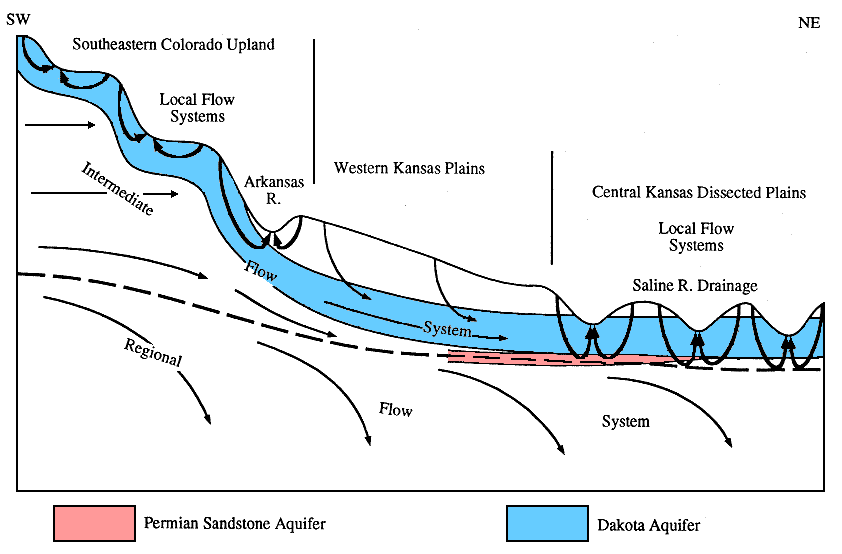
A steady-state numerical simulation of a portion of the intermediate-scale flow system in vertical profile view was developed to investigate the influence of these factors. The model results reveal significant development of local flow systems in the southeastern Colorado upland and the central Kansas dissected plains model sections (Figure 42). Local flow systems dominate in the central Kansas dissected plains section to the exclusion of the intermediate-scale flow system because of the high local relief associated with deeply incised river valleys. With the exception of the Arkansas River valley, local flow systems in the southeastern Colorado upland are not as well developed because of the high regional topographic slope but moderate local relief. The steady-state volumetric flux through the vertical profile is approximately 16.6 ft3/day (0.5 m3/day). Most of the recharge to the flow system is discharged to surface water locally in the southeastern Colorado upland and the central Kansas dissected plains sections. Ten percent of the total water budget moves beyond the Arkansas River and into the western Kansas plains. In this part of the model the amount of water moving into the intermediate-scale flow system through the Upper Cretaceous aquitard is 0.9% of the total volumetric flow rate.
Figure 42--Conceptual model of ground-water flow in the vertical profile that extends from southeastern Colorado into western and central Kansas. In the southeastern Colorado upland the flow system is dominated by local flow systems and the intermediate-scale flow system. Beneath the western Kansas plains the intermediate-scale flow system dominates the flow of ground water northeastward from the southeastern Colorado upland. In the central Kansas dissected plains subregion local flow systems completely dominate ground-water flow and the intermediate-scale system is not present.

The sensitivity analysis demonstrates that the Arkansas River and the Saline River and its tributary streams in concert with the Upper Cretaceous aquitard heavily influence the flow system beneath the western Kansas plains. Of all the hydrostratigraphic units, the model was most sensitive to increases in the vertical hydraulic conductivity of the Upper Cretaceous aquitard. The lowest RMS error resulted when the vertical hydraulic conductivity of the aquitard was treated as a nonuniform parameter. Large changes in the total volumetric flow rate, the distribution of recharge and discharge, and the head differences between the upper Dakota aquifer and the overlying water table caused by changes in layer vertical hydraulic conductivity indicate that the Upper Cretaceous aquitard restricts recharge to lower aquifer units and is a major factor that contributes to subhydrostatic conditions in the Dakota and underlying aquifers. Simulated removal of the Arkansas River increased heads in the upper Dakota aquifer by as much as 300 ft (90 m). In central Kansas simulated removal of the Saline River drainage increased heads in the upper Dakota aquifer by more than 100 ft (30 m) in parts of the western Kansas plains and the central Kansas dissected plains sections.
These results stress the importance of local flow systems in southeastern Colorado and central Kansas, a point not recognized in the simple artesian aquifer hypothesis applied by Darton (1905) to the Dakota aquifer. Darton was partially correct in recognizing that the steady-state flow system in the Dakota is topographically driven. From this he concluded that the high heads in the flowing wells in the Arkansas River valley resulted from elevated recharge areas south of the river. However, he did not recognize that the Arkansas River valley influences the downgradient flow system by removing underflow. Darton also believed that the Upper Cretaceous aquitard helped to maintain the head difference between the recharge area in southeastern Colorado and the discharge area in central Kansas, although he recognized that leakage through the aquitard could occur. The sensitivity analysis shows that, on the contrary, the Upper Cretaceous aquitard, in concert with the Arkansas and Saline rivers, fosters subhydrostatic conditions in the aquifers below the aquitard in western Kansas by hydraulically isolating them from sources of freshwater recharge. Darton viewed the Dakota aquifer as a uniformly dynamic system. He envisaged recharge entering the flow system in southeastern Colorado and moving northeastward toward central Kansas and returning to the surface in springs and rivers. The steady-state model shows that the flow system is dynamic only in southeastern Colorado and central Kansas with relatively high volumetric flow rates because of the local flow systems that have developed. Most of the water that enters the flow system in these areas is discharged locally, and little moves from southeastern Colorado to central Kansas.
The modeling results have implications for the assessment of the suitability of disposing wastes, primarily oil brines, into the Cedar Hills Sandstone and the future development of water resources in the upper Dakota aquifer in west-central and central Kansas. The Cedar Hills Sandstone is more suitable as a disposal zone where the Permian-Pennsylvanian aquitard is present. Flow rates in this zone suggest that it is relatively isolated from the rest of the flow system and that the brines will not migrate far from their point of injection. In central Kansas the flow system is much more dynamic, and the flow in the Cedar Hills Sandstone is highly variable and not isolated from the rest of the flow system. Thus the potential for contamination of shallow ground water is much higher in central Kansas than in areas to the west. In the area of water supply the primary factors determining the success of long-term use of the upper Dakota aquifer in western and central Kansas are the sources and rates of recharge to the aquifer. In west-central Kansas, the major source of recharge is the underflow from upgradient sources, which averages 1.6 cubic ft/day (0.05 cubic m/day) for each model cell. This, coupled with the low aquifer transmissivities, indicates that well fields should be designed using many low-capacity wells and large well spacing to capture the underflow and to minimize overdrafting. In central Kansas the major sources of recharge are more local but involve both freshwater and saltwater sources. Thus an additional concern is upconing of high-TDS-concentration saline ground water from the deeper aquifers during pumping.