Kansas Geological Survey, Open-File Rept. 93-1
Annual Report, FY92--Page 12 of 20
The governing equation that describes the flow of ground water in a vertical profile parallel to the flow direction is (Anderson and Woessner, 1992)
where R is a source/sink term and Kx and Kz are the x and z components of hydraulic conductivity. Equation (1) describes ground-water flow through a heterogeneous and anisotropic porous medium where the principal axes of hydraulic conductivity are aligned with the orthogonal x and z coordinate system axes. Sources of recharge to and discharge from the model are not indicated explicitly because they are handled separately as part of the boundary conditions, which are discussed later.
MODFLOW (McDonald and Harbaugh, 1988) was used to solve the two-dimensional flow equation along with its attendant boundary and initial conditions in the vertical profile. MODFLOW is a block-centered finite-difference code that can be used to simulate ground- water flow in two or three dimensions. The model has a modular structure and consists of a main program and a series of subroutines referred to as modules. These subroutines are grouped into packages that deal with specific features of the hydrologic system to be simulated or with a numerical technique to solve the finite-difference formulation of the flow equation. MODFLOW was selected for this application because it can be readily adapted to a vertical profile model (Anderson and Woessner, 1992).
In the vertical profile view of the regional ground-water flow system, the equipotentials near the Freezeout Creek fault zone in southeastern Colorado were drawn based on head values calculated from drill-stem tests (Figure 29). Subsequently, the equipotentials were used to locate the boundary between the intermediate-scale and regional flow systems. The flow pattern implied by the observed head distribution suggests that this boundary, a flow line, crosses the Dakota aquifer and intersects the water table near the underlying fault zone. This implies that all the flow in the Dakota and the other shallow aquifers upgradient from the fault zone moves downward to recharge the deeper part of the regional flow system. This interpretation, although plausible, seems unlikely because it suggests that all the recharge that enters the upper part of the flow system in eastern Las Animas County, Colorado, where the Dakota potentiometric surface is highest and upgradient of the fault zone, moves downward to recharge the regional flow system. A more likely explanation is that the deeper part of this segment of the regional flow system is recharged by underflow from upgradient sources and by some leakage from overlying aquifers. In this interpretation the flow direction in the shallow aquifers is laterally downgradient from the potentiometric high near the crest of the Sierra Grande uplift rather than primarily cross-formational upgradient from the fault zone. This indicates that the equipotentials are located incorrectly because the heads calculated from the drill-stem test results are too low. Hence the location and the nature of the boundary between the intermediate-scale and regional flow systems are uncertain because of a lack of reliable data. To help minimize this uncertainty, we constructed a simplified model of the regional flow system to determine the likely head distribution in the vicinity of the fault. The model construction, the parameters used in the simulation, and the model results are described by Macfarlane (1993). From the model results the lower and upgradient boundaries were modified in the vertical profile model grid, which was used in the computer simulation of the intermediate-scale flow system.
The model grid consists of 8 layers, 1 row, and 73 columns (Figure 30). The row has a unit length of 1 ft (0.3 m) and the length of each cell in the column direction varies from 5,709 ft (1,740 m) to 28,546 ft (8,700.8 m). The length in the column direction is variable to more accurately simulate the upper water table boundary in the vicinity of the river valleys. The total length of the vertical profile from southeastern Colorado to central Kansas is 315.7 mi (508.1 km).
Figure 30--Vertical profile model grid, which consists of 8 layers, 1 row, and 73 columns. The length of each cell in the column direction is variable and ranges from 5,709 ft to 28,546 ft. The length of each cell in the row direction is 1 ft.
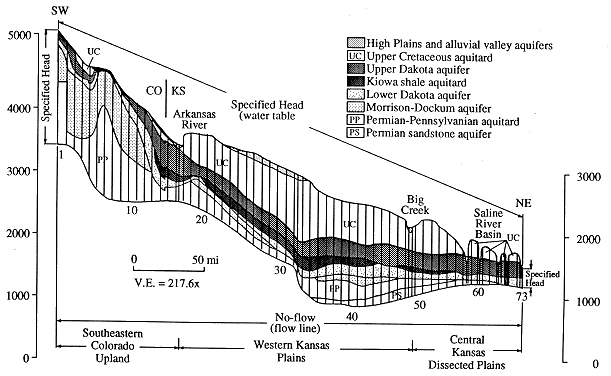
Each of the model layers represents a hydrostratigraphic unit. Layer 1 is the High Plains and alluvial valley aquifers and is treated as the upper, unconfined aquifer by MODFLOW. Layers 2 and 3 are the Upper Cretaceous aquitard and the upper Dakota aquifer, respectively. These layers are treated by MODFLOW as fully convertible layers between confined and unconfined conditions with negligible loss of transmissivity. Layer 4 is the Kiowa shale aquitard; layer 5 is the lower Dakota aquifer; layer 6 is the Morrison-Dockum aquifer; layer 7 is the Permian-Pennsylvanian aquitard; and layer 8 is the Permian sandstone aquifer. Layers 4 through 8 are all treated as confined layers by MODFLOW. The terms confined and unconfined do not necessarily denote aquifer units in the model and, with the exception of layer 1, indicate only whether a particular layer is uppermost at some point in the model.
All the major geologic and geomorphic features traversed by the vertical profile along its length were simulated, including the Sierra Grande and Las Animas uplifts, Two Buttes dome, the Arkansas River, the Saline River drainage, and Big Creek. The Bear Creek fault was not simulated in the vertical profile because its influence on the flow system is uncertain and is probably only local.
The model grid was subdivided into three major sections on the basis of relative local and regional topographic relief in vertical profile view (Figure 30). The southeastern Colorado upland extends from the southwestern end of the model to the Arkansas River in column 17. In this part of the model the regional topographic slope is steep and the local topographic relief is moderate. The western Kansas plains part of the model extends from column 18 to the north bank of Big Creek in column 50. In this section, the regional topographic slope is moderate and the local topographic relief is low. The central Kansas dissected plains section extends from column 51 to the northeast end of the model in column 73. In this part the regional topographic slope is low and the local topographic relief is high.
The model grid and the input parameters were designed to reflect changes in the hydrostratigraphy in the vertical profile caused by the pinching out of model layers. This happens to several of the layers in the model (Figure 30). The pinchout of layers is taken into account where it occurs by continuing the layer across the model as a phantom with a transmissivity and a layer thickness of zero. Vertical hydraulic continuity is maintained where the layer is not present by assigning the same vertical conductance to the cells in the phantom layer that is assigned to cells in the overlying layer. The vertical conductance of each cell in the overlying layer was calculated by assuming that the real layer above and the real layer below the phantom layer are in physical contact.
The boundary conditions define the hydraulic conditions on the perimeter of the model and are necessary to produce a unique solution to the flow equation (Anderson and Woessner, 1992). In the vertical profile model specified-head and no-flow boundary conditions were imposed on the perimeter.
The upper model boundary represents the water table and is considered a specified- head boundary (see Figure 16). At this boundary temporal fluctuations in head are small relative to the total head difference on the water table across the model [3,560 ft (1,085 m)] and the maximum vertical extent of the model [up to 1,700 ft (518 m)]. The specified-head boundary condition was applied instead of a flux boundary to minimize the number of parameters that needed adjusting during calibration. The specified-head condition also allows a flux of water (recharge or discharge) to cross the water table during model execution to maintain the constant head. The distribution of recharge and discharge across the upper model boundary is an output from the model.
Specified-head boundary conditions were also applied at two sites where there are time-invariant vertical hydraulic head gradients that are not significant relative to the scale of the regional model. The southwestern boundary corresponds to the 5,000 ft (1,524 m) equipotential (Figure 30). Placement of this boundary was guided by the results of modeling experiments discussed by Macfarlane (1993). The northeastern boundary corresponds to an assumed, vertical head difference of 0.5 ft (0.15 m) between the upper and lower Dakota aquifers at the northeastern end of the model in Lincoln County, Kansas.
A no-flow boundary was used along the bottom of the model to simulate the flow line that approximates the boundary separating the upper, intermediate flow system from the lower regional flow system (Figure 30). This flow line was drawn on the basis of modeling results described by Macfarlane (1993).
The horizontal hydraulic conductivity of the High Plains aquifer was assumed to be 80 ft/day (24 m/day), which is the arithmetic mean calculated by Stullken et al. (1985) for the aquifer in southwestern and west-central Kansas (Table 4). Warren and Price (1961) suggest that the arithmetic mean hydraulic conductivity is more appropriate in instances where the hydrostratigraphic unit is horizontally continuous. Anisotropy and extreme heterogeneity are expected to be more significant in the bedrock units than in the shallow unconsolidated sediments in the High Plains aquifer. The horizontal hydraulic conductivity of the alluvial aquifers was assumed to be 250 ft/day (76 m/day). This assumed value is lower than most of the values cited by Macfarlane et al. (1992) because it is believed that values greater than 250 ft/day are probably not representative of these aquifers.
The horizontal hydraulic conductivity of the upper Dakota aquifer was assumed to vary from 4 ft/day (1.2 m/day) in southeastern Colorado to 10 ft/day (3 m/day) in central Kansas. In southeastern Colorado pumping-test values of horizontal hydraulic conductivity in the upper Dakota range from less than 1 to 10 ft/day (0.3-3 m/day) (McLaughlin, 1954; Wilson, 1965). Near Hays, in central Kansas, horizontal hydraulic conductivities calculated from pumping tests in the upper Dakota aquifer range from 8 to 10 ft/day (2.4-3 m/day) (Robert Vincent, personal communication, 1992).
Table 4--Input hydraulic conductivity data for the hydrostratigraphic units in the vertical profile.
| Hydrostratigraphic Unit | Horizontal Hydraulic Conductivity (ft/day) |
Vertical Hydraulic Conductivity (ft/day) |
|---|---|---|
| High Plains aquifer | 80 | 8.0 |
| Alluvial valley aquifers | 250 | 25 |
| Upper Cretaceous aquitard | 9.0 x 10⁻⁷ | 9.0 x 10⁻⁸ |
| Upper Dakota aquifer | 4 - 10 | 3.1 x 10⁻³ |
| Kiowa shale aquitard | 1.3 x 10⁻⁵ | 1.3 x 10⁻⁶ |
| Lower Dakota aquifer | 2.3 - 2.0 | 3.1 x 10⁻³ |
| Morrison-Dockum aquifer | 0.15 - 0.5 | 0.015 - 0.05 |
| Permian-Pennsylvanian aquitard | 2.7 x 10⁻³ - 2.7 x 10⁻⁵ | 2.7 x 10⁻⁴ - 2.7 x 10⁻⁶ |
| Permian sandstone aquifer | 1.6 | 0.16 |
The horizontal hydraulic conductivity of the lower Dakota aquifer was assumed to decrease from 2.3 ft/day (0.70 m/day) in southeastern Colorado to 2.0 ft/day (0.61 m/day) in west-central and central Kansas. The arithmetic average value of the horizontal hydraulic conductivities computed from two pumping tests of the lower Dakota in southeastern Colorado is 2.3 ft/day (0.70 m/day) (McLaughlin, 1954). Merriam et al. (1959) reported horizontal hydraulic conductivities of the order of 2.0 ft/day (0.61 m/day) for core samples of sandstone from the lower Dakota aquifer in a test hole drilled in northwest Kansas.
The horizontal hydraulic conductivities of the Morrison-Dockum aquifer are based on values of transmissivity used in steady-state models of the regional flow system in the Denver basin reported by Belitz (1985) and Belitz and Bredehoeft (1988). In this part of Kansas Doveton and Chang (1991) reported that the Morrison formation consists of more than 50% sandstone, a much higher percentage than that used to calculate bulk hydraulic conductivity by Belitz (1985) and Belitz and Bredehoeft (1988). The horizontal hydraulic conductivity of the Morrison-Dockum aquifer in southeastern Colorado is assumed to range from 0.15 ft/day (0.045 m/day) in southeastern Colorado to 0.5 ft/day (0.15 m/day) in west-central Kansas.
The horizontal hydraulic conductivity of the Permian sandstone aquifer in the vertical profile is assumed to be higher than the geometric mean value of 0.6 ft/day (0.18 m/day), derived from the slug tests in south-central Kansas. In west-central and central Kansas the lithology of the aquifer is less silty and is assumed to be more permeable (Macfarlane et al., 1990). Accordingly, the initial value of horizontal hydraulic conductivity used in the model was arbitrarily set at 1.6 ft/day (0.49 m/day).
Data from field and laboratory studies on the vertical hydraulic conductivity of the upper and lower Dakota aquifers are few. The geometric mean vertical hydraulic conductivity from the core permeameter tests of sandstone samples is 2.89 ft/day (0.88 m/day). Wade (1991) reported a vertical hydraulic conductivity of 2.2 (± 0.6) x 10-3 ft/day (6.7 x 10⁻⁴ m/day) for the mudstone portion of the Dakota aquifer from a pumping test in Washington County, Kansas. Assuming that the average percentage of sandstone in the upper and lower Dakota aquifers is approximately 30% in western and central Kansas (Keene and Bayne, 1977), the equivalent vertical hydraulic conductivity of the upper and lower Dakota is approximately 3.1 x 10⁻³ ft/day (9.4 x 10⁻⁴ m/day). The vertical hydraulic conductivities of the other aquifer units are assumed to be one-tenth of their horizontal hydraulic conductivity to take into account the effects of stratification (Domenico and Schwartz, 1990).
The vertical hydraulic conductivity of the Permian-Pennsylvanian aquitard was taken directly from core data and was assumed to be 2.7 x 10⁻⁴ ft/day (8.2 x 10⁻⁵ m/day) in southeastern Colorado and southwestern Kansas and 2.7 x 10⁻⁶ ft/day (8.2 x 10⁻⁷ m/day) eastward of the Scott basin axis. The decrease in vertical hydraulic conductivity reflects the eastward decrease in sandstone content of the aquitard. Values of vertical hydraulic conductivity for layer 4 (the Kiowa shale aquitard) and layer 2 (the Upper Cretaceous aquitard) were derived from modeling studies. The value of vertical hydraulic conductivity for the Kiowa shale aquitard that was input into the model is 1.3 x 10⁻⁶ ft/day (4.0 x 10⁻⁷ m/day). This value was derived from other modeling studies reported by Bredehoeft et al. (1983) and was later used in a modeling study of the Dakota aquifer in southwestern Kansas (Watts, 1989). The initial value of vertical hydraulic conductivity for the Upper Cretaceous aquitard that was input into the model was 9.0 x 10⁻⁸ ft/day (2.7 x 10⁻⁹ m/day) and was derived from a modeling study of the Denver basin reported by Belitz (1985) and Belitz and Bredehoeft (1988). The horizontal hydraulic conductivity for all the aquitards was assumed to be 10 times the value of the vertical hydraulic conductivity, which is consistent with anisotropy ratios given by Domenico and Schwartz (1990).
Calibration of ground-water flow models usually consists of adjusting the input parameters until a satisfactory match is achieved between the observed and the simulated hydraulic heads, fluxes, or other calibration targets (Wang and Anderson, 1982). In this research a fully calibrated model of the flow system was deemed inappropriate because of the lack of head data for many of the layers below the upper Dakota aquifer. Model calibration was carried out manually by trial-and-error adjustment of the hydraulic conductivity input data to match hydraulic head measurements and flow rates in the model. Because most of the head data were primarily from the High Plains, alluvial valley, and upper Dakota aquifers, little adjustment was made in the hydraulic parameters of layers below the upper Dakota aquifer. All the adjustments made in the values of these parameters were guided by the sensitivity analyses. Fourteen target head values were available in the upper and lower Dakota aquifers to check the progress of calibration. The location of the target heads is shown in Figure 29. Calibration of the vertical profile model was also guided by the results of pumping tests of nearby wells in central Kansas and in southeastern Colorado and measurements of baseflow in the Saline River in central Kansas from seepage runs.
The results of each round of calibration were evaluated by computing the root mean square (RMS) error:

where hm and hs are the measured and simulated heads, respectively. This criterion was chosen because the RMS error is thought to be the best measure of uncertainty if the errors are normally distributed (Anderson and Woessner, 1992). The RMS error was also used to evaluate model sensitivity to systematic changes in layer hydraulic conductivity and boundary conditions.
As a further check of the calibration, the errors were examined for trend by producing a plot of the errors and the calibration target heads and computing a best-fitting regression line by least squares through the data points. No trend is indicated in the errors if the slope of the best-fitting line is judged to be not significantly different from zero.
The steady-state model was considered to be partially calibrated when the RMS error was less than 50 ft (15 m), which is 1.4% of the total head decline [3,560 ft (1,085 m)] across the model. This value of the RMS error is also within the error of many of the calibration target heads. The RMS error of the partially calibrated model is 46 ft (14 m). The slope of the best-fitting line was -0.016 and was found to be not significantly different from zero.
Assumptions and Limitations of the Model
The assumptions made in developing the vertical profile model were (1) the ground- water flow system contains fluids of uniform density and viscosity (homogeneous fluids), (2) the heterogeneity of the geologic framework can be reasonably simulated using a three- dimensional orthogonal grid, and (3) there is no flow into or out of the plane of the vertical profile.
MODFLOW is not designed to simulate variable-density ground-water flow caused by thermal effects or total dissolved solids (TDS) concentration. Stavnes and Steeples (1982) and Repplier and Fargo (1981) in Kansas and Colorado, respectively, indicate no significant thermal anomalies in the area traversed by the vertical profile. The geothermal gradient ranges from slightly less than 1.97 degrees F/100 ft to 2.24 degrees F/100 ft in the study area. Overall, the TDS concentration of ground water in the vertical profile ranges up to 30,000 mg/l. Ground water containing elevated TDS concentrations is restricted to the lower part of the profile in the Permian sandstone aquifer and in the lower Dakota aquifer in west-central and central Kansas and to beneath the Saline River valley. The narrow range in the geothermal gradient and ground-water TDS concentrations in the vertical profile indicates that ground-water density and viscosity should not vary appreciably.
MODFLOW is also limited in its ability to simulate complex geometries because of its finite-difference formulation. McDonald and Harbaugh (1988) note that the method of handling the vertical grid spacing may introduce small errors into the calculation of hydraulic heads. The model is also limited in its ability to simulate ground-water flow where the hydrostratigraphic units are tilted because of the model's reliance on an orthogonal grid. This limitation is not considered serious because the hydrostratigraphic units are relatively flat-lying across most of the vertical profile except in the vicinity of Two Buttes dome, where the maximum dip on the beds is less than 10° from the horizontal (Sanders, 1934). In areas where there is significant topographic relief, a finer grid spacing was used to minimize this problem.
The trace of the vertical profile is parallel to the flow directions indicated by the Dakota aquifer potentiometric surface. In west-central Kansas the general flow directions in the Permian sandstone aquifer are assumed to be toward its subcropping boundary in central Kansas. However, a significant flow component is recorded to the northwest and may include the west-central Kansas portion of the aquifer. These flows into and out of the plane of the vertical profile violate the assumptions of the analysis but are not significant, considering the other uncertainties in the model.