Kansas Geological Survey, Open-File Rept. 93-1
Annual Report, FY92--Page 3 of 20
All the regional geologic mapping efforts were focused on southwestern Kansas south of T. 14 S. and west of R. 10 W. The data used in the mapping are formation tops picked from API-calibrated, gamma-ray logs of oil and gas production and exploration boreholes. Eight-hundred ten logs were selected for subsurface mapping in southwestern Kansas. Over much of the eastern part of the region, in the vicinity of the Central Kansas uplift and the Pratt anticline, the data density is approximately four logs per township, except in a nine-township area of Hodgeman County. In this smaller area 317 logs were selected. To the west of the Central Kansas uplift and the Pratt anticline and near the Hugoton embayment, the log density declines to less than one log per township for many of the formation tops. To the north of this sparsely populated region the log density approaches one per township for all the stratigraphic horizons mapped.
Hand-contoured maps of the top of the following stratigraphic units were produced: Carlile Shale, Greenhorn Limestone, Graneros Shale, Dakota Formation, Kiowa Formation, Longford Member (Kiowa Formation) or Cheyenne Sandstone, Morrison formation, Permian System, Cedar Hills Sandstone, Salt Plains Formation, and Stone Corral Formation. Using the formation tops, thicknesses were computed and mapped for the following geologic units: Carlile Shale, Greenhorn Limestone, Graneros Shale, Dakota Formation, Kiowa Formation undifferentiated marine shale, Longford Member (Kiowa Formation) or Cheyenne Sandstone, Morrison formation and other undifferentiated Jurassic and Triassic deposits, Permian strata above the Cedar Hills Sandstone, the Cedar Hills Sandstone, Salt Plains Formation, and Harper Sandstone.
The hand-drawing of the isoelevation and isopach contours has been completed, and the contours and the points are in the process of being digitized into the ARC/INFO geographic information system, where they will be used to create coverages for map production. The finished maps will be assembled into a geologic atlas of southwestern Kansas, which should be ready for publication during the early part of FY94. The maps will also be used later in the flow modeling of the shallow part of the regional system to delineate regional hydrostratigraphic units, the aquifer, and aquitard units.
Work in the future will be directed toward using the digital gamma-ray data to generate sandstone/shale ratios in the stratigraphic units that constitute the upper and lower Dakota aquifer units across southwestern Kansas. The ratios will be contoured to produce isolith maps for each sequence-stratigraphic subdivision to identify the dominant sandstone-body trends in the Dakota and to map three-dimensionally the distribution of sandstone. This is an important first step in the process of defining the complicated plumbing system of interconnected sandstone bodies in the Dakota.
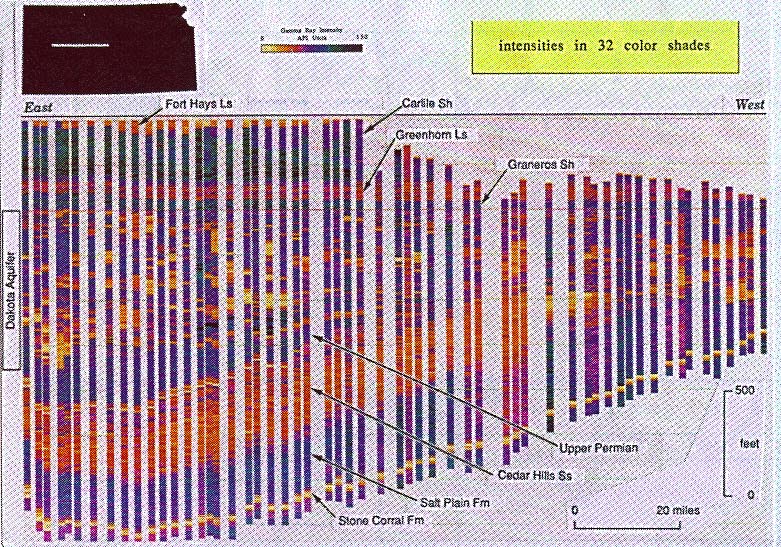
The provisional profile described and shown as Figure 18 in the annual report for FY91 (Macfarlane et al., 1992) has been revised and completed. The image was converted from gray-level representation as illustrated in the FY91 report to a colored image based on the application of color information theory to the log interpretation. The colored image (Figure 5) improves the visual conceptualization of the aquifer and aquitard units in the Dakota aquifer and the overlying and underlying rock units. The work was presented as a poster at the SEPM 1992 Theme Meeting in Fort Collins, Colorado, in August 1993 ["Regional gamma-ray gray-tone intensity images of the Permian-Cretaceous sequence of western Kansas" by D. R. Collins, J. H. Doveton, and P. A. Macfarlane (see list of Dakota program publications at end of this report)]. Interpretive work will be continued on both this and other regional cross sections for a variety of applications, ranging from improvements in the characterization of the regional geology to incorporation into the modeling phase of the Dakota program.
Figure 5--Reduced color image of gamma-ray log intensity of the Permian to Upper Cretaceous strata in western Kansas along T. 16 S. from R. 31 W. to R. 9 W.
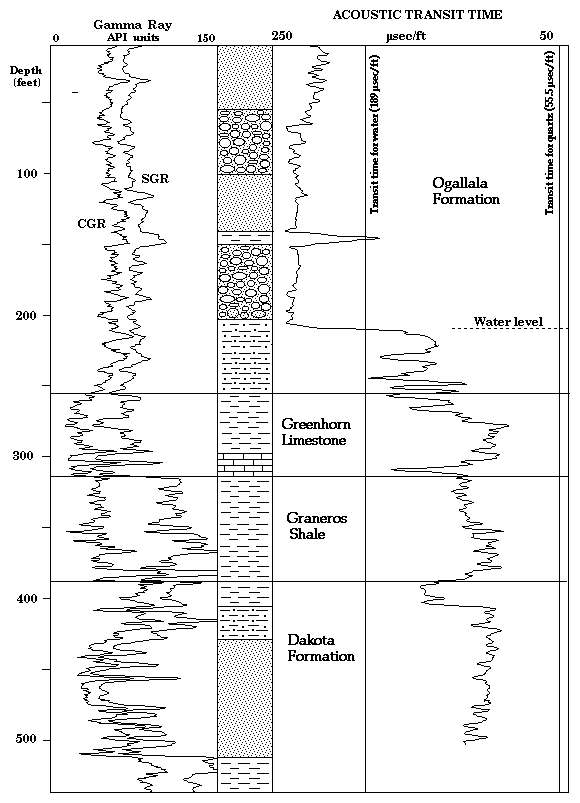
Spectral gamma-ray, lithodensity-neutron, acoustic velocity, and resistivity logs were run in the Gray County well drilled in March 1993 in sec. 26, T. 27 S., R. 28 W. The stratigraphy differs from other wells of the Dakota program series in that it has an interval of the Ogallala Formation above the Cretaceous section. A major point of interest in this logging run was whether the Ogallala can be distinguished from the Dakota sandstones on the basis of geophysical logs alone. If so, then what are the petrophysical properties that make this distinction possible? Some conclusions are discussed in this summary with reference to the resistivity (Figure 6), lithodensity-neutron (Figure 7), acoustic velocity (Figure 8), and spectral gamma-ray logs (Figure 9) from this well.
Figure 6--Resistivity logs from KGS Gray County Feed Yard 1, SENE sec 26, T. 27 S., R. 28 W., Gray County, Kansas.
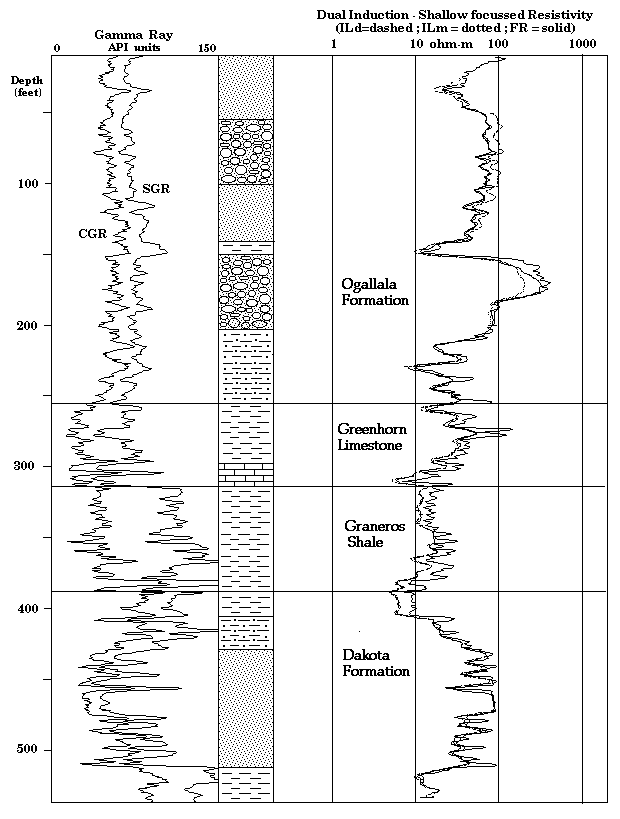
Some geophysical log comparisons between the Ogallala and the Dakota were easier than others because most of the Ogallala section was above the water level in the well. As a result, the pore space in the Ogallala sands and gravels was only partially saturated with water. The high air content of the pore space can be seen readily on several logs, particularly those from tools with relatively shallow depth of investigation beyond the borehole wall. The relatively high-density porosity and low neutron porosity readings in the Ogallala (Figure 7) would be recognized immediately by most petroleum geologists as a gas effect. In this instance the gas is not a hydrocarbon but natural air. However, the effect is the same because of the low density and low hydrogen content of air compared with water. The effect of the air phase is also evident in the acoustic velocity log. Above the water level there is a marked increase in transit time (Figure 8), because the speed of sound is much slower in gas than in aqueous media.
Figure 7--Lithodensity-neutron logs from KGS Gray County Feed Yard 1, SENE sec 26, T. 27 S., R. 28 W., Gray County, Kansas.
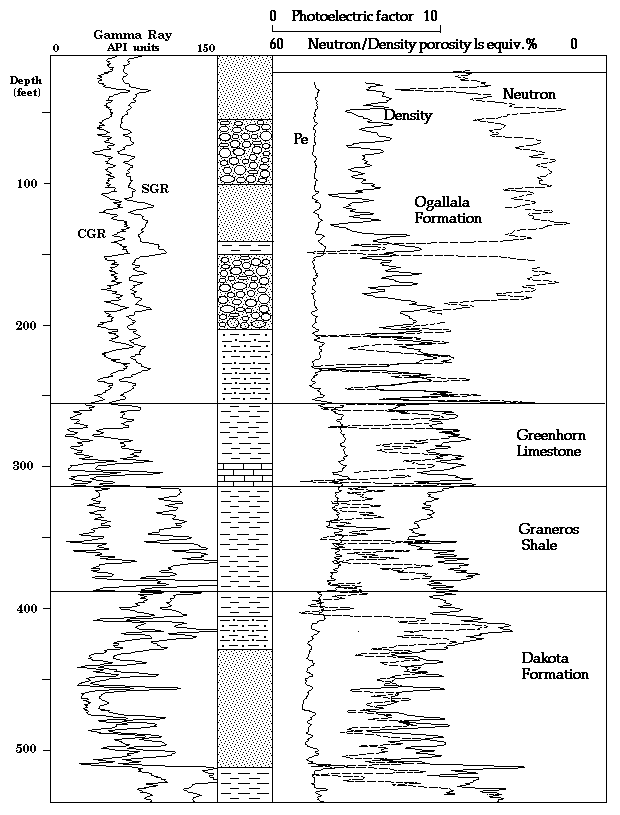
Figure 8--Acoustic velocity log from KGS Gray County Feed Yard 1, SENE sec 26, T. 27 S., R. 28 W., Gray County, Kansas.
The spectral gamma-ray logs (Figure 9) proved to be a valuable aid in the interpretation of rock types and units from drill cuttings. In particular, the feldspar content of the Ogallala gives a useful signature on the potassium curve of the spectral log, differentiating the Ogallala from the Dakota rocks. The discrimination is best made by the computation of a Th/K ratio log (Figure 10), so that the effects of potassium-feldspar (high potassium and moderate thorium) can be accentuated relative to those of illitic shales (high potassium and high thorium). Note that the distinction of the Ogallala from the Dakota in this well is quite clear-cut when using the Th/K ratio as a criterion.
Figure 9--Spectral gamma-ray logs from KGS Gray County Feed Yard 1, SENE sec 26, T. 27 S., R. 28 W., Gray County, Kansas.
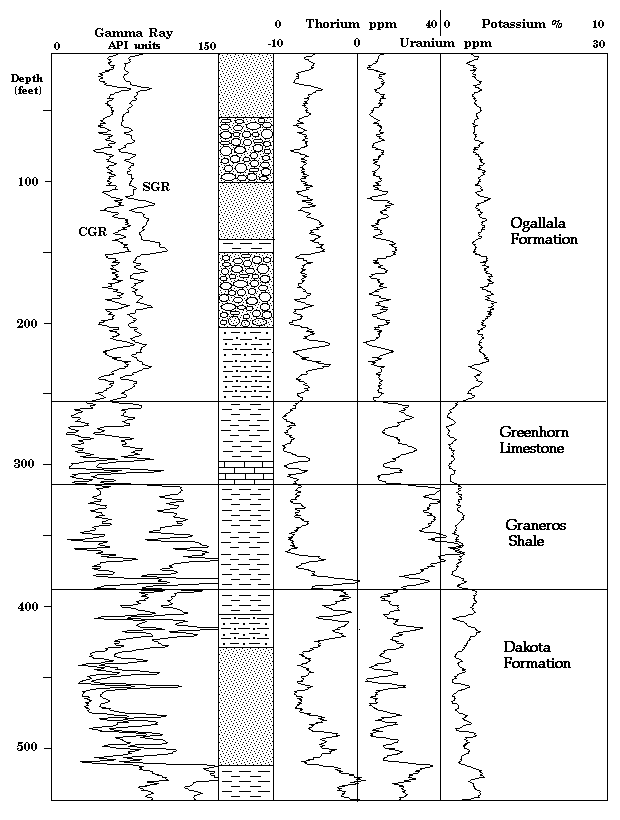
The Th/U ratio values of the Ogallala and the Dakota are similar (Figure 10), and their range indicates fairly neutral redox conditions in their formation. However, both units differ drastically from the intervening Graneros Shale and Greenhorn Limestone, where a consistently low Th/U ratio reflects enhanced uranium concentrations. The uranium was probably fixed by organic matter by the reducing conditions that prevailed during the marine deposition of these units.
Figure 10--Gamma-ray spectral ratio logs from KGS Gray County Feed Yard 1, SENE sec 26, T. 27 S., R. 28 W., Gray County, Kansas.
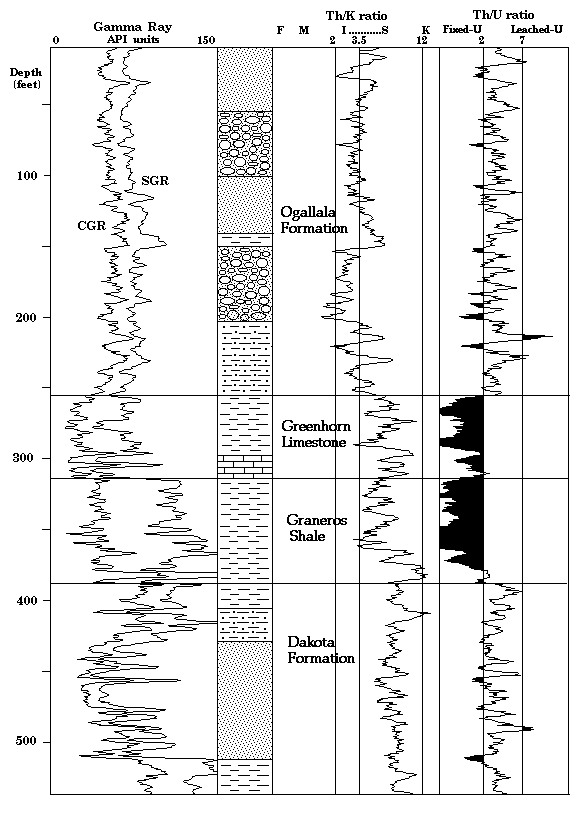
Collectively, the gamma-ray spectral ratio signatures are valid and useful measures for distinguishing the Ogallala and Dakota Formations and for recognizing the Graneros Shale and Greenhorn Limestone. The discrimination criteria are also likely to be of regional rather than localized significance. The Miocene Ogallala Formation represents clastic deposits derived from the uplift of the Rocky Mountains to the west, with feldspar supplied from fresh granitic material. These sediments contrast with the more mature clastics of the Dakota Formation, which originated from more distant sources to the east. The relative increase of uranium concentration in the Graneros Shale is well known across Kansas and is a typical phenomenon in regional marine shales of this type, where the seafloor was under reducing conditions. Enhanced uranium contents are less common and much more localized in the fluvial and deltaic deposits of the Dakota and Ogallala Formations, where neutral or mildly oxidizing conditions appear to have been the rule in either the original deposition or subsequent diagenesis.
Spectral gamma-ray logs are more expensive to run than conventional gamma-ray logs. However, their use can be justified on occasions where the aquifer stratigraphy is poorly understood and where distinctions between the Ogallala and Dakota Formations are needed. Alternatively, they could be run as reference logs (i.e., as a stratigraphic standard) at selected locations for the correlation of conventional gamma-ray logs run in wells in the surrounding area.
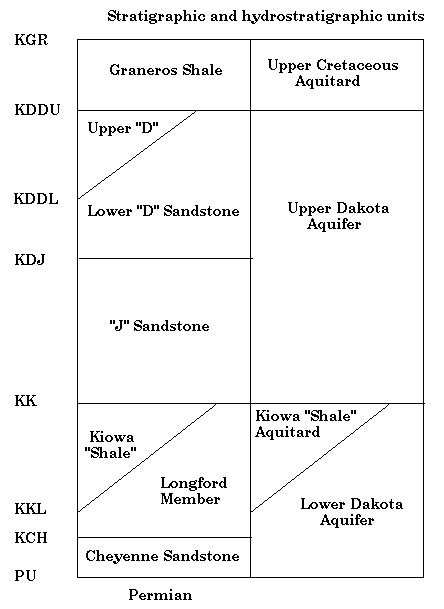
Approximately 360 gamma-ray logs of the Dakota aquifer have been digitized in a nine- township area of Hodgeman County (Figure 11). These logs provide an extremely high density of control compared with the average state coverage of the Dakota (one well per township). At each well location stratigraphic tops have been picked as lithostratigraphic subdivisions of the Lower Cretaceous section. These tops and their codes are shown in Figure 12, where they are matched with their corresponding Dakota aquifer subdivisions. The data set will be analyzed with respect to vertical, lateral, and directional change in the distribution of sandstones and shales. The initial phase of the project should be completed by the fall of 1993. The database construction is almost complete, and the analytical strategy has been determined. The data will be analyzed by Ling Bian (Geography Department, University of Kansas) using geostatistical methods to determine the degree of lateral continuity and orientation in the Dakota aquifer units. The results will have important implications regarding the design and performance of the dynamic models that will be applied to simulate flow in the Dakota.
Figure 11--Distribution of digitized gamma-ray logs in the Hodgeman County intensive study area.
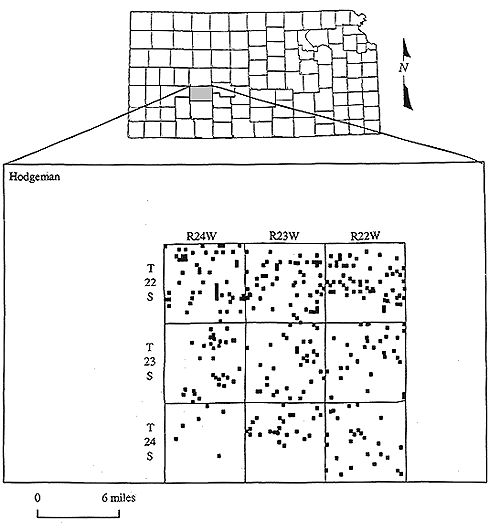
Figure 12--Formation elevations in Hodgeman County data set referenced with lithostratigraphy and aquifer subdivisions.
Previous page--Executive Summary ||
Next page--Geohydrology
Start of this report ||
Table of Contents
Kansas Geological Survey, Dakota Project
Updated Jan. 1997
Comments to webadmin@kgs.ku.edu
URL=http://www.kgs.ku.edu/Dakota/vol3/fy92/rep03.htm