Kansas Geological Survey, Open-File Rept. 91-1
Annual Report, FY91--Page 3 of 8
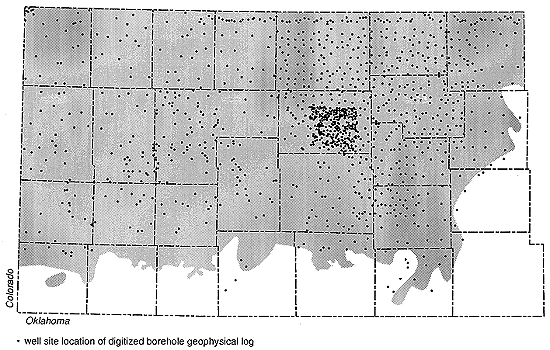
In FY90-91 the sampling density was increased by a factor of 4 (493 logs; 813,000 total ft digitized). These logs have been added to the data base for south-central and southwestern Kansas (T. 17-31 S., R. 14-41 W.). Figure 7 shows the new data distribution in south-central and southwestern Kansas. The digitizing effort was completed in late FY91. The data are now being used to support ongoing efforts to develop more detailed information concerning (1) the shallow subsurface geology and the sequence stratigraphy of the Dakota aquifer framework, (2) the distribution and trends of the sandstone aquifers, and (3) the definition of hydrostratigraphic units in T. 17-31 S., R. 14-41 W. In addition, the density of digitized well logs was increased to cover all the available logs in a nine township area centered on the Hodgeman County monitoring site located south of Jetmore, Kansas (T. 22-24 S., R. 22-24 W.). In this small area 355 additional logs of the Dakota aquifer framework interval were digitized. The additional logs were used to develop detailed geologic information in the vicinity of the monitoring site to assist in the interpretation of hydrologic testing results and to create a detailed characterization of the Dakota aquifer.
Figure 7. Distribution of digitized gamma-ray logs in south-central and southwestern Kansas.

Major falls of sea level cause incision of fluvial valleys and the formation of a major regional subaerial erosional surface, or unconformity, on continents. The base of the Dakota aquifer system is one such unconformity that cuts across both Jurassic and Permian units. Preliminary maps of the top of the Upper Permian and the top of the Jurassic were generated using the ARC/INFO geographic information system, as were several Permian stratigraphic horizons. The basal Cretaceous surface (basal Dakota aquifer) was also mapped. Deposition during the subsequent low-level stillstand of the sea and during the early part of a sea-level rise influed the incised river valleys on land while shoreline and marine sediments accumulated in the Cretaceous Seaway.
The Cheyenne Sandstone overlying the basal Cretaceous unconformity in Kansas is an incised valley-fill deposit (Figure 2). The Seaway and its marine deposits were located to the northwest and the southwest of the state. A rapid rise in sea level resulted in the deposition of marine and shore-zone sediments of the Kiowa Formation and the Longford Member section above the Cheyenne. Thickness and sand content maps of the Cheyenne-Kiowa sequence have been generated. Another major drop in sea level formed an unconformity and sequence boundary that separates the Kiowa-Longford from the overlying Dakota Formation. This unconformity surface has also been mapped. The basal J sandstone of the Dakota Formation was deposited as incised valley fill. In extreme northwestern Kansas the remnant of the subsequent transgressive marine deposits is preserved as the Huntsman Shale, a recognized stratigraphic unit in Colorado. A minor fall of sea level followed incursion of the sea and developed a less prominent erosional boundary. Such minor falls in sea level tend to rejuvenate river systems, and basal fluvial deposits are coarser grained than the sediments underlying the unconformity. The lowermost Dakota D sandstones are the coarse basal fluvial deposits resulting from this type of event. After the drop in relative sea level that caused the basal D unconformity, sea level gradually rose and progressively caused more marine sediments to be deposited over the basal D sediments. The uppermost Dakota Formation D sandstone section contains estuarine to deltaic deposits. The transgressive marine Graneros Shale was deposited in a sea that flooded over the deltaic to estuarine Dakota D sandstones and the coastal plain clays. The alluvial plain sediments of the lower portion of the Dakota Formation are interbedded with the fluvial deposits of the D and J sandstones. Preliminary maps have been constructed for the top of the Dakota Formation and for the top of the Graneros Shale. Thickness and sand content of the entire Dakota and of the Graneros have also been mapped. The Dakota aquifer system underlies the Greenhorn Limestone which was deposited at the time of maximum transgression with little sediment influx.
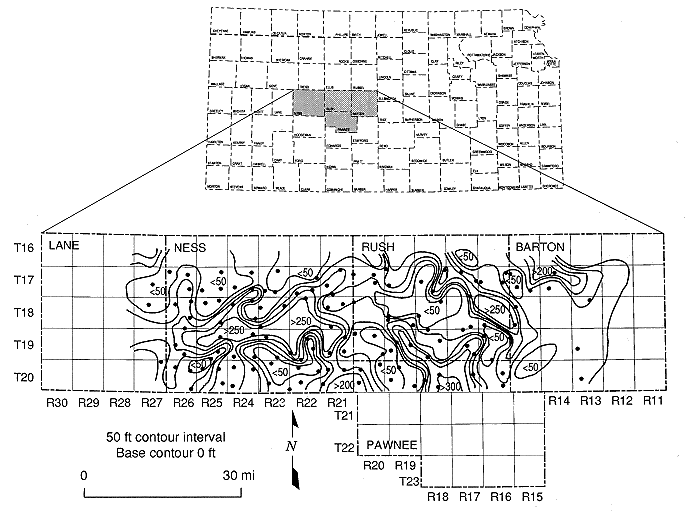
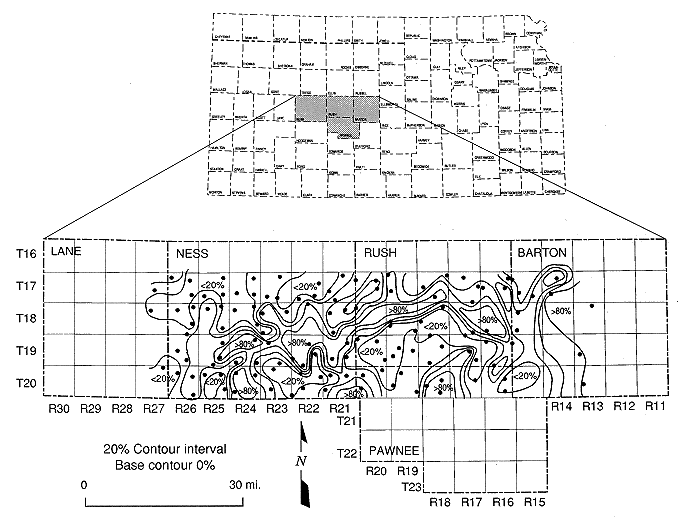
The Dakota aquifer system contains three stratigraphic sequences: the Cheyenne Sandstone-Kiowa Formation, the Dakota Formation J sandstone-Huntsman Shale, and the Dakota Formation D sandstone-Graneros Shale-Greenhorn Limestone. Fluvial deposits within each of these sequences contain the major aquifer-quality sandstones. The river systems of each sequence were developed in trends along topographic lows whose positions were influenced by dissolution of underlying bedded salt deposits in the Permian Flower-pot Shale. Structure maps of the tops of the various intervals display decreasing relief with each succeeding mapped interval. In Southwestern and south-central Kansas sandstone thicknesses are maximum along the trends of the river systems. The sand continuity is best along these paleoflow directions, which vary locally but trend generally to the northwest. The sandstone bodies are more linear than sheetlike and are arranged in an approximately dendritic drainage pattern across the state. Maps showing the proportion of sandstone to the total thickness of sediments in the Dakota Formation of southwestern and south-central Kansas were prepared using a new computer program integrated with the ARC/INFO system to display these patterns (Figures 8 and 9). In general, the lowermost fluvial deposits of the Cheyenne Sandstone are isolated from the upper sandstones by the intervening Kiowa Formation. The sandy deposits of the Dakota D and J sandstones are interconnected because of incision of the D fluvial system and a lack of a transgressive shale between the two sequences in Kansas. The uppermost Dakota D deltaic to estuarine sandstones have a more three-dimensional character and contain well-sorted sheetlike deposits.
Figure 8. Total thickness of sandstone in the Dakota Formation in portions of Lane, Ness, Barton, and Pawnee counties.

Figure 9. Proportion of sandstone to total formation thickness in the Dakota Formation in portions of Lane, Ness, Barton, and Pawnee counties.
