Kansas Geological Survey, Open-File Rept. 90-27
Annual Report, FY89--Page 5 of 10
A ground-water-quality data-base system called KWATCHEM was developed using INFO, the relational data-base management system of the geographic information system ARC/INFO on the KGS Data General computer. KWATCHEM allows use of the water-quality data in the mapping and analysis programs of both ARC/INFO and existing computer programs of the Survey such as SURFACE III for contouring data surfaces. KWATCHEM was formulated and implemented as part of the Dakota Aquifer Program. Information on the development, content, and function of the KWATCHEM system is given in Appendix A. Well sites from which water samples were collected and analyzed are coded in KWATCHEM according to the U.S. Geological Survey system for formations in Kansas. Data examined for this report on the basis of formations sampled were grouped into three basic classes according to the formation code existing in previous digital data or entered in new or undigitized data: (1) Dakota Formation or older formation names equivalent to the Dakota, and undifferentiated Lower Cretaceous strata; (2) Kiowa Shale; (3) Cheyenne Sandstone.
A total of 1319 chemical records related to the Dakota Program currently exist in the KWATCHEM system. Additional data are added as they become available. The present data represent 772 different well sites that are coded as Dakota, equivalent unit, or Lower Cretaceous Series. In addition, there are 96 well sites coded as the Kiowa Formation and 33 well sites as the Cheyenne Sandstone. A well site is defined as a unique sampling point or interval and includes as different well sites the different sampling depths of multiple wells at a single geographic site. Most well sites consist of only one sampling interval. However, several sites include multiple intervals that were sampled at the same site. Multiple samples (collected on different dates) exist for many well sites.
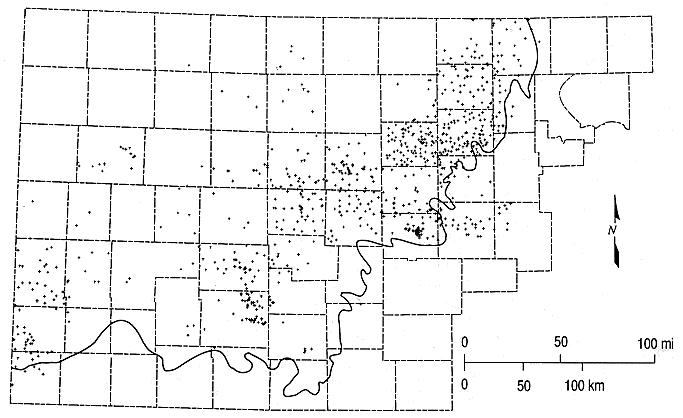
Figure 6.1 shows the distribution of the geographic locations of the well sites. Most of the sites are located where the water in the aquifer is of good enough quality to be used for water supply. The densest distribution of points is in a band along the eastern outcrop and subcrop of the Dakota Formation, with smaller numbers of points in southwestern Kansas. Table A.15 in Appendix A lists the distribution of well sites for each county for which water-quality data in KWATCHEM exist for units comprising the Dakota aquifer, including the Dakota, Kiowa and Cheyenne formations.
Figure 6.1. Distribution of geographic locations of chemical records in the KWATCHEM data-base system for the Dakota aquifer study. The heavy solid line is the outcrop/subcrop boundary of the bottom of the Dakota aquifer.

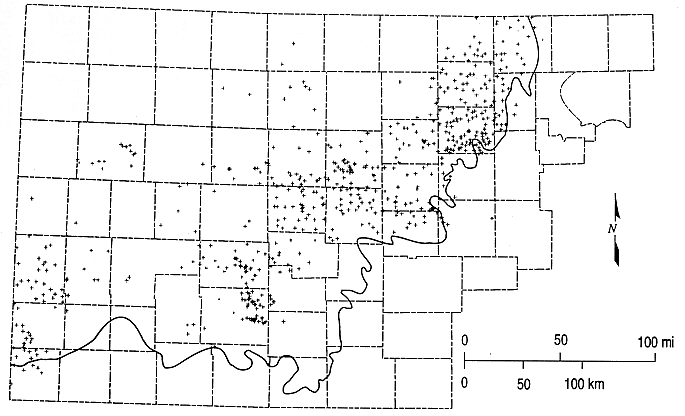
Figures 6.2 and 6.3 are the contour map of chloride concentration for the upper Dakota aquifer (Dakota Formation) and the distribution of the data points in KWATCHEM for which chloride values exist and that were used in preparing the contour map, respectively. Data for the lower portion of the Dakota aquifer (Kiowa Formation and Cheyenne Sandstone) were not included to avoid introducing anomalies that could result from differing chemistry in the upper and lower portions of the Dakota aquifer. Figures 6.4 and 6.5 are the contour map and the distribution of points, respectively, for TDS concentrations. The contour plots were generated such that contour lines would be relatively evenly spaced over the map region and with a consistent progression in interval. The relative changes in chloride and TDS concentration are great in certain subregions such as near the outcrop area, thus a logarithmic to geometric progression in the contour intervals was found to be appropriate. Another consideration in the interval values was the 5,000 and 10,000 mg/L limit on chloride and TDS, respectively, for useable water according to statutes of Kansas. The intervals used for chloride concentration are 100, 500, 1000, and 5000 mg/L, and for TDS, 500, 1000, 5000, and 10,000 mg/L. A large colored map was generated using a CalComp printer/plotter for the chloride contours and chemical water types (Plate 2). The outcrop/subcrop lines on Plate 2 represent the surface or subsurface front of the Dakota aquifer.
Figure 6.2. Contour map of chloride concentrations for the upper Dakota aquifer based on water-quality data in the KWATCHEM system. The heavy solid line is the outcrop/subcrop boundary of the bottom of the Dakota aquifer.

Figure 6.3. Distribution of data points for the contour map of chloride concentrations (Figure 6.2). The heavy solid line is the outcrop/subcrop boundary of the bottom of the Dakota aquifer.
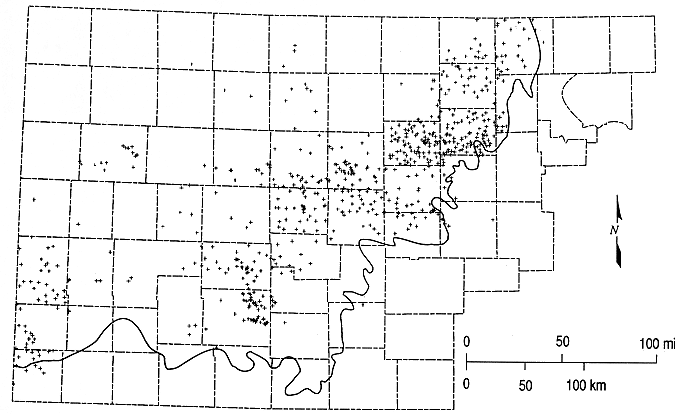
Figure 6.4. Contour map of total-dissolved-solids concentrations for the upper Dakota aquifer based on water-quality data in the KWATCHEM system. The heavy solid line is the outcrop/subcrop boundary of the bottom of the Dakota aquifer.
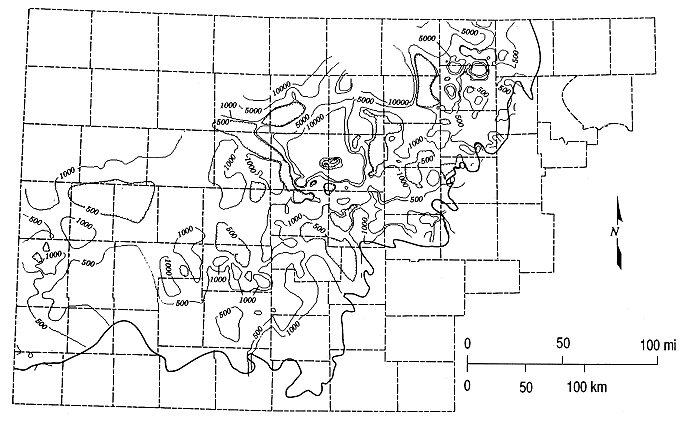
Figure 6.5. Distribution of data points for the contour map of total-dissolved-solids concentrations (Figure 6.4). The heavy solid line is the outcrop/subcrop boundary of the bottom of the Dakota aquifer.
The rate of change in the chloride concentration of the upper Dakota aquifer with areal distance is great along the easternmost outcrop/subcrop of the top of the Dakota aquifer that trends in a southeast direction from Republic County through Cloud, Mitchell, Lincoln, Russell, and Ellsworth counties, to Barton County. Great changes in chloride content over relatively small lateral distances extend into Rush County. The contour intervals generally are more widely spaced in western Kansas.
Computation of a chemical water type is based on conversion of the charged species concentrations to equivalents/L. The first cation and anion in a water-type designation is that which has the highest concentration of the individual sums of the major cations and anions. The logic used for designation of cations and anions of secondary importance is as follows: (1) If the major cation or anion comprises greater than 50% of the total concentration of cations or anions, respectively, the secondary ion must constitute more than 33% of the total; (2) If the major ion comprises less than 50% of the total, then the secondary ion must constitute more than 30%. It is possible to have all three cations or anions in the water-type designation if all three are greater than 30%.
The chemical types of water were computed for the well sites geologically coded as Dakota Formation or equivalent strata and undifferentiated Lower Cretaceous strata. Waters from the lower Dakota aquifer were not included to avoid anomalies, as stated before. Where multiple samples exist for the same well site, the most recent sample was selected for the computation. Table 6.1 lists the distribution of the well sites according to chemical water type. Each major group of water types is arranged in order of decreasing number of occurrences.
Table 6.1. Chemical types of water in the upper portion of the Dakota aquifer. The groups are listed in order of the total number of occurrences for each general group, including both primary and secondary classes. The total number of all records for which water types could be calculated is 572.
| Water Type | Number of occurrences |
Total number of occurrences | ||
|---|---|---|---|---|
| Subgroups | Entire group | |||
| Ca- and/or Mg-HC03 | ||||
| Primary groups | 124 | 197 | ||
| Ca-HCO3 | 111 | |||
| Ca, Mg-HCO3 | 10 | |||
| Mg, Ca-HCO3 | 2 | |||
| Mg-HCO3 | 1 | |||
| Mixed-ion groups | 73 | |||
| Ca, Na-HCO3 | 37 | |||
| Ca-HCO3, SO4 | 14 | |||
| Ca-HCO3, Cl | 7 | |||
| Ca, Na-HCO3, Cl | 5 | |||
| Ca, Na-HCO3, SO4 | 4 | |||
| Mg, Na-HCO3, SO4 | 3 | |||
| Ca, Mg-HCO3, SO4 | 1 | |||
| Ca, Na, Mg-HCO3, SO4 | 1 | |||
| Ca-HCO3, Cl, SO4 | 1 | |||
| Mg, Ca, Na-HCO3 | 1 | |||
| Na-Cl | ||||
| Primary group | 129 | 167 | ||
| Na-Cl | 129 | |||
| Mixed-ion groups | 37 | |||
| Na-Cl, HCO3 | 28 | |||
| Na, Ca-Cl, HCO3 | 3 | |||
| Na, Ca-Cl | 2 | |||
| Na, Ca-Cl, SO4 | 2 | |||
| Na-Cl, SO4 | 2 | |||
| Na-HCO3 | ||||
| Primary group | 59 | 136 | ||
| Na-HCO3 | 59 | |||
| Mixed-ion groups | 77 | |||
| NaHCO3, Cl | 23 | |||
| Na, Ca-HCO3 | 22 | |||
| Na-HCO3, SO4 | 20 | |||
| Na, Ca-HCO3, SO4 | 6 | |||
| Na, Ca-HCO3, Cl | 2 | |||
| Na, Mg-HCO3 | 2 | |||
| Na, Ca, Mg-HCO3, SO4 | 1 | |||
| Na, Mg, Ca-HCO3 | 1 | |||
| Ca-SO4 | ||||
| Primary groups | 8 | 43 | ||
| Ca-SO4 | 7 | |||
| Ca, Mg-SO4 | 1 | |||
| Mixed-ion groups | 35 | |||
| Ca-SO4, HCO3 | 15 | |||
| Ca, Na-SO4, HCO3 | 8 | |||
| Ca, Na-SO4, Cl | 4 | |||
| Ca, Na-SO4 | 3 | |||
| Ca, Mg-SO4, HCO3 | 2 | |||
| Ca, Mg, Na-SO4 | 1 | |||
| Ca, Na-SO4, Cl, HCO3 | 1 | |||
| Ca-SO4, Cl | 1 | |||
| Ca-Cl | ||||
| Primary group | 4 | 17 | ||
| Ca-Cl | 4 | |||
| Mixed-ion groups | 13 | |||
| Ca-Cl, HCO3 | 6 | |||
| Ca, Na-Cl, HCO3 | 3 | |||
| Ca, Na-Cl, SO4 | 2 | |||
| Ca, Na-Cl | 1 | |||
| Ca-Cl, SO4 | 1 | |||
| Na-SO4 | ||||
| Primary group | 1 | 13 | ||
| Na-SO4 | 1 | |||
| Mixed-ion groups | 12 | |||
| Na, Ca-SO4, HCO3 | 4 | |||
| Na-SO4, HCO3 | 4 | |||
| Na-SO4, Cl | 2 | |||
| Na, Ca-SO4 | 1 | |||
| Na, Ca-SO4, Cl | 1 | |||
The general pattern in water types (Plate 2) reflects that displayed in a water-type map produced by the USGS for the Maha (Dakota) aquifer as part of the regional study of the Great Plains aquifer (Helgeson et al., in press). However, Plate 2 shows more complexity than the USGS map because more information, and thus detail, is present in the plate. The complexity is primarily related to similar factors such as the chloride distribution described above, and to dissolution and precipitation of carbonate minerals and cation exchange reactions on clays in the strata.
The freshwaters in the eastern outcrop/subcrop zone of the Dakota aquifer tend to be mainly Ca-HCO3 or Ca,Na-HCO3 waters, with Ca,Mg-HCO3 and Ca-HCO3 type waters of next importance. These waters mainly reflect dissolution of limestone and dolomite. The mixed calcium and sodium cation type waters indicate the effect of mixing with Na-HCO3 waters farther to the west and near the edge of the subcrop zone. Na-HCO3 and mixed cation and/or anion type waters in which sodium and bicarbonate are the predominant ions are also important in a large area of the west-central part of Kansas. The Na-HCO3 waters are probably derived from concomitant ion exchange of calcium and magnesium ions for sodium on clays and the dissolution of calcium and magnesium carbonate minerals causing an increase in bicarbonate concentration.
Some waters of Ca-SO4 type occur in the zone of slightly saline water near the outcrop/subcrop top of the Dakota aquifer. The main source of the major constituents in these waters is either oxidation of pyrite within Dakota sediments to sulfate and solution of calcite by the acidic water produced, or percolation of water that had dissolved gypsum in the overlying Graneros Shale. These water mix with Ca-HCO3 water to form Ca-SO4,HCO3 water generally in the area containing chloride concentrations below or near 100 mg/L.
Farther to the west of the Na-HCO3 waters along the eastern outcrop/subcrop of the top of the Dakota aquifer and extending to the west into northwest Kansas are Na-Cl waters with high chloride concentrations. The source of the salinity in these waters is solution of halite in Permian rocks and movement of the brine upwards into the Dakota aquifer strata. Mixing of this water in the aquifer with Na-HCO3 water is indicated by the abundance of Na-Cl,HCO3 type water.
The two other groups of chemical water types are less common than the other four groups. Ca-Cl and mixed cation-mixed anion waters in which calcium and chloride are the predominant ions are scattered through the eastern outcrop zone of the Dakota aquifer. Contamination of ground waters by oil-field brines is a possible origin of these waters in addition to mixing of Ca-SO4 with Na-Cl type waters. Mixed cation-mixed cation waters in which sodium and sulfate are the predominant ions are scattered primarily through the outcrop areas where fresh to slightly saline waters occur from southwest and west-central Kansas to the eastern outcrop zone. This water type tends to occur in areas where Ca-SO4 waters are present and may have been formed by the effect of cation exchange on Ca-SO4 type water.
Figure 6.6. Trilinear diagram for ground water. Data from KGS statewide water chemistry database.
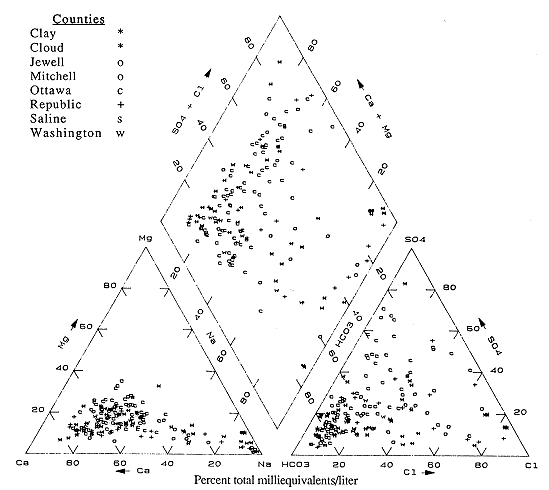
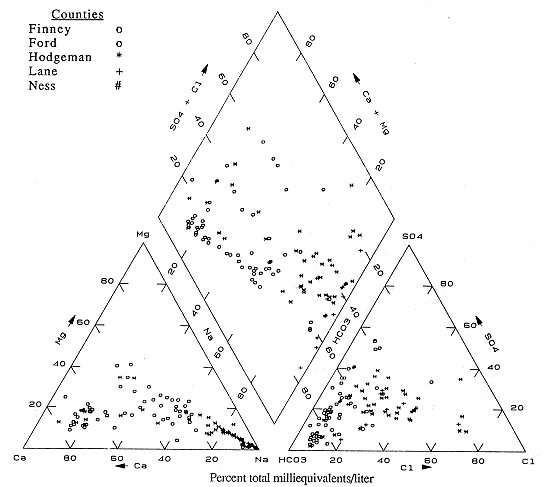
Trilinear plots (Piper, 1944) are a graphical tool for displaying water-chemistry types and analyzing changes in water chemistry throughout an area. The plots comprise two triangular graphs, one each for the major cations and anions, and a rhombus-shaped graph that represents both cation and anion composition. Each part of the diagram displays the percentage contribution of an individual ion or sum of two ions to the total cation or anion equivalent concentration. Figures 6.6-6.11 are trilinear plots for various groups of counties throughout the state and illustrate the change in water chemistry in the various county groups.
A comparison of the water-type map (Plate 2) and the trilinear plots for the Dakota water data shows similar trends. The counties in the outcrop zone show dominantly Ca-HCO3 water in the eastern and southern edges of the counties with more saline waters or varying water types moving westward or northward from the county boundaries.
In northeast Kansas (Clay, Cloud, Jewell, Mitchell, Ottawa, Saline, and Republic counties) the predominant water-type is Ca-HCO3 (Figure 6.6). The predominance of points plot in the calcium and bicarbonate portions of the diagram. There are also a number of points in the predominantly sodium and chloride fields. These waters are present nearer the western edges of the counties represented in the diagram. Points between the two areas indicate mixed water types, and represent the transition from one water-type to another in the counties.
Figure 6.7 is the trilinear diagram for the next group of counties (Barton, Ellis, Ellsworth, Lincoln, Rice, and Russell). Again, many of the analyses plot in the calcium and bicarbonate areas of the diagram. These points correspond to the outcrop and shallower wells in the region. There is also a high density of points in the sodium and chloride portions of the diagram. These analyses corresponding to the deeper wells in the western and northern parts of the counties.
Figure 6.7. Trilinear diagram for ground water. Data from KGS statewide water chemistry database.
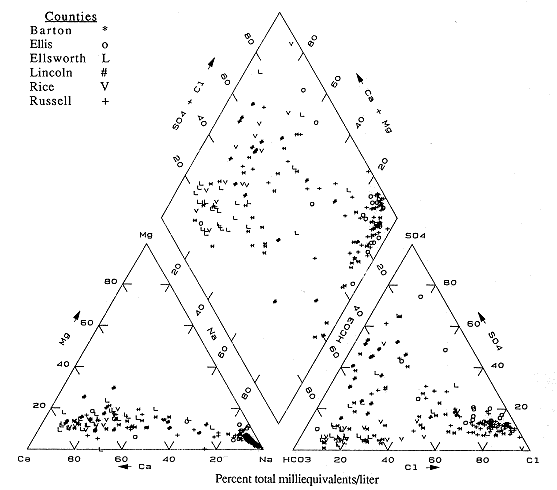
Figure 6.8 is the trilinear diagram for Ellis, Graham, Rooks, Rush, and Trego counties. Most of the analyses plot in the sodium area for cations, but range from the chloride to bicarbonate areas for anions, indicating either exchange reactions between Ca-HCO3 waters and clays in the Dakota aquifer strata, or infiltration of saline waters either from underlying Permian units or from oil-field brine contamination. The presence of a few samples in the calcium and sulfate portions of the graph suggests that some gypsum solution may be occurring in this part of the state.
Figure 6.8. Trilinear diagram for ground water. Data from KGS statewide water chemistry database.
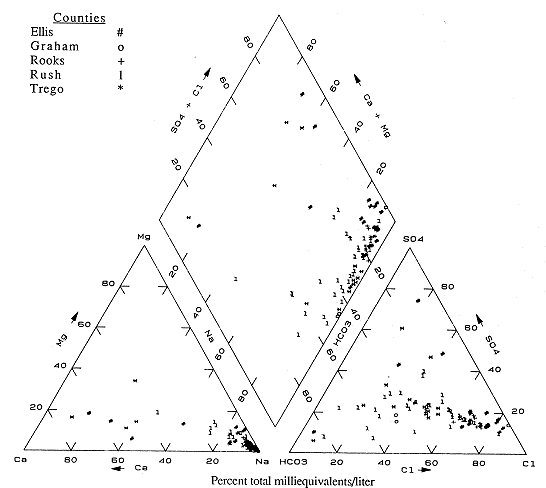
Figure 6.9 is the diagram for Hodgeman, Ness, Pawnee, and Rush counties. There is a wide distribution of water types in this area. This is also indicated by the distribution of different symbols on Plate 2. The samples plot mainly in two areas of the figure: the calcium and bicarbonate portions and the sodium and chloride parts, although Na-HCO3 type waters are also present. The waters of Ca-HCO3 type are primarily from the subcrop and outcrop zone (Plate 2). The Na-Cl and Na-HCO3 waters occur in the deeper wells and in areas of fractures and regional uplift.
Figure 6.9. Trilinear diagram for ground water. Data from KGS statewide water chemistry database.
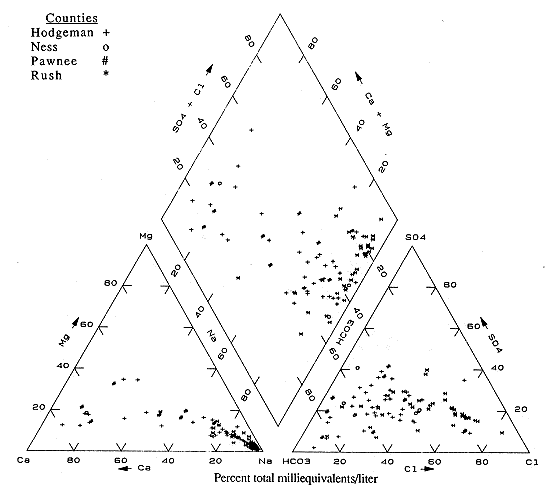
Figure 6.10 is the diagram for Finney, Ford, Hodgeman, Lane and Ness counties. These analyses also illustrate a wide range of water types. In Finney and Ford counties the dominant water types are Ca-HCO3 and mixed ion. In these counties the Dakota is frequently used in conjunction with the overlying Ogallala as an irrigation water source. The presence of mixed ion and Na-HCO3 waters in these counties indicate that cation-exchange processes and some mixing of different water types are occurring.
Figure 6.10. Trilinear diagram for ground water. Data from KGS statewide water chemistry database.
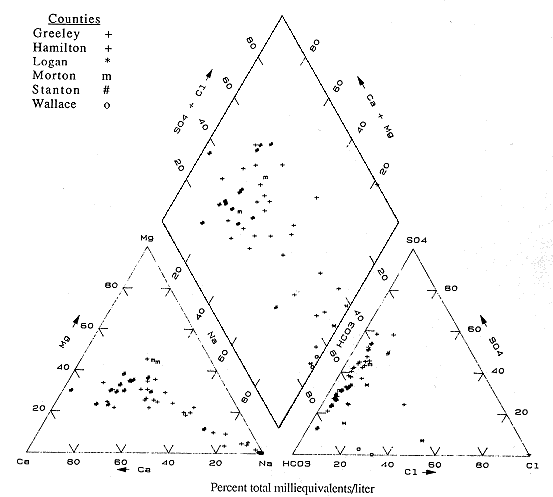
The last trilinear diagram is for Greeley, Hamilton, Logan, Wallace, Morton, and Stanton counties (Figure 6.11). This area shows a wide range of water types that indicate the changes from outcrop to deeper rock zones.
Figure 6.11. Trilinear diagram for ground water. Data from KGS statewide water chemistry database.
Chemical Trends Along Ground-Water-Flow Paths in the Dakota Aquifer
Ground-water chemistry along ground-water flow paths is thought to evolve from a starting anionic composition of bicarbonate through compositions dominated by sulfate, and finally chloride (Cheboterev, 1955; Freeze and Cherry, 1979). The cation composition of ground water may also evolve steadily from a starting composition dominated by calcium, followed by calcium and sodium, and finally by sodium. The actual sequence can vary depending upon the order in which rock types are encountered by ground water (Freeze and Cherry, 1979). The evolutionary sequence described above has been tied to water-rock reactions such as dissolution of calcite, cation exchange on clay minerals, and dissolution of evaporites. Water analyses available in KWATCHEM provided a data base for investigating the changes in water chemistry along ground-water-flow paths in the Dakota aquifer. These data are used to examine geochemical reactions occurring in the Dakota aquifer and to assess the continuity of ground-water-flow paths in the aquifer. The data used in the analysis are listed in Table 6.2.
Table 6.2. Chemical analyses for Dakota aquifer waters used in equilibria calculations for flow paths.
| WATCHEM ID latitude-longitude well number* |
County | Legal location T-R-Sec. |
Sample date | Well depth (ft) |
pH (field) |
Temp (deg. C) |
SiO2 (mg/L) |
Ca (mg/L) |
Mg (mg/L) |
Na (mg/L) |
K (mg/L) |
HCO3 (mg/L) |
SO4 (mg/L) |
Cl (mg/L) |
F (mg/L) |
|---|---|---|---|---|---|---|---|---|---|---|---|---|---|---|---|
| Southern flow path | |||||||||||||||
| 374559101452001A | Hamilton | 26S 41W 24CDC | 05-04-64 | 265 | 7.40 | 16.0 | 17.0 | 93 | 47 | 90 | 7.7 | 380 | 270 | 24 | 1.5 |
| 374829101345401A | Hamilton | 26S 39W 09AAA | 05-01-64 | 120 | 7.80 | 16.5 | 6.5 | 33 | 18 | 100 | 8.6 | 270 | 140 | 15 | 3.5 |
| 381357100110601A | Hodgeman | 21S 26W 16BBA | 05-15-69 | 368 | 7.90 | 15.5 | 6.8 | 10 | 2 | 230 | 7.0 | 280 | 150 | 96 | 4.0 |
| 381457099501401A | Hodgeman | 21S 23W 03CDB | 05-16-72 | 400 | 8.10 | 18.0 | 8.4 | 10 | 2.9 | 190 | 6.6 | 250 | 110 | 89 | 2.4 |
| 382737099011101A | Barton | 19S 15W 30ACA | 09-14-78 | 85 | 7.20 | 16.0 | 8.6 | 120 | 13 | 80 | 8.0 | 370 | 77 | 120 | 0.4 |
| 382519098400201A | Barton | 19S 12W 05DDC | 09-22-78 | 60 | 7.60 | 22.0 | 16.0 | 75 | 6.1 | 39 | 2.0 | 300 | 11 | 26 | 0.3 |
| 383610098120901A | Ellsworth | 17S 08W 04ADD | 11-18-61 | 59 | 14.0 | 9.0 | 70 | 15 | 35 | 9.0 | 310 | 18 | 40 | 0.6 | |
| Central flow path | |||||||||||||||
| 381511101552901A | Hamilton | 21S 42W 03CB | 06-21-72 | 942 | 8.20 | 15.0 | 4.8 | 2 | 220 | 5.2 | 400 | 120 | 38 | 2.8 | |
| 381033101453701A | Hamilton | 21S 40W 31CCC | 08-26-77 | 902 | 7.50 | 25.0 | 10.0 | 14 | 6.6 | 120 | 5.1 | 230 | 130 | 15 | 1.4 |
| 381126101424801A | Hamilton | 21S 40W 28DCC | 06-16-64 | 784 | 8.20 | 21.5 | 9.0 | 10 | 7.8 | 260 | 7.7 | 400 | 220 | 46 | 2.8 |
| 382825100234302A | Lane | 18S 28W 22DAB | 05-11-76 | 7.80 | 24.0 | 14 | 8 | 450 | 8.8 | 280 | 130 | 480 | 3.2 | ||
| 384239099195401A | Ellis | 15S 18W 33BAA | 07-13-78 | 154 | 7.70 | 21.0 | 9.2 | 30 | 12 | 740 | 13.0 | 310 | 270 | 850 | 4.4 |
| 394239099195401A | Ellis | 15S 18W 33BAA | 07-11-79 | 154 | 7.60 | 21.0 | 9.0 | 59 | 13 | 720 | 11.0 | 350 | 300 | 840 | 4.0 |
| 383916099121801A | Rush | 16S 17W 16DCD | 07-06-78 | 370 | 7.00 | 21.0 | 5.3 | 10 | 5 | 440 | 10.0 | 260 | 200 | 440 | 3.7 |
| 383916099121801A | Rush | 16S 17W 16DCD | 08-28-84 | 370 | 8.20 | 15.0 | 7.2 | 12 | 7 | 460 | 8.2 | 282 | 200 | 440 | 3.7 |
| 385055098352901A | Russell | 14S 11W 07CAB | 05-25-78 | 100 | 6.80 | 22.0 | 25.0 | 140 | 8.1 | 73 | 5.0 | 280 | 160 | 140 | 0.1 |
| 385055098352901A | Russell | 14S 11W 07CAB | 05-15-79 | 100 | 7.10 | 19.5 | 12.0 | 170 | 8 | 85 | 5.0 | 360 | 170 | 120 | 0.3 |
| 390102098165901A | Lincoln | 12S 09W 11DDC | 09-16-47 | 16 | 7.30 | 15.5 | 14.0 | 140 | 25 | 61 | 7.0 | 300 | 190 | 75 | 0.4 |
| 390147098023501A | Lincoln | 12S 07W 12AAB | 09-15-47 | 130 | 7.1 | 15.5 | 11.0 | 130 | 31 | 230 | 6.4 | 330 | 410 | 160 | 0.8 |
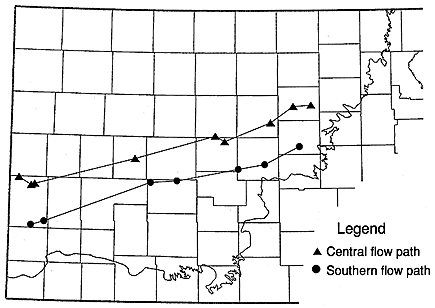
Two ground-water-flow paths, chosen to represent conditions in the southern and west-central portions of the Dakota aquifer in Kansas (Figure 6.12), show a change in head of about 1600 ft. These flow paths assume continuity of flow from the western border of Kansas to the outcrop of the Dakota in central Kansas and are based only on the change in head on the potentiometric surface. The flow paths were chosen to coincide with a maximum number of wells with chemical analyses, although it is clear that the number of chemical analyses should be augmented in order to better describe the geochemical system.
Figure 6.12. Location of central and southern flow paths, Dakota aquifer, and wells from which chemical analyses of sample were used in this study. The irregular boundary is the outcrop/subcrop of the base of the Dakota aquifer.
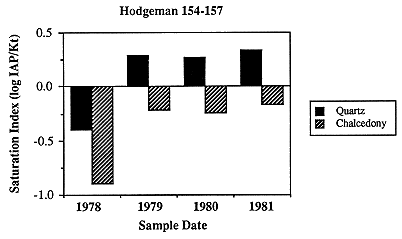
Two of the wells had been sampled repeatedly over a period of 3 and 25 years, respectively. The ranges in concentration of parameters is small (Table 6.3) for each of the wells, and neither well shows a systematic change in concentration for any parameter through time (Figure 6.13). In one sample, the reported temperature is 5-6°C higher than the temperature of other samples. This suggests inadequate flushing of the water-production system during sampling, but because the other parameters show little difference between the high-temperature sample and the low-temperature samples, all samples are considered to be valid representatives of in situ ground-water chemistry of the Dakota aquifer. The calculated saturation indices with respect to the carbonates (Figure 6.14) and two silica polymorphs (Figure 6.15) show a fairly systematic decrease and increase, respectively, which may indicate dynamic evolution of water chemistry within the Dakota.
Table 6.3. Chemical analyses for two Dakota aquifer wells sampled repeatedly over a number of years. The site identification number in the INFO water-quality data base called KWATCHEM and the total well depth are 380517099565201A and 416 ft, respectively, for the Hodgeman County well, and 383916099121801A and 370 ft, respectively, for the Rush County well.
| Hodgeman County well | |||||||||||
|---|---|---|---|---|---|---|---|---|---|---|---|
| Sample date |
pH (field) |
Temp (deg. C) |
SiO2 (mg/L) |
Ca (mg/L) |
Mg (mg/L) |
Na (mg/L) |
K (mg/L) |
HCO3 (mg/L) |
SO4 (mg/L) |
Cl (mg/L) |
F (mg/L) |
| 08-25-78 | 8.0 | 20 | 3.2 | 19 | 9 | 160 | 8 | 280 | 120 | 55 | 3 |
| 08-17-79 | 8.0 | 18 | 14.4 | 19 | 10 | 160 | 8 | 269 | 140 | 53 | 3 |
| 08-19-80 | 8.0 | 16 | 12.8 | 19 | 10 | 160 | 8 | 280 | 140 | 54 | 3 |
| 07-03-81 | 7.0 | 18 | 16.0 | 17 | 9 | 140 | 6 | 256 | 72 | 63 | 2 |
| Rush County well 16S-17W-16DCD | |||||||||||
| Sample date |
pH (field) |
Temp (deg. C) |
SiO2 (mg/L) |
Ca (mg/L) |
Mg (mg/L) |
Na (mg/L) |
K (mg/L) |
HCO3 (mg/L) |
SO4 (mg/L) |
Cl (mg/L) |
F (mg/L) |
| 05-12-60 | na | 15.5 | 8.0 | 11 | 11 | 460 | na | 277 | 200 | 450 | 3.4 |
| 07-06-78 | 7.0 | 21 | 8.5 | 10 | 5 | 440 | 10 | 260 | 200 | 440 | 3.7 |
| 06-27-79 | 8.0 | 15 | 11.2 | 13 | 6 | 450 | 8 | 280 | 200 | 440 | 3.8 |
| 17-07-80 | 7.6 | 16.5 | 6.4 | 10 | 4 | 450 | 8 | 250 | 220 | 430 | 3.6 |
| 08-04-81 | 8.3 | 15.5 | 8.0 | 12 | 6 | 420 | 10 | 256 | 180 | 400 | 3.4 |
| 08-04-83 | 7.9 | 16 | 12.8 | 14 | 7 | 450 | 8 | na | 210 | 430 | 3.3 |
| 08-28-84 | 8.2 | 15 | 11.5 | 12 | 7 | 460 | 8.2 | 282 | 200 | 440 | 3.7 |
| 07-12-85 | 7.4 | 15 | 11.7 | 12 | 7 | 380 | 7.4 | 291 | 100 | 430 | 3.3 |
Figure 6.13. Time-series water-chemistry data for water samples collected from a well in Hodgeman County for the period 1978 to 1981.
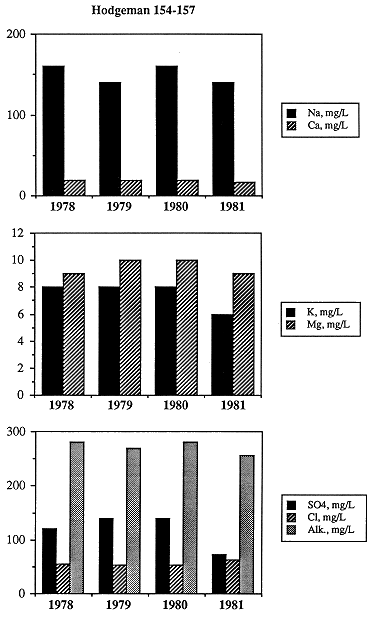
Figure 6.14. Calculated saturation indices for carbonates using the water analyses from the Hodgeman County well (Figure 6.13). Note the carbonate saturation decreases over the sampling period.
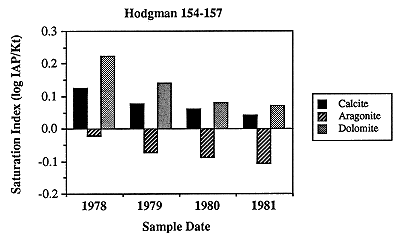
Figure 6.15. The saturation state with respect too two silica polymorphs in samples from the Hodgeman County well (Figure 6.13). Note the increase in silica saturation over the sampling period.
Two parameters often measured in the field because they may change quickly after the solution is removed from the aquifer are alkalinity and pH. If the partial pressure of carbon dioxide (PCO2) and oxygen PO2) in the aquifer are equal to the PCO2 and PO2 in the atmosphere, then the pH of the solution should not change. However, the PCO2 in aquifers is usually one to two orders of magnitude higher and the PO2 in aquifers is similarly much lower than in the atmosphere. The alkalinity of a solution can change if carbonate minerals such as calcite precipitate as a result of the changing PCO2 and pH of the solution, or if dust containing calcite contaminates the solution during the sampling and that calcite is dissolved in the solution. Although it is impossible to check for these kinds of errors without retesting the wells, the sensitivity of the speciation program results to analytical error during pH measurement and alkalinity titration was tested. For a standard alkalinity titration, the error in titration results mostly from the error in the acid-dispensing burette, which can correspond to up to 2 mg/L alkalinity. The error in the endpoint measurement is much more difficult to quantify because it is either human error or automatic titrimeter error in end-point determination as well as error in the pH meter used during the titration. To maximize the error, one chemical analysis was speciated with the alkalinity as reported and another with the alkalinity -20 mg/L. The change of 3.3% in alkalinity changed the calculated saturation index of calcite 6.1%. These errors are small relative to changes in overall chemical composition throughout the study area and to differences in thermodynamic data for minerals and species. For example, the equilibrium constant for calcite at 25°C was reported by Kharaka and Barnes (1973) as 10-8.36 by Helgeson (1969) as 10-8.37 and by Parkhurst, et al. (1985) as 10-8.48. This is a difference of 24%. For this reason, the chosen chemical analyses are used as reported.
The pH of a solution changes in response to degassing carbon dioxide, as described above. For this reason, most aqueous geochemists measure pH in the field, as soon after sampling as possible (Barnes, 1964; Wood, 1976; Lico et al., 1982). Although pH changes with degassing of carbon dioxide from solution, alkalinity does not (Stumm and Morgan, 1981). Thus, it is possible, assuming equilibrium with respect to calcite, to calculate in situ pH knowing alkalinity as well as the major-ion chemistry of the water. This procedure assumes that all waters are in equilibrium with calcite, which may be a reasonable assumption considering the ubiquity of authigenic calcite. In the Dakota aquifer analyses considered here, all are nearly saturated with respect to calcite, and thus the pH values reported were considered to be good representations of in situ conditions. Verification of this will require careful field testing.
In the following discussion, ionic strength is used as an indicator of overall salinity of the ground water. Ionic strength is defined as
I = mizi2
where mi is molality of species iIonic strength reflects the amount of charged species in water and differs from total-dissolved solids in which the weight of all dissolved species is included. The number of ions involved in uncharged complexes increases with increasing salinity, so that ionic strength is not linearly proportional to total-dissolved solids. Ionic strength is calculated after speciation of the water in PHREEQE and is used in this discussion because of its importance in understanding mineral-saturation states.
Ionic strength along the southern flow path decreases with a moderate increase near the middle of the path (Figure 6.16). This contradicts the usual change in water chemistry along flow paths in which ionic strength increases, and suggests that local recharge probably plays an important part in the geochemical system. Ionic strength is not clearly related to well depth (Figure 6.17), and thus proximity to the ground surface of well production intervals in the Dakota aquifer does not necessarily increase susceptibility to recharge which would result in ground water of lower ionic strength.
Figure 6.16. Ionic strength, plotted against distance along the southern flow path.
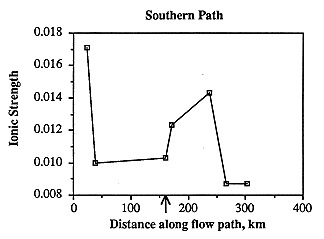
Figure 6.17. Ionic strength of water samples vs. well depth. Arrows show the direction of ground-water movement along the flow path.
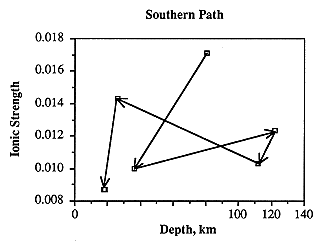
Along the southern flow path, ionic strength is highest in the westernmost sample. It decreases abruptly approximately 9 miles farther along the flow path, remains nearly the same for the next 81 miles, increases to about 84% of the westernmost sample over the next 42 miles, then drops abruptly to the lowest ionic strength over the next 17 miles (Figure 6.16). The shallowest samples are from the easternmost part of the study area and probably contain a large portion of local surficial (dilute) recharge (Figure 6.17). The other relatively shallow samples, however, do not necessarily have a low ionic strength, and thus other factors must be considered. In the middle of the flow path where the ionic strength increases, the Dakota is no longer separated from the permeable Permian section containing saline water (specifically, the Cedar Hills Sandstone) by impermeable strata. This suggests that cross-formational flow from Permian aquifers may be contributing appreciable amounts of fluid to the Dakota aquifer. More detailed work is needed to show whether fluids, which may have leaked from the Cedar Hills Sandstone, are moving from the lower, permeable section of the Dakota aquifer through the relatively impermeable Kiowa Shale and into the upper, permeable section of the Dakota.
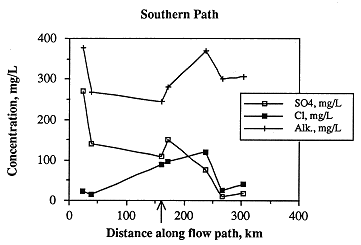
The concentrations of individual species along the flow path follow trends similar or exactly opposite to ionic strength. The cations sodium and calcium increase and decrease dramatically near the Cedar Hills subcrop boundary (Figure 6.18), but calcium then increases to its highest value about 42 miles east of the subcrop. As with ionic strength, sodium and calcium concentrations are lowest at the end of the flow path. Chloride content is lowest in the westernmost ("beginning" of flow path) and easternmost ("end" of flow path) samples. The sulfate content of Dakota ground water is highest in the west and decreases steadily to the east, with a slight increase near the Cedar Hills subcrop (Figure 6.19). Alkalinity is highest in the westernmost sample and about 42 miles east of the Cedar Hills subcrop (Figure 6.19).
Figure 6.18. Variations in sodium and calcium content along the southern ground-water flow path.
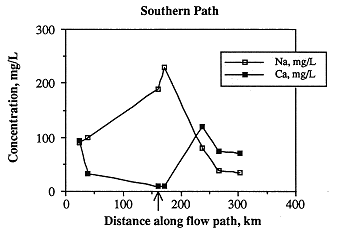
Figure 6.19. Variations in major anionic species along the southern ground-water flow path. Arrow indicates the upgradient edge of the hydraulic connection between the Cedar Hills Sandstone and Dakota aquifer.
Saturation indices for calcite, aragonite and dolomite vary considerably along the southern flow path (Figure 6.20). Except for the second sample along the flow path, samples in the western half of the study area are undersaturated with respect to all three carbonates. Oversaturation occurs in the easternmost two samples. The highest degree of undersaturation occurs east of the Cedar Hills subcrop, suggesting that mixing of waters from the Permian with the Dakota causes undersaturation with respect to carbonates. It appears that, as the ground water moves farther along the flow path, it approaches saturation with respect to the carbonates. This mixing with Permian water and evolution toward carbonate saturation is shown in the relative changes in the concentrations of calcium and alkalinity (which increase as saturation is approached, suggesting dissolution of calcite) and chloride (which also increases east of the Cedar Hills subcrop, suggesting mixing of higher salinity water with Dakota ground water). The ground water then becomes oversaturated with respect to the carbonates as mixing with meteoric recharge occurs or dominates the ground-water composition, as evidenced in the easternmost two samples by lower ionic strength. Authigenic calcite is not uncommon in the Dakota Formation, but it may have resulted from early diagenesis (Franks, 1966).
Figure 6.20. The saturation state with respect to the carbonates along the southern ground-water flow path. Note that waters in the Dakota aquifer become undersaturated (saturation index <0) with respect to the carbonates down-gradient of the Cedar Hills Sandstone subcrop (arrow).
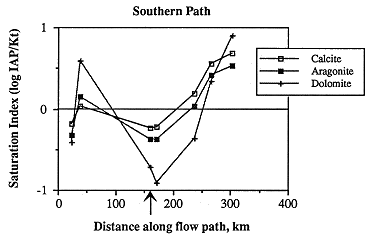
Figure 6.21. Near saturation with respect to chalcedony (saturation index near 0) and slight oversaturation (saturation index >0) with respect to quartz for ground water along the southern flow path.
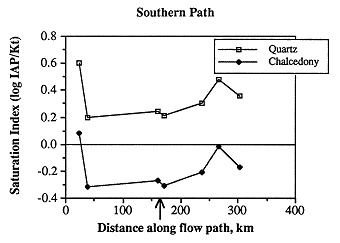
Most of the sampling sites are slightly oversaturated with respect to quartz and undersaturated with respect to chalcedony (Figure 6.21). The phase controlling silica concentrations may be chalcedony, because the samples are more nearly saturated with respect to chalcedony, or the controlling phase may be an aluminosilicate such as a clay mineral. The changes in saturation state along the flow path are somewhat similar to other species in that oversaturation occurs in the westernmost sample and the saturation index decreases until the subcrop of the Permian is encountered, whereupon the saturation index increases. The lack of big change in saturation state in the vicinity of the Cedar Hills subcrop (arrow) suggests that chalcedony or quartz may be precipitating relatively rapidly when deeper/hotter water from the Cedar Hills mixes with the relatively shallow Dakota water. In the easternmost samples in which local meteoric recharge may dominate, the saturation index again decreases.
Because the water samples were not analyzed for aluminum, calculation of the saturation states with respect to the aluminosilicates requires an assumption of saturation with respect to one aluminosilicate. Kaolinite is a common authigenic mineral in shallow aquifers and the most common clay mineral in much of the Dakota Formation (Franks, 1966). The sandstones of the Dakota Formation are dominantly quartz, with less than about 3% detrital feldspar; the feldspar is mostly K-feldspar, with some plagioclase (Franks, 1966). Figure 6.22 shows the result of the calculated saturation state with respect to microcline and albite assuming saturation with respect to kaolinite and calcite. Microcline is everywhere oversaturated and albite undersaturated, but the trends of abrupt change (in this case, decrease in saturation index) east of the Cedar Hills Formation subcrop hold for both aluminosilicates. Whether or not the magnitude of under- or oversaturation is correct cannot be determined until samples are analyzed for aluminum content.
Figure 6.22. Decrease in saturation states with respect to microcline and albite, assuming saturation with respect to kaolinite, downgradient of the subcrop of the Cedar Hills Sandstone (arrow).
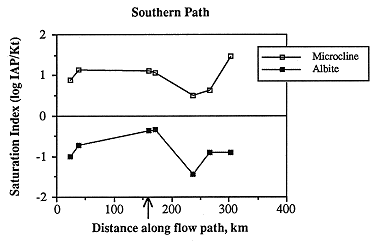
Figure 6.23. Ionic strength of Dakota aquifer waters along the central flow path. Note that the ionic strength is higher when the Dakota and Cedar Hills Sandstone aquifers are hydraulically connected. Western edge of the area is indicated by the arrow.
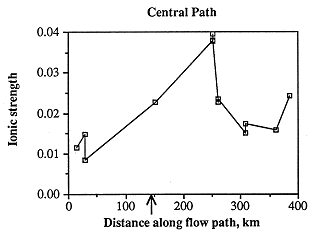
Ionic strength along the central flow path is highest east of the Cedar Hills subcrop, lowest in the westernmost samples, and fairly low in the easternmost samples (Figure 6.23). As with the samples along the southern flow path, ionic strength is not a function of depth below the land surface (Figure 6.24), but is most probably related to discharge from Permian units. The greatest change in chemical composition occurs in those samples about 68 miles east of the Cedar Hills subcrop in which sodium and chloride increase dramatically (Figures 6.25 and 6.26). This increase may occur closer to the Cedar Hills subcrop, but there are no wells between the well just east of the subcrop and the wells over 62 miles east of the subcrop. Sodium and chloride also increase somewhat in the easternmost sample, as does calcium and sulfate. Calcium is present in low concentrations in all but the easternmost samples, while alkalinity is highest in the westernmost sample and fairly constant in concentration along the rest of the flow path. The increase in sodium along the flow path past the subcrop of the Cedar Hills Sandstone suggests leakage of more saline fluid from the Cedar Hills. The highest calcium concentrations are found at the end of the flow path, suggesting dissolution of calcite. The highest chloride content along the flow path is downgradient of the subcrop of the Cedar Hills Sandstone, supporting the hypothesis of leakage of more saline water from the Cedar Hills Sandstone into the Dakota.
Figure 6.24 Ionic strength as related to depth of Dakota aquifer waters along flow path. Down-gradient direction along the ground-water flow path is shown by the arrows. Wells along the flow path are circled. Question mark represents the well for which no depth is reported.
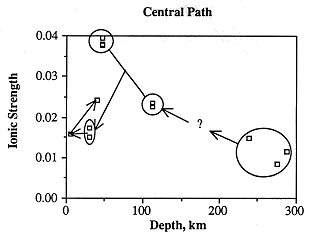
Figure 6.25. Variations in sodium and calcium content along the central ground-water flow path.
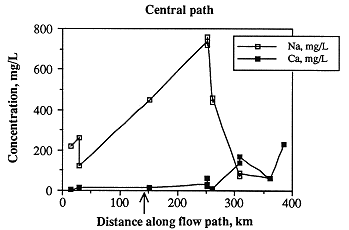
Figure 6.26. Variations in major anionic species along the central ground-water flow path.
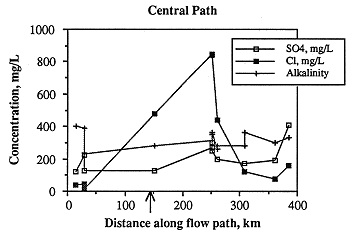
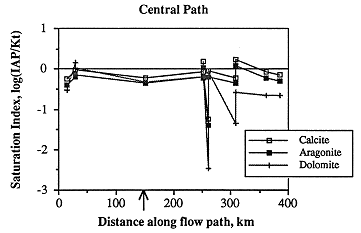
Nearly all the samples in the central flow path are close to saturation with respect to calcite, aragonite and dolomite (Figure 6.27). A single sample, east of the Cedar Hills subcrop, is greatly undersaturated with respect to the carbonates. Although this analysis may be in error, it cannot be excluded based on present criteria.
Figure 6.27. Changes in the saturation state with respect to the carbonates along the central ground-water flow path.
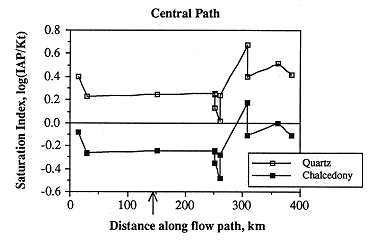
Almost all samples are oversaturated with respect to quartz and undersaturated with respect to chalcedony (Figure 6.28). Most samples are somewhat undersaturated (saturation index <0); but the sample down gradient from the Cedar Hills subcrop is oversaturated. A single sample is highly undersaturated; an explanation for this is not known. Slight perturbations occur east of the Cedar Hills subcrop.
Figure 6.28. Changes in the saturation state with respect to quartz and chalcedony along the central ground-water flow path.
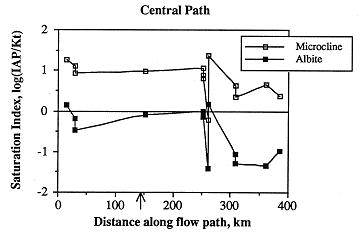
When saturation is imposed with respect to kaolinite and calcite, nearly all samples are oversaturated with respect to microcline and undersaturated with respect to albite (Figure 6.29). Just as for samples along the southern flow path, the interpretation of whether or not these saturation states are accurate requires that aluminum content be measured.
Figure 6.29. Changes in the saturation states with respect to microcline and albite, assuming saturation with respect to kaolinite along the central ground-water flow path. The arrow indicates the western edge of the area where the Dakota and Cedar Hills sandstone aquifers are hydraulically connected.
In most studies of large aquifers or aquifer systems, the regional flow field, as interpreted from measurements of total head in various positions in the region, provides a basis for understanding the chemical signature of ground water in the aquifer. A map of the potential for fluid flow typically represents actual flow in an aquifer and the chemistry of water which moves through the aquifer results from a predictable sequence of chemical reactions involving minerals in the aquifer and the water. In the case of the Dakota aquifer, the chemical signature of water in the Dakota does not "evolve" in the sequence usually observed, that sequence including change from bicarbonate to sulfate- and chloride-rich, nor does the ionic strength increase along the flow path as is typical. These observations point to the hypothesis that regional flow may not be important in the Dakota, and that local systems dominate the recharge of the aquifer. This in turn suggests that the vulnerability of the aquifer to land-sourced contamination is high, but that any introduced contaminant may travel only relatively short distances and would probably not affect the aquifer very far down the regional hydraulic gradient. Alternate hypotheses to this "local recharge" hypothesis are discussed later.
Subsurface discharge of fluids from the Cedar Hills Sandstone is evidenced by an abrupt increase in ionic strength in the Dakota near the subcrop as well as a change in the dominant ions in the water. Based mostly on ratios and concentrations of bromide and chloride (Whittemore, 1988), as well as isotopes, Macfarlane, Townsend, Whittemore, et al. (1988) concluded that Dakota water in seven counties in the north-central part of the Dakota aquifer in Kansas are a mixture of meteoric water with water derived from solution of Permian halite, rather than with altered seawater and/or oil-field brines. The oil-field brines were collected from Barton and Ellis counties and show considerable variation in water chemistry, although they cluster fairly tightly on a plot of bromide/chloride versus chloride concentration. Isotopic data are discussed in the following geochemical section. The question of sources of water in the Dakota is being further examined in ongoing research.
The discharge from the Permian rocks results in changes not only in the ionic strength of the fluids, but also in the saturation state of the carbonates and silica polymorphs. Because the saturation state with respect to the carbonates decreases, porosity (and presumably, hydraulic conductivity) is probably being enhanced where "resident" Dakota water mixes with Permian discharge water. On the other hand, the saturation state with respect to quartz and chalcedony appears to change little near the subcrop of the Cedar Hills. Because fluids from the Cedar Hills have a deeper origin, the dissolved silica or silicic acid (H4SiO4) content is probably higher than in shallow waters (quartz and chalcedony solubilities increase with increase temperature and thus with increasing depth). The fact that the saturation state changes little may suggest that silica cement is precipitating readily within the zone of mixing, which may decrease porosity and hydraulic conductivity of the Dakota. The magnitude of increase or decrease in hydraulic conductivity cannot be assessed without further study.
Finally, two other hypotheses may be invoked to explain the distribution of salinities in the Dakota aquifer. The first of these requires a paleo-flow regime which is different from today. The present-day potentiometric surface in the Dakota aquifer indicates regional flow from western and southwestern Kansas northeastward toward the outcrop of the Dakota (this report). The High Plains region of Kansas was tilted slightly to the northwest prior to the Miocene (Merriam, 1963), implying that the flow regime of present is not necessarily that of the relatively recent geologic past (Macfarlane, 1989). The distribution of water types within the Dakota (Keene and Bayne, 1977) suggests that the ground-water flow which established the distribution of water types was more northerly than easterly. Thus, if, at some time in the past, a long-lived regional flow system in the Dakota moved water from south or southwest Kansas to the north and the chemical evolution of the water was well established, then the distribution of water types observed today could reflect this "fossil" ground-water-flow system. The present regional flow system may be overprinting a fossil system, resulting in the present, unusual distribution of water types along the ground-water-flow paths. This hypothesis does not preclude leakage of water from Permian strata into the Dakota, but only affects the interpretation of the dominance of local or regional flow systems on ground-water quality.
A second alternate hypothesis to the explanation that local flow regimes exclusively affect water chemistry in the Dakota is that of "connate" formation water being flushed from the aquifer at variable rates. A fluid preserved from original deposition of the Dakota would resemble sea water which has been somewhat altered by sulfate reduction and calcium-magnesium exchange. If hydraulic conductivity variations in the Dakota are significant (Macfarlane et al., 1988) and if the aquifer is not flushed evenly by meteoric water, then parts of the aquifer which are more stagnant (less flushed) would contain fluids more heavily influenced by the "connate" fluid. Supporting information for this hypothesis would be documentation that the northern and western parts of the aquifer have lower hydraulic conductivities than the southern and eastern parts. Other corroborating evidence would be theoretical modelling of mixtures of the "connate" fluid with meteoric fluids, which has not been attempted. However, geochemical identification of salinity sources in the central Kansas portion of the Dakota aquifer (Macfarlane et al, 1988) shows that only a few percent of "sea water" like fluid is left in that area.
Isotope Geochemistry of Dakota Ground Waters in Central Kansas
The use of isotopes in hydrologic studies is based on the premise that the relative mass abundance of light to heavy isotopes is large and that the occurrence of some natural process modifies the relative abundance of an element's isotopes in a system (Turan, 1982). Measurement of absolute isotope abundance is difficult; therefore, relative isotopic ratios are measured. The common method is to compare the abundance of the natural isotope with a standard. For example, 18O/16O of a sample is compared to the 18O/16O of SMOW (Standard Mean Ocean Water as established by the International Atomic Energy Agency). The relative abundance is represented by the formula:
![]() 18O = (Rsample/Rstandard-1) x 1000
18O = (Rsample/Rstandard-1) x 1000
Each isotope such as deuterium (2H or D) and sulfur-34 (34S) is defined similarly. The only difference is the standard to which each is compared. 18O and D are compared to SMOW. 34S is compared to the Canyon Diablo meteoric (Nielson, 1979).
Fractionation by chemical and physical reactions is the process by which isotopes are separated and concentrated. Physical fractionation processes include diffusion, evaporation, condensation, freezing or melting. A phase change such as the condensation of rain separates isotopes by physical fractionation (Faure, 1977; Turan, 1982). Chemical fractionation occurs due to the different bond energies of light and heavy isotopes. Heavier isotopes concentrate in chemical compounds with the strongest chemical bonds. The strength of the chemical bonds is a function of vibrational frequency and relative velocity of the molecules. Lighter molecules have higher vibrational frequencies, and therefore the bonds between molecules are easier to break. The heavier isotopes have lower vibrational frequencies (i.e. stronger bonding tendencies) and therefore concentrate in resulting products (Bigeleison, 1965; Turan, 1982).
Twenty-five samples were collected from 1987 to 1989 for determination of 18O, D and 34S. The isotope values and designation letters are listed in Table 6.4. These isotopes were chosen for study because of their usefulness in determining the mixing of waters, cross-formational flow, and invasion of saltwater into other formations. Examining the 18O and D data from each set of monitoring wells indicates that the isotope values for each unit are consistent over time. The Cedar Hills well at Gorham (D6) shows two distinctly different values for the 18O and D isotopes indicating that the samples from this well may not be indicative of formation water or that brine-disposal activities in the area may have caused a change in the water chemistry. The isotope values plus the general chemistry for the monitoring wells suggests that in most cases the water sampled was formation water and is indicative of the actual chemistry of the aquifer. The 34S isotopes are anomalous in that very few of the samples show consistent values over time. This variation may be due to biological activity in the well or the aquifer or to slight changes in the inorganic chemistry.
Variation in the isotopic composition of oxygen and hydrogen is due to a
variety of causes such as evaporation processes, mixing of waters of
different origins, cross-formational flow processes or recharge from
meteoric water. ![]() 18O and D values are frequently plotted together
and interpreted in comparison to the meteoric water line as developed by
Craig (1961). The line defined by the equation
18O and D values are frequently plotted together
and interpreted in comparison to the meteoric water line as developed by
Craig (1961). The line defined by the equation
![]() D = 8 x
(
D = 8 x
(![]() 18O) + 10
18O) + 10
is based on precipitation data collected on a worldwide basis. This
line is shown in Figure 6.30 as a reference for the data collected in
this study. The D and 18O content in precipitation from any
locality will plot on this line. The D and 18O values for
precipitation from Manhattan, Kansas (![]() D= - 53,
D= - 53, ![]() 18O = - 7.5, Chadhuri, personal communication,
1988) are shown in Figure 6.30 for reference.
18O = - 7.5, Chadhuri, personal communication,
1988) are shown in Figure 6.30 for reference.
Table 6.4. Summary of isotope data collected for Dakota Program.
| Site | Location | Rock Unit | 18O (per mil) |
D (per mil) |
34S (per mil) |
Sulfate (per mil) |
Label | Date Sampled |
|---|---|---|---|---|---|---|---|---|
| 9 | 19S 13W 12BBD | Barton Co., U. Dak. | -8.0 | -58 | -2.6 | 80.00 | A1 | 1987 |
| 9 | 19S 13W 12 DBD | Barton Co., U. Dak | -7.6 | -56 | -4.5 | 35.00 | A1 | 1987 |
| 51 | 12S 18W 30AAA | Hays, Cedar Hills | -8.7 | -62 | 12.1 | 4606.00 | D2 | 1987 |
| 51 | 12S 18W 30AAA | Hayes, Cheyenne | -8.0 | -57 | 11.8 | 4110.00 | C2 | 1987 |
| 51 | 12S 18W 30AAA | Hayes, L. Dakota | -8.4 | -57 | 11.7 | 3345.00 | B2 | 1987 |
| 51 | 12S 18W 30AAA | Hayes, U. Dakota | -8.9 | -65 | * | 39084.00 | A2 | 1987 |
| 51 | 12S 18W 30AAA | Hayes, U. Dakota | -8.7 | -63 | 6.2 | 3568.00 | A2 | 1988 |
| 51 | 12S 18W 30AAA | Hayes, U. Dakota | -8.7 | -63 | 6.2 | 3447.00 | A2 | 1989 |
| 65 | 08S 23W 02CDB | Hill City, U.. Dakota | -11.4 | -78 | 13.8 | 244.00 | A3 | 1988 |
| 65 | 08S 23W 02CDB | Hill City, U.. Dakota | -11.6 | -84 | 18.6 | 254.00 | A3 | 1989 |
| 65 | 08S 23W 02CDB | Hill City, L.. Dakota | -11.4 | -84 | 6.6 | 2190.00 | B3 | 1988 |
| 65 | 08S 23W 02CDB | Hill City, L.. Dakota | -11.4 | -88 | 4.7 | 2246.00 | B3 | 1989 |
| 65 | 07S 25W 21DCD | Graham Co., L. Dak. | -12.1 | -89 | * | 151.00 | B4 | 1988 |
| 65 | 07S 25W 21DCD | Graham Co., L. Dak. | 12.1 | -91 | -6.2 | 149.00 | B4 | 1989 |
| 185 | 25S 12W 11AAAD | Cedar Hills GMD5 | -8.9 | -68 | 11.5 | 6500.00 | D5 | 1987 |
| 185 | 25S 12W 11AAAD | Cedar Hills GMD5 | -6.3 | -44 | 8.1 | 45.00 | D5 | 1987 |
| 167 | 13S 15W 32BCB | Gorham, U. Dakota | -10.7 | -80 | 4.8 | 384.00 | A6 | 1987 |
| 167 | 13S 15W 32BCB | Gorham, U. Dakota | -11.2 | -82 | * | 384.00 | A6 | 1988 |
| 167 | 13S 15W 32BCB | Gorham, U. Dakota | -11.2 | -82 | -1.0 | 345.00 | A6 | 1989 |
| 167 | 13S 15W 32BCB | Gorham, Cheyenne | -10.0 | -73 | 3.6 | 1598.00 | C6 | 1987 |
| 167 | 13S 15W 32BCB | Gorham, Cheyenne | -9.8 | -71 | 5.8 | 4651.00 | C6 | 1989 |
| 167 | 13S 15W 32BCB | Gorham, Cedar Hills | -11.0 | -82 | 12.9 | 1334.00 | D6 | 1987 |
| 167 | 13S 15W 32BCB | Gorham, Cedar Hills | -12.3 | -95 | 17.5 | 1937.00 | D6 | 1989 |
| 167 | 12S 15W 14ADA | Russell Co., U. Dakota | -11.2 | -80 | 6.9 | 1963.00 | A7 | 1988 |
| 167 | 12S 15W 14ADA | Russell Co., L. Dakota | -11.0 | -74 | 7.3 | 2022.00 | A7 | 1988 |
The data collected in this study shows a parallel best fit line within the meteoric envelope as described by Craig (1961) and Epstein et al. (1965, 1970). The line is defined as
![]() D = 7.75 x
(
D = 7.75 x
(![]() 18O) + 4.67
18O) + 4.67
Figure 6.30. Oxygen-18 and Deuterium content for Dakota and underlying units at monitoring sites. Labels are in Table 14.2
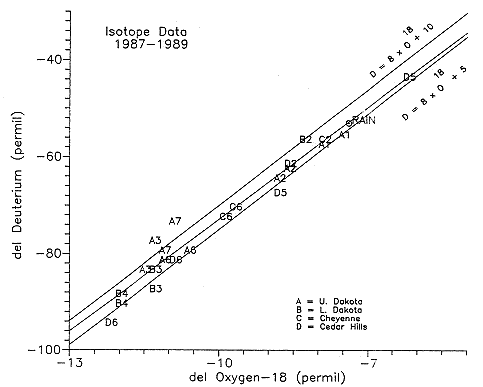
The samples evaluated in this phase of the Dakota study are either from
the Dakota aquifer or underlying units from the multiple piezometer
sites. Also included are two samples from the Cedar Hills in
Groundwater Management District #5 for comparison purposes. The scatter
on the ![]() 18O-
18O-![]() D diagram (Figure 6.30) suggests
that lateral mixing is not occurring between water types but is
occurring vertically at some test sites. The 18O and D
isotopes indicate that the waters from the Hays North site (A2, B2, C2,
D2) are similar to each other. Samples A6, C6 and D6 from the Gorham
site are also similar to each other. These isotopes also emphasize the
difference in water chemistry between these two sites.
D diagram (Figure 6.30) suggests
that lateral mixing is not occurring between water types but is
occurring vertically at some test sites. The 18O and D
isotopes indicate that the waters from the Hays North site (A2, B2, C2,
D2) are similar to each other. Samples A6, C6 and D6 from the Gorham
site are also similar to each other. These isotopes also emphasize the
difference in water chemistry between these two sites.
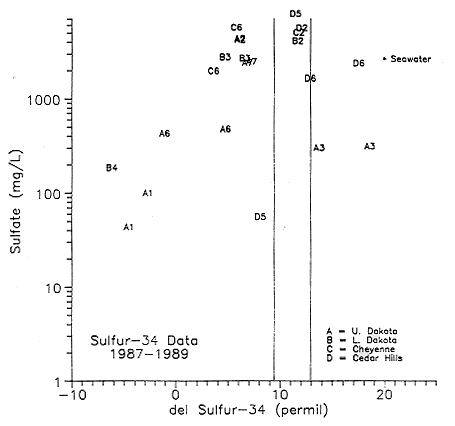
Sulfur isotope data for the samples collected are represented in a graph
of ![]() 34S versus
sulfate concentrations (Figure 6.31). The letters representing the
various samples are listed in Table 6.4. The parallel lines in the
figure represent the limits of Permian evaporites from around the world
as listed by Thode and Monster (1965). The range of
34S versus
sulfate concentrations (Figure 6.31). The letters representing the
various samples are listed in Table 6.4. The parallel lines in the
figure represent the limits of Permian evaporites from around the world
as listed by Thode and Monster (1965). The range of ![]() 34S in Permian rocks
is from +9.3 to +13.0. The samples collected at the Hays North site in
Ellis county (points B2, C2, D2) all fall within the range of Permian
evaporites. The Permian water samples from Stafford and Reno counties
(D5) also fall within the range of Permian evaporites. The samples from
the Gorham multiple-completion monitoring well in Russell county (A6,
C6, D6) vary somewhat. Point D6 is water from the Cedar Hills Sandstone
and falls within the Permian value range. The other Cedar Hills point
(D6) falls in the more positive range of the graph (+17.5) indicating
either bacterial reduction of the sulfate or mixing with waters already
enriched in 34S. Points A6 and C6 are samples from the upper
and lower Dakota aquifer, respectively. Both of these values are in the
+3.0 to +5.0 range. These values and those to the left of the Permian
evaporite limits suggest the possibility of oxidation processes.
34S in Permian rocks
is from +9.3 to +13.0. The samples collected at the Hays North site in
Ellis county (points B2, C2, D2) all fall within the range of Permian
evaporites. The Permian water samples from Stafford and Reno counties
(D5) also fall within the range of Permian evaporites. The samples from
the Gorham multiple-completion monitoring well in Russell county (A6,
C6, D6) vary somewhat. Point D6 is water from the Cedar Hills Sandstone
and falls within the Permian value range. The other Cedar Hills point
(D6) falls in the more positive range of the graph (+17.5) indicating
either bacterial reduction of the sulfate or mixing with waters already
enriched in 34S. Points A6 and C6 are samples from the upper
and lower Dakota aquifer, respectively. Both of these values are in the
+3.0 to +5.0 range. These values and those to the left of the Permian
evaporite limits suggest the possibility of oxidation processes.
Disseminated sulfide minerals or organic sulfur may be the source of the
lower concentration of 34S in the various ground waters.
Kinetic fractionation during sulfide oxidation by bacteria results in
sulfate that is depleted in 34S (Pearson and Rightmire,
1980). In surface waters there is a tendency for sulfate derived from
evaporite sources to be enriched in 34S while sulfate derived
from the oxidation of organic sulfur or sulfide minerals will be
depleted in 34S. Ground waters may be reducing enough so
that sulfide is the dominant ionic species. Fractionation between
coexisting sulfate and sulfide in reducing environments in ground waters
may result in values below the evaporite limit frequently seen in
surface waters (![]() 34S = +10 or greater)(Pearson and Rightmire, 1980; Thode and
Monster, 1965). Several of the waters collected for this study
contained noticeable H2S smell both during collection and
analysis. The occurrence of lignites and organic layers in the Dakota
aquifer suggests the presence of disseminated sulfide minerals such as
pyrite in the sediments. The minerals may be a source of sulfide that
could be oxidized by oxygen-rich ground water or sulfide-oxidizing
bacteria resulting in an overall decrease of the 34S content.
34S = +10 or greater)(Pearson and Rightmire, 1980; Thode and
Monster, 1965). Several of the waters collected for this study
contained noticeable H2S smell both during collection and
analysis. The occurrence of lignites and organic layers in the Dakota
aquifer suggests the presence of disseminated sulfide minerals such as
pyrite in the sediments. The minerals may be a source of sulfide that
could be oxidized by oxygen-rich ground water or sulfide-oxidizing
bacteria resulting in an overall decrease of the 34S content.
Figure 6.31. Log of the SO4 (mg/L) concentration vs. del 34S.
Tritium (3H) is a radioactive environmental isotope that is frequently used for determination of recharge rates of precipitation to the ground-water table. The half-life of tritium is between 12.26 and 12.43 years (Dicer and Davis, 1968; Ferronsky and Polyakov, 1982). Tritium is produced in the atmosphere by the interaction of nitrogen with cosmic rays (Craig and Lal, 1961). Tritium has also been added to the atmosphere by the explosion of nuclear devices in the atmosphere from 1953/1954 to the mid 1960's (Faure, 1977). Because of the increased volume of tritium in the atmosphere, tritium is a good tracer for determining recharge that occurred after the early 1950's. Tritium combines rapidly into water molecules and is removed from the atmosphere by precipitation. Background levels, depending upon location, range between 5 and 20 T.U. (tritium units)(Larson et.al., 1987). Tritium is measured in tritium units where 1 T.U. equals 1 tritium atom per 1018 atoms of hydrogen (Faure, 1977).
Because most of the water samples collected for 18O and D isotopes plotted near the meteoric water line (Figure 6.30), it was concluded that the primary source of the water was from precipitation and had not been modified significantly by water-rock interactions, at least in terms of the isotopic signatures. The water quality at the Hill City upper Dakota well, the Graham County water supply well (lower Dakota) and the Gorham upper Dakota well were fresher in water quality than other units at those sites. These three wells were sampled for tritium to determine if there was recent recharge along any of the fracture zones that occurred at least in the Hill City and Graham County areas. The measured tritium values are as follows:
| Hill City upper Dakota | 2.6 T.U. +/- 0.6 |
| Graham Co. lower Dakota | < 0.8 T.U. +/- 0.6 |
| Gorham Co. upper Dakota | 2.2 T.U. +/- 0.6. |
These values are much lower than the range of background levels (5 to 20 T.U.) cited by Larson et al. (1987). These numbers indicate that at these sites no traceable recharge that can be attributed to the 1950-1960's testing has yet reached the water in these units. This would suggest that either the fractures noted on the maps are not deep enough to permit recharge to these units or that the fractures are mineralized and do not permit the passage of water.
Preliminary Assessment of Water-Quality of the Dakota Aquifer
An assessment of the quality of water in the Dakota aquifer was made using information in the ground-water-quality data base (KWATCHEM) developed using the INFO relational data-base-management system. Samples from the Kiowa Formation and Cheyenne sandstone (lower Dakota aquifer) were included; thus the assessment is for sources of water in all of the Dakota aquifer. Criteria for the assessment are based on ground-water classification and on drinking-water standards. The data processed for the assessment did not include the partial chemical analyses of irrigation well waters collected during the irrigation efficiency study for the Dakota Program because these data were added just after the assessment was made.
Definitions of fresh, usable, and mineralized waters are used by the State of Kansas for classifying ground waters (KDHE, 1986). Fresh ground water (Class I) contains not more than 500 mg/L chloride or 1000 mg/L of total-dissolved solids (TDS). Useable ground water (Class II) has a chloride concentration of >500 mg/L and <5000 mg/L, and a total-dissolved solids content of >1000 mg/L and <10,000 mg/L. Mineralized ground water contains >5000 mg/L chloride and >10,000 mg/L total-dissolved solids.
The ground-water classes based on the 500 and 5000 mg/L divisions of chloride concentrations are displayed graphically in the map of the western part of Kansas in Figure 6.2 and in Plate 2. Figure 6.4 is a similar map containing the distribution of total-dissolved-solids contents that includes contours for the classification values of 1000 and 10,000 mg/L.
A quality assessment of the Dakota aquifer water is summarized in Table 6.5 for the different inorganic chemical constituents for which the Kansas Department of Health and Environment (1988) uses primary or secondary drinking-water standards or, in the absence of a promulgated standard, a suggested upper limit for drinking water. All reported forms of the constituent concentration, whether dissolved or total, field or laboratory, were used. The assessment includes both the number and percentage of samples and of sites exceeding the standard or suggested limit. The number of sites is less than the number of samples because there are samples collected on different dates for many sites. A site with multiple samples was listed as exceeding a limit if at least one of the sample waters exceeded the value. The minimum and maximum values and the mean, median, and standard deviation are included for characterization of the data. If a concentration was less than a detection limit for a constituent, half of the limit was used in computation of the mean.
Over half of the total samples and different well sites exceeded the secondary standard for iron, while nearly half of the samples and sites were over the limit for manganese. None of the samples in the data base exceeded the standard for the heavy metals cadmium, chromium, copper, lead, silver and zinc, and the alkaline earth element barium. No samples contained arsenic above the drinking-water standard, but five samples from four sites had selenium above the standard. In addition, two samples from two sites had mercury greater than the drinking standard.
Approximately 7% of the samples contained nitrate levels greater than the standard, while over half of the samples representing nearly all of the sites for which ammonia had been determined exceeded the limit. However, the limit for ammonia is only suggested and is much lower than for nitrate. Only a few samples exceeded the suggested limit for phosphorous. Nearly 30% of the samples and over 34% of the well sites contained fluoride concentrations over the standard. High fluoride waters are characteristic in certain areas of the Dakota aquifer, especially where sodium and bicarbonate are the cation and anion, respectively, with the highest concentration of the major constituents.
About a half of the samples contained more than the recommended concentrations of total-dissolved solids. Therefore, a substantial fraction, although less than half, of the major constituents also exceeded the respective recommended standards. The percentages ranged from less than 10% for calcium and magnesium, to about 25% for alkalinity, hardness, chloride and sulfate, to nearly 50% for sodium. Fewer than 2% of the samples had more than the suggested limit for potassium.
None of the waters in the data based included radioactivity determination. Several public water supplies are drawn from wells in the Dakota aquifer, however. Data for these sites include some radiochemical measurements and are in paper and computer files of the Kansas Department of Health and Environment. This data will be added to the KWATCHEM system and processed during future quality assessments.