Kansas Geological Survey, Current Research in Earth Sciences, Bulletin 241, part 3
Prev Page--GPR Data and Interpretations at the Study Sites || Next Page--Plattsburg Limestone
![]()
![]()
![]()
Kansas Geological Survey, Current Research in Earth Sciences, Bulletin 241, part 3
Prev Page--GPR Data and Interpretations at the Study Sites ||
Next Page--Plattsburg Limestone
![]()
A map of the study site is shown in fig. 4. Figures 5 and 6 show uninterpreted and interpreted photomosaics and GPR data. The top of the roadcut where the GPR profiles were gathered has a rough, rocky terrain on either end and a thick overburden in the middle. The overburden thickness ranges from 0 to 1 m (3.3 ft), consists of a fine, silty soil (with approximately 45% clay, 40% silt, and 15% sand), and contains small fragments of chert and limestone. The clay-rich soil cover attenuated the signal greatly, resulting in no discernible reflection energy between stations 50 and 150. The thickening soil as observed on the outcrop (fig. 5) also caused a velocity pull-down in the reflection of up to 5 ns between stations 40 and 190 due to the change in velocity between the slower clay-rich overburden and the faster limestone (fig. 6). Minor variations in soil thickness, velocity, and topography resulted in short-period static shifts of 1 to 2 ns on GPR profiles. Some of this shifting may also have been due to intersecting hyperbolic diffractions from open or soil-filled fractures near the surface or to irregularities in bedding surfaces within the limestone. Changes in relative elevation did not appear to have any effect on limestone velocity. No out-of-plane reflections from the outcrop face were readily identifiable because profiles were taken far enough back from the outcrop face (approximately 1 m; 3.3 ft).
Fig. 4--Map of the Captain Creek Limestone Member study site
Fig. 5A--Uninterpreted photomosaic of the Captain Creek study site. For enlarged view, click on section of image.
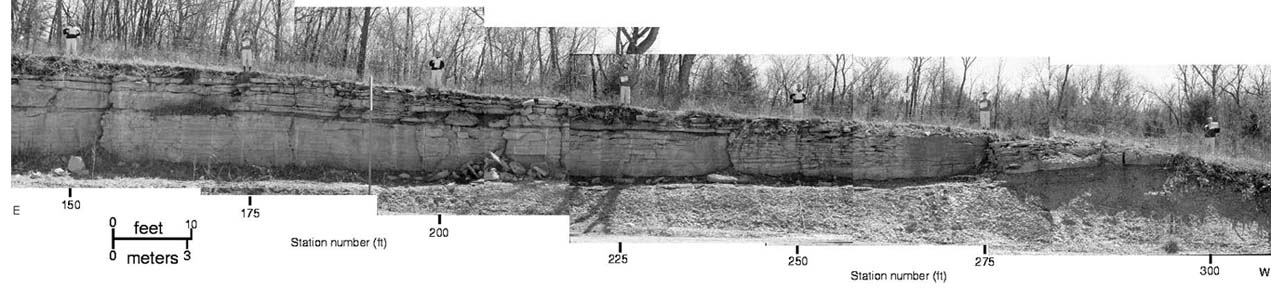
Fig. 5B--Uninterpreted photomosaic of the Captain Creek study site. Reflections seen on both GPR data and the outcrop are indicated by dashed lines. UC1, LC1, and VS1 refer to the upper Captain Creek Limestone Member, the lower Captain Creek Limestone Member, and the Vilas Shale, respectively. For enlarged view, click on section of image.
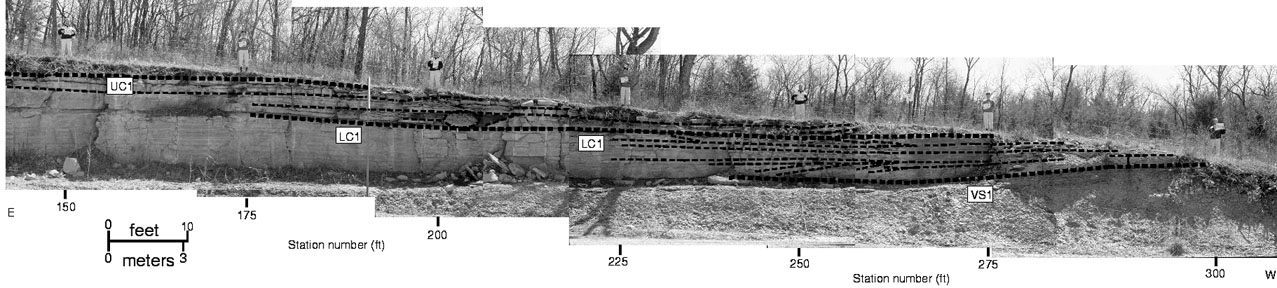
Fig. 6A--Uninterpreted GPR profiles from the Captain Creek study site. For enlarged view, click on section of image.
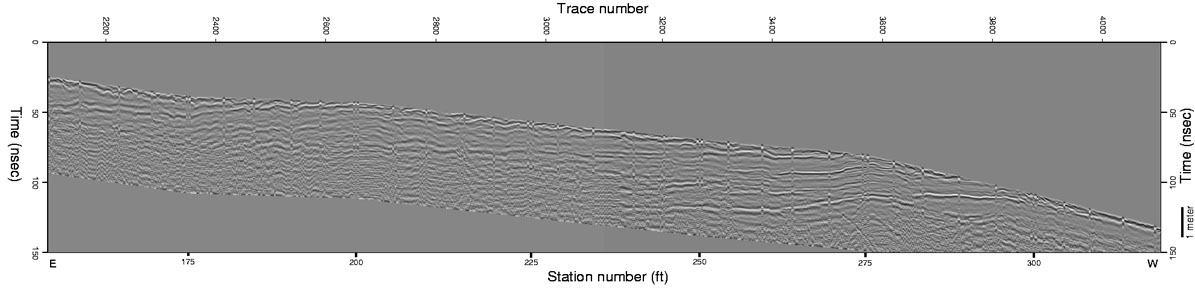
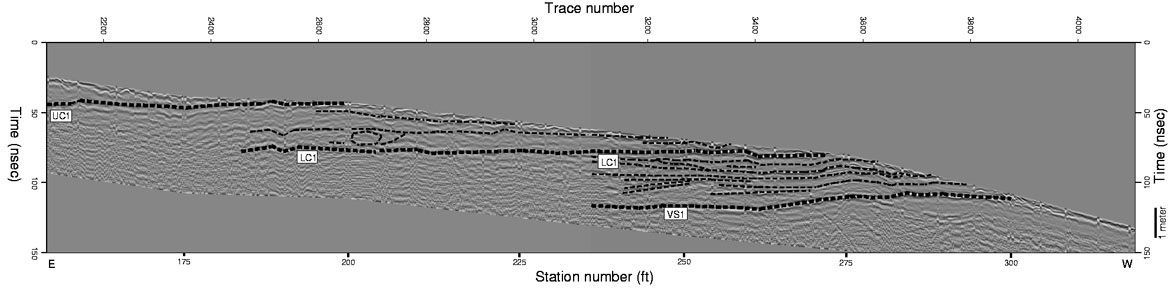
Fig. 6B--Interpreted GPR profiles from the Captain Creek study site. Reflections seen on both the GPR data and the outcrop are indicated by dashed lines. The GPR data have a vertical scale of two-way time in nanoseconds and a trace spacing of approximately 3 cm. UC1, LC1, and VS1 refer to the upper Captain Creek Limestone Member, the lower Captain Creek Limestone Member, and the Vilas Shale, respectively. For enlarged view, click on section of image.
Relatively high amplitude reflections, which correlated with major outcrop stratigraphic divisions, are indicated by heavy dashed lines on figs. 5 and 6. The correlations were performed by comparing the outcrop photomosaics (and the outcrops themselves) with the GPR reflections. The major stratigraphic divisions were interpreted as the top of the upper Captain Creek submember (UC1), the top of the lower Captain Creek submember (LC1), and the top of the Vilas Shale (VS1). Reflections correlated with outcrop features between major unit divisions are identified by thin dashed lines.
Upper Captain Creek Limestone Submember (UC1)--The top of the upper Captain Creek submember (UC1) was indicated by a prominent reflection between stations 155 and 200 (fig. 6). Material above this reflector is primarily soil, which may have been created from the overlying Eudora Shale. On the outcrop the limestone layer does not sag (it is relatively horizontal), but on the GPR data there was a definite increase in the travel-time to the interpreted reflections from the limestone events. This is evidence that the observed velocity pull-downs were caused by thickening soil. Additionally, only when fractures were soil filled did they cause a velocity pull-down.
Soil-filled fractures near the top of the limestone caused weak diffractions and the interruption of continuity in the reflection near stations 185 and 190. Other evidence of fracturing included a velocity pull-down of reflections at station 190 and dipping events in the lower half of the submember between stations 195 and 210 adjacent to an isolated block between stations 200 and 205 (fig. 6). This may also be the cause of a prominent diffraction near the surface in the upper Captain Creek Limestone Member between stations 210 and 215. Several horizontal to low-angle dipping limestone layers in the upper Captain Creek submember are clearly visible and laterally traceable until they intersect the modern erosional surface between stations 190 and 250 (fig. 6).
Lower Captain Creek Limestone (LC1)--The contact between the lower and upper Captain Creek submembers (LC1), a 0.25-m (0.82-ft)-thick sandy shale, is visible between stations 180 and 275 (figs. 5 and 6). Internal bedding geometries within the lower Captain Creek were also imaged by GPR (fig. 6). Local convergent and divergent bedding geometries, and some truncations of beds likely associated with crossbedding at the base of the upper Captain Creek, were imaged between stations 240 and 285. Crossbed foresets were imaged by GPR in the lower half of the lower Captain Creek between stations 240 and 255. These crossbeds appeared to terminate against a relatively flat-lying bed above (fig. 6). Bed thinning is apparent on the outcrop west of station 270 and was visible on the GPR data as a decrease in time between reflections or a termination of reflections.
Vilas Shale (VS1)--The contact of the Captain Creek and Vilas Shale (VS1) was visible on the GPR data between stations 235 and 300 (figs. 5 and 6). The strength of this reflection was probably due to the large dielectric-constant contrast between limestone and shale. This contact was not imaged by GPR east of station 240 because of signal attenuation caused by increasing soil thickness on the top of the outcrop. Truncation of some beds within the Vilas Shale that are visible on the outcrop was not clearly imaged by GPR, probably because of its attenuating nature. As with the lower Captain Creek Limestone Member above it, the Vilas Shale appears to be slightly upwarped west of station 265 (fig. 5). However, the reflection associated with the top of the shale was subject to the same velocity effects as the overlying limestone, which may add to some of the apparent warping on the GPR data. Some evidence for true structural disruption of the shale came from a diffraction emanating from the contact between the Vilas Shale and the overlying lower Captain Creek Limestone Member near station 270 (fig. 6). This diffraction may have been due to a fracture or small fault responsible for the northward offset in the outcrop face near this station (fig. 5).
Prev Page--GPR Data and Interpretations at the Study Sites || Next Page--Plattsburg Limestone
Kansas Geological Survey
Web version September 15 1998
http://www.kgs.ku.edu/Current/1998/martinez/martinez5.html
Comments to webadmin@kgs.ku.edu