


Petroleum: a primer for Kansas, Page 8 of 15
Prev Page--Subsurface geology ||
Next Page--Petroleum geology of Kansas
Maps
Subsurface geologic maps are used extensively to determine the distribution of rock layers, their thickness variations, and their attitudes (structure).
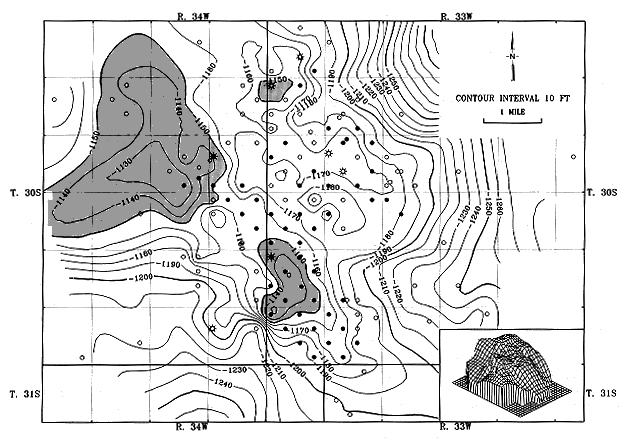
The elevation at the top of each bed is determined by subtracting the depth of the layer in the hole from the elevation at the surface of the hole. A value is calculated and plotted on a map along with similar values from all other holes drilled in the area of interest. The elevation values are contoured, much the way surface elevations are contoured on a topographic map, and the resulting 11 structural contour map" of a specific layer of rock results. In this way anticlines, synclines, and faults may be located and their size and orientations determined (fig. 10).
Figure 10--A structural contour map, such as this map on rocks at the top of the Lansing Group in the Victory field in Kansas, show the structure (variations in elevation on a rock layer relative to sea level) with contours, much like a topographic map. Petroleum rises to the highest occurrences of a rock layer, thus a structural contour map is a tool in locating oil and gas fields. Solid circles represent oil wells, barbed circles are gas wells, and open circles are dry holes.
Thickness ("isopach") maps are made by subtracting the depth in a hole of the top of a rock layer from the depth of the base of the layer (fig. 11). The value is again plotted on a map along with thickness calculations of the particular layer from all other wells in the area, and the data are contoured. The resulting thickness map displays trends of thickening and thinning of each layer and, thus, indicates the locations of possible stratigraphic traps.
Figure 11--Isopach maps, such as this one of the same rock layer in the Lansing Group mapped in fig. 10, show thickness of the rock containing petroleum by contours that connect points of equal thickness. The thicker area of the rock unit are shaded, and the unit thins noticeably over the crest of the structure. Fig. 2D illustrates the porosity in this unit.

There are as many kinds of subsurface stratigraphic maps as there are conditions to map. "Facies maps" show the distribution of rock types within a specific rock layer, as well as potential stratigraphic traps. "Paleogeologic maps" or "subcrop maps" show the areal distribution of rock layers exposed at ancient erosional surfaces (unconformities), now buried by younger rocks. These maps show where the old structures were located at the time of the erosional surface and where to look for eroded edges of the various formations, as they may form traps for petroleum. Almost any geologic situation can be studied and displayed with maps. Of course, the data are stored, sorted, calculated, retrieved, and the maps plotted and contoured with the aid of computers. But the subsurface geologist must interpret the maps to decide where to drill next for the ever-elusive petroleum.
Prev Page--Subsurface geology ||
Next Page--Petroleum geology of Kansas
Kansas Geological Survey, Education
Placed online April 2001
Comments to webadmin@kgs.ku.edu
The URL for this page is HTTP://www.kgs.ku.edu/Publications/Oil/primer08.html