![]()
Prev Page--Chemical Properties || Next Page--Mine Directory
Curves and Diagrams Showing Relative Value of Kansas Coals
The curves shown by Plates LII and LIII have been constructed from the highest average percents of fixed carbon and calorific power of coals, found by analysis, in the localities given below. Curves No. 1 have been platted by means of the two quantities, distance and percent of fixed carbon and calorific power (the number of pounds of water which can be evaporated by one pound of coal), found in Kansas coals, the starting point being Columbus on the south, and the distances. being laid off in miles to the north. Curves No. 2 are platted in like manner except that the distances are laid off from the east to the west, with Pittsburg as the starting point on the east.
The platting is accomplished as follows: In curves No. 1, starting with no miles, that is, with a certain point on the south, the exact positions of towns or mining camps is located in miles. to the north. The value of the coals mined at these localities, as determined by analysis, determines the position of the point to the right or left of the initial position or starting point. Curves No. 2 are platted in the same way, except that the points representing the localities from which coal has been taken for analysis, extend to the west of the initial or starting point. As will be seen in Plates LII and LIII, on the left hand side are found curves No. 1, extending from the south to the north, while on the right hand side are found curves No. 2, extending from the east to the west, both curves being put upon the same plat for convenience.
Curve No. 1. Plate LII.
In No. 1 it is seen that the value of the coal remains quite constant for the first ten miles, then decreases in value fully 6 percent in the next few miles, this decrease taking place in the southern part of Crawford county, at Cherokee. From .this sudden drop of 6 percent it as quickly makes a rise of nearly 8 percent, which rise occurs at Fleming. For the succeeding twenty miles the increase and decrease remain very nearly constant. From a point approximately thirty-five miles north of Columbus to another point in the neighborhood of one hundred miles north the decrease is at a nearly constant rate of 3/10 percent to the mile. From this point—.375 percent—it rises abruptly to 43 percent at an increase in distance of only twelve miles, or 5/10 percent to the mile. From the 115 mile mark it decreases a trifle over 8/100 of one percent per mile in passing a distance of thirty-five miles, 6/10 percent per mile being the rate of decrease from the 150 mile mark to Cloud county—the most western point of which we have any record. Curve No. 1 was constructed from the average percent of fixed carbon found in the coals of the following localities, numbered in direct order from Columbus northward: (1) Stippville, (2) Scammon, (3) Mineral City, (4) Weir City, (5) Cherokee, (6) Fleming, ( 7) Chicopee, (8) Pittsburg, (9) Frontenac, (10) Cornell, (11) Arcadia, (12) Fort Scott, (13) Linn county, (14) Franklin county, (15) Osage county, and (16) Cloud county.
Curve No. 2. Plate LII.
Curve No. 2 starts at Pittsburg, at a point about eight miles from the east line of the state. The value of the coal—as determined by the fixed carbon—remains fairly constant to a point ten miles west of the state line. From this relatively high point of 57.5 percent, it falls to 50.5 percent without any appreciable change in distance. This decrease of 7 percent occurs at Cherokee. From this point it decreases rapidly—at a rate of nearly .5 percent per mile—to a point thirty-five miles west of Pittsburg. An increase of .2 percent occurs from the 42.5 mile point to the 72.5 mile point, west of Pittsburg. From the 43 percent mark a fall of 11 percent is noticed, which leaves us at a point 165 to 170 miles west of Pittsburg. This curve was plotted from percents. of fixed carbon found in coals taken from the following localities, which are numbered from Pittsburg westward: (1) Pittsburg, (2) Fleming, (3) Weir City, (4) Scammon, (5) Cherokee, (6) Franklin county, (7) Osage county, (8) Cloud county.
From the above it will be readily seen that the value of Kansas coals decreases in a general way in passing from the southeast to the north and west, the highest percent reached being 58.4, the lowest 28.4, making a difference of 30 percent for a range of 160 to 165 miles, or a decrease of nearly .2 percent per mile.
It is interesting to note at this point that the decrease in percent of fixed carbon bears a very close relation to the variation in percent of calorific power of the same coals, which may be seen on examining the curve of calorific powers, Plate LIII.
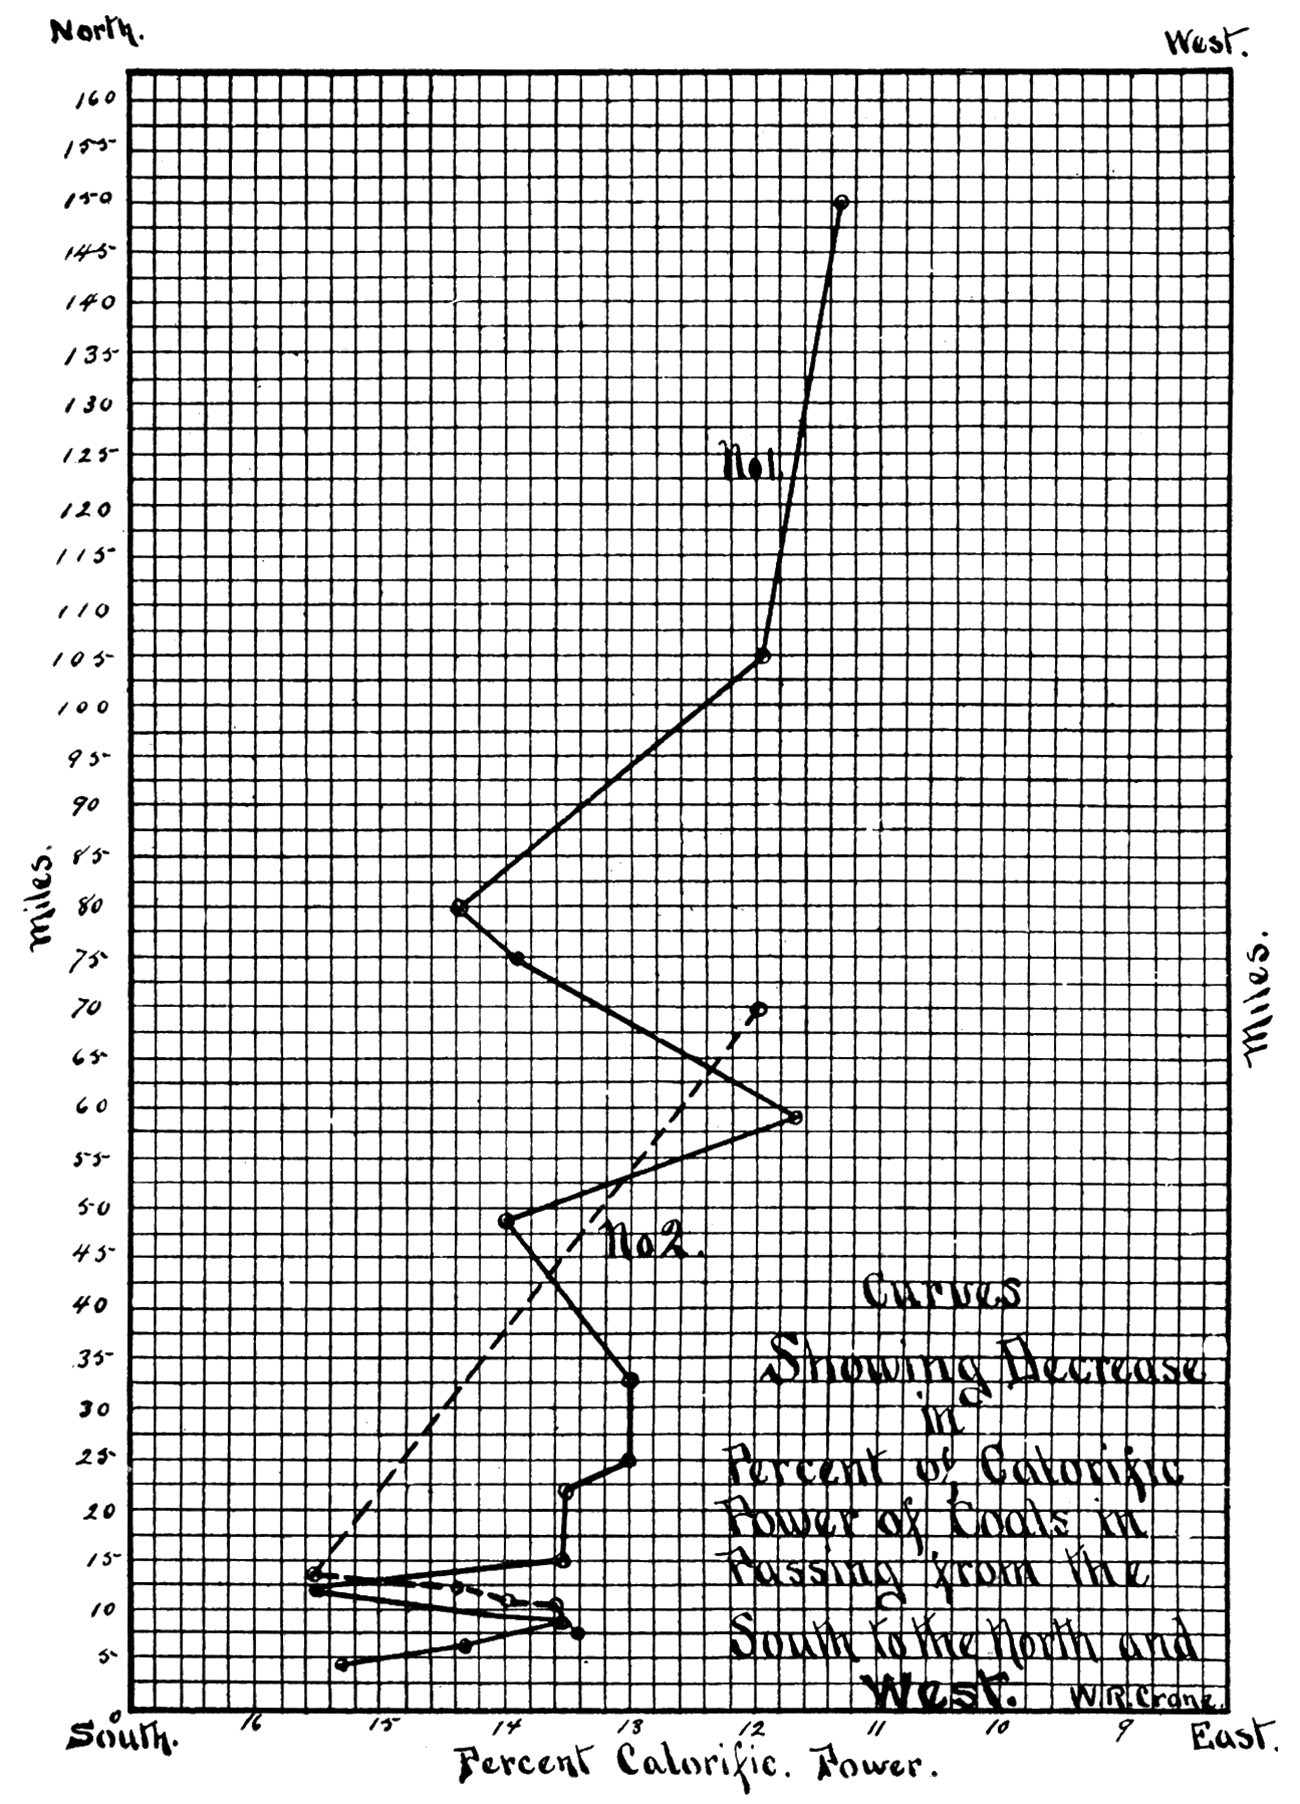
Curves Showing Variation in Calorific Power
Curve No. 1. Plate LIII.
In curve No. 1, it is seen that the number of pounds of water varies from 13.5, during the first twenty miles, to very nearly 16 pounds. From the twenty-odd mile mark to the fifty mile mark the variation is fairly constant, gaining during the last. half of the thirty miles what was lost during the first half. From the fifty mile mark a rapid decrease of nearly 3 percent or 3 pounds of water is noted, from which point there is a rapid increase of 2.7 percent. From the eighty mile mark for the next one hundred miles a decrease of 2.4 percent is noticed" and from this point on to the 150 mile mark a gradual decrease is seen, which is about .4 percent for a distance of forty or fifty miles, making an average of 1/10 of 1 percent to the mile.
From the above a decrease of 26/100 percent is noted for the approximately one hundred and fifty miles passed over.
Curve No. 2. Plate LIII.
In curve No. 2, the initial point has a value of 13.4 percent,: from which point a rapid rise of 2.1 percent to six miles occurs. From approximately fifteen miles west of Pittsburg a very decided decrease in calorific power occurs which is traceable only to the seventy mile mark. As the coals west of this point have not as yet been analyzed, our record from this point westward must of necessity stop.
The localities from which the data for curve No. 1 were obtained are: (1) Stippville, (2) Scammon, (3) Mineral City, (4) Weir City, (5) Cherokee, (6) Fleming, (7) Chicopee, (8) Pittsburg, (9) Frontenac, (10) Cornell, (11) Arcadia, (12) Fort Scott, (13) Pleasanton, (14) La Cygne, (15) Osage City, and (16) Leavenworth.
For curve No. 2, the localities are as follows: (1) Pittsburg, (2) Fleming, (3) Weir City, (4) Scammon, (5) Cherokee, and (6) Osage City.
Resume
From the above it will be seen that the heating value of the Kansas coal decreases quite perceptibly in passing from the south arid east to the north and west, which decrease corresponds very closely to the decrease in the percent of fixed carbon. This fact has also been remarked by Prof. L. I. Blake (1889, p. 42) of the University of Kansas, in his work on the calorific values of coal, and by Prof. E. H. S. Bailey (1889, p. 45) in his chemical work on the same coals.
The depreciation in value of the Kansas coals is probably due to several causes, the most important of which are: Difference in the age of the coal beds and a change in the quality and quantity of the coal producing vegetation, coupled with a change in the conditions of deposit.
A glance at the coal map of Kansas—Plate VIII—will show that the coal beds belonging to the older geological formations lie in the extreme southeastern part of the state, and from the sections given it will been seen that these beds soon pass out of reach of any mining operation which might be attempted outside of the "Cherokee shales" area. The coal beds lying to the north and west belong to more recent geological formations. They are thinner, are not so hard as the coals belonging to the lower formations, and as a general rule have more impurities in them, which is shown by an increase in the percent of ash. The coal beds of the lower and therefore older formations have been subjected to a higher pressure, as shown by the clay veins in the shale and also by the foldings. The upper coal beds show no signs of any orographic movements. This fact will of itself account for the difference in the degree of hardness noticed, if not for the difference in percent of constituents.
Whether there was any marked change in the quality of the coal producing vegetation is not so easily determined as the fact regarding the quantity of vegetation. That there was a marked decrease of coal producing vegetation is easily seen by the thinner strata of coal. With a less rapid deposition of vegetable matter a change in the conditions of deposition would of necessity occur, which change would in many cases seriously affect the chemical and physical properties of the resulting coals.
Plate LII—Diagrams showing decrease in percent of fixed carbon in coal of the state.
The percent of fixed carbon is marked off at the bottom of the chart, and the distance in miles on the sides. The percent of fixed carbon found in the coals of a certain locality with the distance in miles of the locality from an initial or starting point, give the means of platting the curves or diagrams. No. 1 shows the decrease in value of coals in passing from Columbus on the south to Cloud county on the north. No,2 shows the decrease in value of coals in passing from Pittsburg on the east to Cloud county on the west.
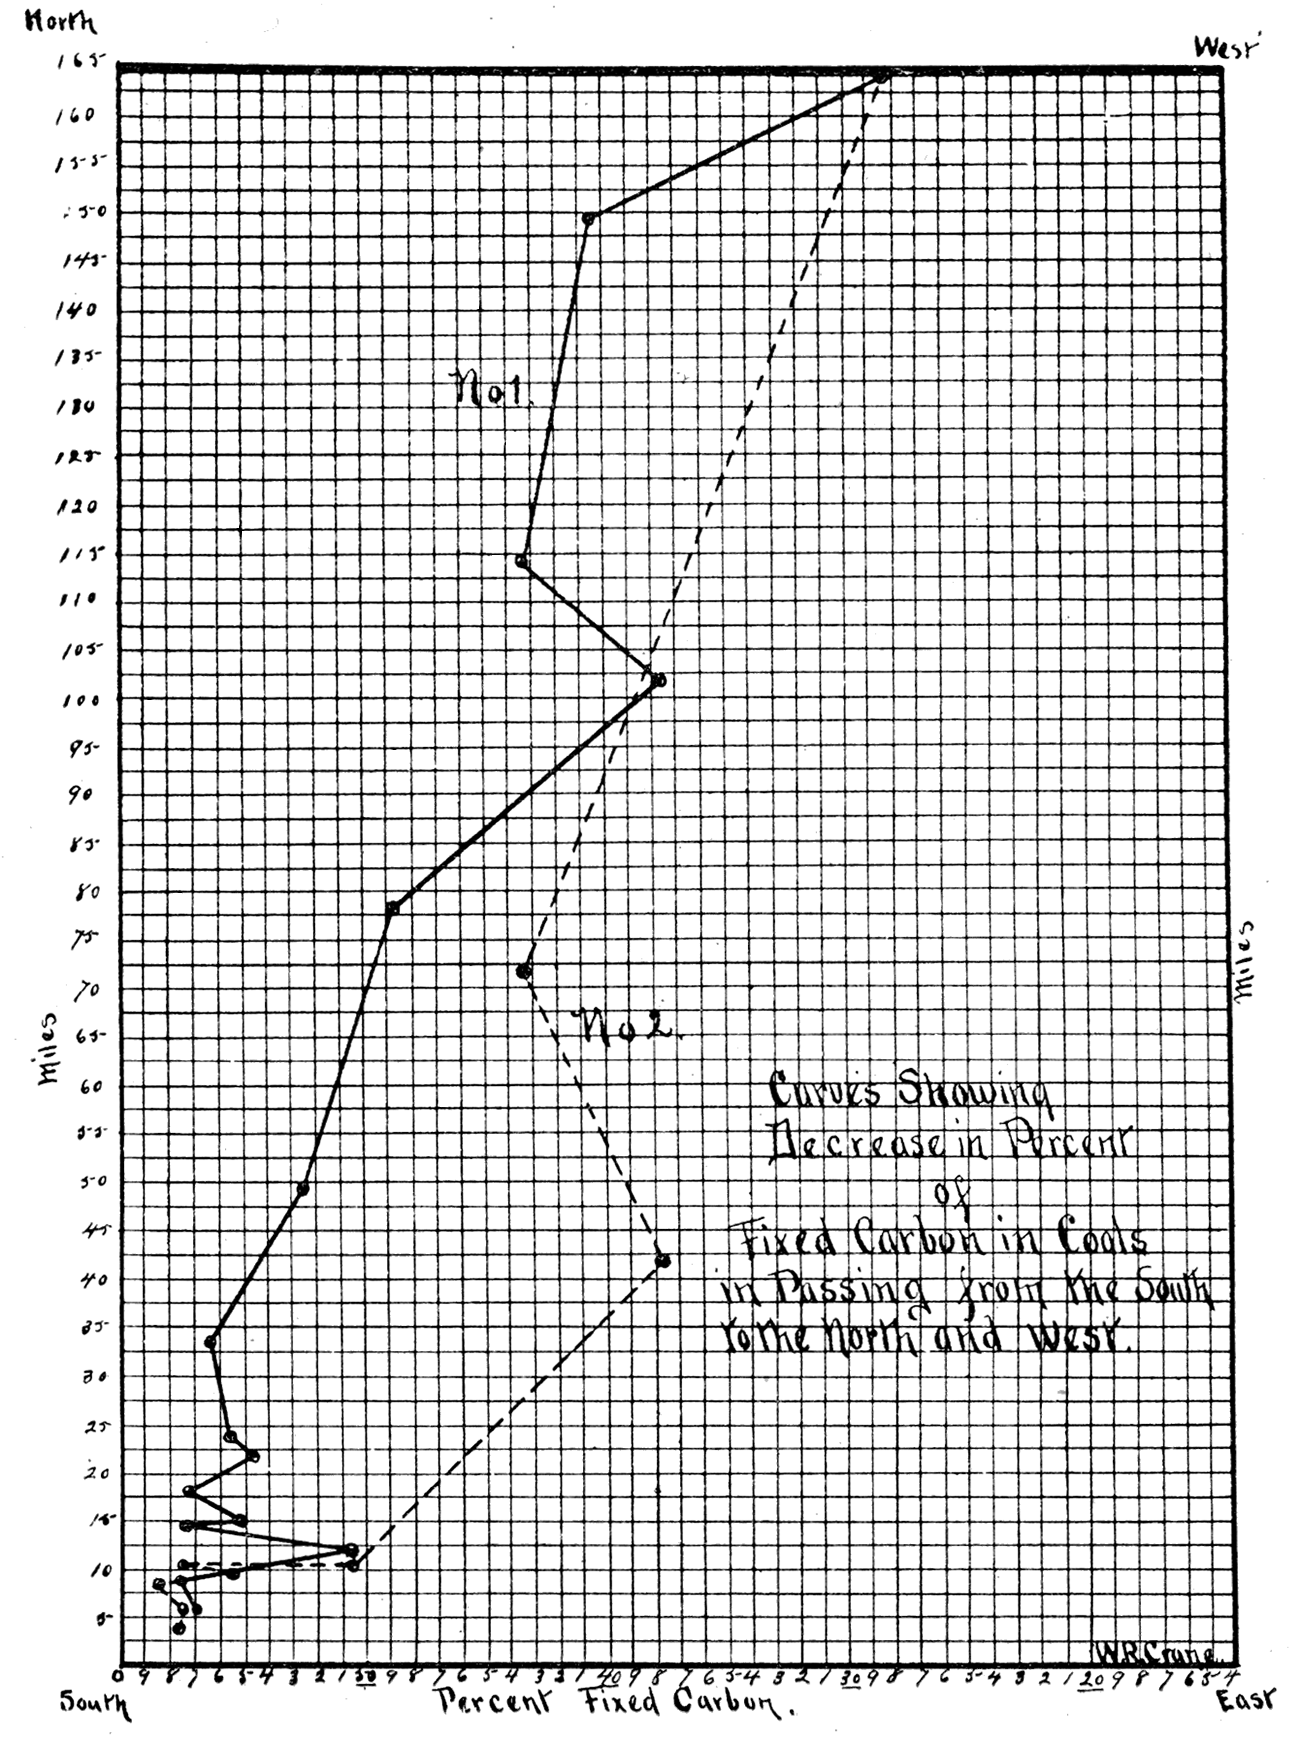
Plate LIII—Diagrams showing decrease in percent of calorific power of coals of the state.
The percent of calorific power, or the number of pounds of water evaporated per pound of coal burned, is marked off at the bottom of the cbart, the distance, in miles, of the locality on the sides, from an initial or starting point, give the means of platting the curves or diagrams. No. 1 shows the decrease in heat producing value of coals in passing from Columbus on the south to Leavenworth on the north. No. 2 shows the decrease in value in passing from Pittsburg on the east to Osage City on the west.
Output and Commerce of Kansas coal
Production
The production of coal depends largely upon the geographic position of the area from which the coal is mined. The central bituminous coal fields, of which Kansas forms no small part, occupy a position midway between the coal fields of Colorado, Dakota, Wyoming, and New Mexico on the west; of Ohio, Illinois, Indiana, Kentucky, and Pennsylvania on the east; and of Alabama and Tennessee on the southeast. There is, however, an area barren of coal extending around this central area, thus isolating it from the surrounding coal fields.
The western portion of this coalless area is also destitute of any material which may be used as a substitute for coal, while to the east, north, and south the area is bountifully supplied with timber, the effect of which upon the coal industry is apparent as wood is so largely used for fuel. The coal deposits of Kansas, Iowa, Missouri, Texas, and the Indian Territory must be the coal supply of the coal barren area to the west and, to a limited extent, to the north, east, and south. The competition of eastern coal is rather severely felt, due to the cheaper transportation by land and water from the east and the higher rates in the west. The foreign market of the Kansas coal is thus principally to the westward, although no small amount is sent east, on account of the excellent heat producing qualities of this coal.
The home market at present consumes a large percent of the yield and with the prospective rapid development of the resources of the state this market promises to become a most important factor in the further development of the coal industry and the maintenance of a large output from the mines of the state.
From data in possession of the Survey, obtained principally from prospecting drill holes and deep well borings for gas and oil, it is found that in the Coal Measures and more especially in the Cherokee shales, a large number of coal strata exist—as high as ten to one drill hole in places—a large percent of which are workable, but are not mined at present owing to the low price of coal. There is, however, no doubt that in time these thinner coal. strata will be worked. But as long as the coal lands are held for grazing and agricultural purposes and only small mines are operated by individuals rather than large mines by larger companies, there is not much prospect of a rapid extension of mining operations in these new fields. The output will not materially increase as long as the price of coal is held down by the more available and thicker beds elsewhere. If, however, the price should rise a few cents per bushel, there would be opened immediately a large number of mines in which operations are not now contemplated because of the low price of coal.
The principal coal producers operating in Kansas are:
- The Cherokee and Pittsburg Coal Mining Company
- The Western Coal Mining Company
- The Kansas and Texas Coal Company
- The Central Coal and Coke Company
- The Pittsburg and Midway Coal Company
- The Wear Coal Company
- The Fuller Coal Mining Company
- The Arnott and Lanyon Company
- The Mount Carmel Coal Company
- The J. H. Durkee Coal Company
- The Osage Carbon Company
- The South western Coal and Improvement Company
- The Western Fuel Company
- The State Mine (Lansing)
- The Home-Riverside Mining Company
- The Leavenworth Coal Company
Besides the ones above mentioned there are a large number of smaller steam and horse power shafts run very irregularly by private parties.
Table VIII—Showing total coal production of the state, by counties, since 1885. Figures previous to 1897 are taken from the Eighteenth Annual Report of the U. S. Geological Survey, Mineral Resources, Part V, page 526. (Short Tons.)
| County | 1885 | 1886 | 1887 | 1888 | 1889 | 1800 | 1891 | 1892 | 1893 | 1894 | 1895 | 1896 | 1897 |
|---|---|---|---|---|---|---|---|---|---|---|---|---|---|
| Atchison | 3,500 | 1,200 | 4,592 | 5,152 | |||||||||
| Cherokee | 371,930 | 375,000 | 385,262 | 450,000 | 549,873 | 724,861 | 832,289 | 825,531 | 697,521 | 918,142 | 918,944 | 985,132 | 1,061,409 |
| Coffey | 18,272 | 12,200 | 1,218 | 3,664 | 1,720 | 475 | 120 | 10,000 | |||||
| Crawford | 221,741 | 250,000 | 298,0491 | 425,000 | 827,159 | 900,464 | 997,759 | 1,309,246 | 1,195,868 | 1,554,253 | 1,354,614 | 1,271,434 | 1,590,621 |
| Franklin | 14,518 | 15,000 | 18,080 | 25,000 | 37,771 | 9,045 | 10,277 | 11,150 | 11,768 | 17,418 | 17,047 | 12,861 | 6,452 |
| Labette | 2,541 | 4,000 | 800 | 800 | 800 | 440 | 250 | 600 | 2,000 | ||||
| Leavenworth | 120,561 | 160,000 | 195,480 | 210,000 | 245,616 | 319,866 | 380,142 | 330,166 | 309,237 | 395,967 | 259,060 | 284,700 | 367,141 |
| Linn | 5,556 | 8,900 | 12,400 | 17,500 | 25,345 | 10,414 | 38,931 | 43,913 | 46,461 | 25,867 | 14,051 | 14,534 | 26,775 |
| Osage | 370,552 | 380,000 | 393,608 | 415,000 | 446,018 | 179,012 | 355,286 | 372,806 | 279,168 | 322,189 | 241,584 | 190,948 | 181,857 |
| Small mines | 101,199 | 211,100 | 294,000 | 301,500 | 68,448 | 100,000 | 100,000 | 110,000 | 110,000 | 120,000 | 120,000 | 120,000 | 40,399 |
| Totals | 1,212,007 | 1,400,000 | 1,596,879 | 1,850,000 | 2,221,043 | 2,259,922 | 2,716,705 | 3,007,276 | 2,652,546 | 3,388,251 | 2,926,870 | 2,884,801 | 3,291,806 |
Value of Coal
As the value of any product cannot be estimated until the quantity is known, so not even an approximate estimate can be placed upon the coal deposits of a given area until the quantity of coal lying therein is determined. The determination of the amount of Kansas coal is exceedingly difficult, due to the variability of the thickness of the coal strata.
It is known, however, that a stratum of coal 1 foot in thickness and an acre in areal extent will produce approximately 1,700 tons. Probably one-third of this amount will be left in the mine as waste, supports to the roof, etc., leaving about 1,200 tons of available coal. With a 2 1/2 foot stratum of coal (an approximate average for the coals worked) the production per acre would amount to 3,000 tons. A stratum of coal 2t feet thick would produce per square mile 1,920,000 tons. The output for 1897 was 3,290,000 tons, therefore the area of about two square miles is exhausted per year. About one-fourth, or 20,000 square miles, of Kansas lies within the Coal Measures. If one-fifth of this area can be taken as a fair estimate of the area underlaid with workable coal, there would be 4,000 square miles of coal producing territory. It would, therefore, at the present rate of output, take 2,000 years to exhaust the coal deposits of the Kansas Coal Measures. But as the output must correspondingly increase with the steadily increasing demand it will be seen that the most careful calculation can be nothing more than approximations at best.
Taking the highest and lowest prices paid for coal in Kansas since 1889, which were $2.18 and 97 cents,—as given in the U. S. Mineral Resources, 1886 and 1887, Part V, page 527—an acre of coal 2 1/2 feet thick would have maximum and minimum values of $6,540 and $2,910. The value of the coal taken from a square mile would lie between $4,185,600 and $1,862,400.
The five principal means of consumption of the Kansas coals are, railways, manufactures, domestic use, gas works, and coking establishments. These are given in the relative order of importance. The railways are the greatest consumers. This class along with the manufactures employ the coal for steam-producing purposes. As steam producers Kansas coals rank high, especially those of the Cherokee shales, mined in Cherokee, Crawford, Bourbon, and Leavenworth counties. ,The evaporative power of some coals from Crawford and Cherokee counties reaches as high as 15.5 pounds of water per pound of coal, which is very close to that of the United States standard, the Indiana block, of Clay county. Nearly all of the .coals are good for domestic purposes, some, however, much better than others. The Bunker Hill coal and the Fort Scott "rusty" or " red" are much sought after for domestic use.
Table IX—Showing average prices for Kansas coal since 1889, by counties producing 10,000 tons or over. From U. S. Geological Report on Mineral Resources, 1891, Part V, page 527.
| County | 1889 | 1890 | 1891 | 1892 | 1893 | 1894 | 1895 | 1896 | 1897 |
|---|---|---|---|---|---|---|---|---|---|
| Cherokee | $1.20 | $1.22 | $1.19 | $1.22 | $1.15 | $1.13 | $1.22 | $1.23 | $1.30 |
| Crawford | $1.20 | $1.24 | $1.09 | $1.08 | $1.10 | $1.07 | $1.02 | $0.97 | $1.30 |
| Franklin | $2.18 | $2.00 | $1.90 | $1.85 | $1.84 | $1.88 | $1.84 | $1.80 | |
| Leavenworth | $1.69 | $1.60 | $1.40 | $1.60 | $1.55 | $1.49 | $1.49 | $1.30 | $1.30 |
| Linn | $1.32 | $1.34 | $1.23 | $1.21 | $1.22 | $1.20 | $1.10 | $0.91 | |
| Osage | $2.03 | $1.35 | $2.04 | $2.04 | $1.85 | $1.89 | $1.45 | $1.65 | $1.75 |
| The State | $1.48 | $1.30 | $1.31 | $1.31 1/2 | $1.21 | $1.23 | $1.20 | $1.15 |
The Cherokee coal, that is the coal from Cherokee and Crawford counties, is the best gas producer in the state. It cokes quite readily and the expense of purifying it from sulphur is slight. This coal is used extensively for coking in Cherokee and Crawford counties, where are located several coal washing establishments in connection with coking ovens. The coke is used in the smelters, but the demand for coke has declined of late, especially in the vicinity of Weir City since it has been found that the slacked coal which can be obtained in close proximity to the smelters by stripping and at a very low figure makes a very good fuel for smelting purposes.
The two following tables give the statistics of the coke industry in Kansas for a number of years preceding and including 1896.
Table X—Showing statistics of the manufacture of coke in Kansas from 1880 to 1896. From Eighteenth Ann. Rep., 1896-'97, U. S, Geol. Surv, Min, Res., part V, page 703.
| Year | Establishments | Ovens | Coal used short tons |
Coke produced short tons |
Total value of coke at ovens |
Value of coke at ovens per ton |
Yield of coal in coke (%) |
|
|---|---|---|---|---|---|---|---|---|
| Built | Building | |||||||
| 1880 | 2 | 6 | 4,800 | 3,070 | $6,000 | $1.95 | 64 | |
| 1881 | 3 | 15 | 8,800 | 5,670 | 10,200 | $1.80 | 64.4 | |
| 1882 | 3 | 20 | 9,200 | 6,080 | 11,460 | $1.70 | 65 | |
| 1883 | 4 | 23 | 13,400 | 8,430 | 16,560 | $1.96 | 62.9 | |
| 1884 | 4 | 23 | 11,500 | 7,190 | 14,5880 | $2.02 | 62.5 | |
| 1885 | 4 | 23 | 15,000 | 8,050 | 13,255 | $1.65 | 53.7 | |
| 1886 | 4 | 36 | 23,063 | 12,493 | 19,204 | $1.54 | 54.2 | |
| 1887 | 4 | 39 | 27,604 | 14,950 | 28,575 | $1.91 | 54 | |
| 1888 | 6 | 58 | 24,934 | 14,831 | 29,073 | $1.96 | 59 | |
| 1889 | 6 | 68 | 21,600 | 13,910 | 26,593 | $1.91 | 61 | |
| 1890 | 7 | 68 | 21,809 | 12,311 | 29,116 | $2.37 | 56 | |
| 1891 | 6 | 72 | 27,181 | 14,174 | 33,296 | $2.35 | 52 | |
| 1892 | 6 | 75 | 15,437 | 9,132 | 19,906 | $2.18 | 59.2 | |
| 1893 | 6 | 75 | 0 | 13,645 | 8,565 | 18,640 | $2.18 | 62.8 |
| 1894 | 6 | 61 | 0 | 13,288 | 8,439 | 15,660 | $1.855 | 63.5 |
| 1895 | 5 | 55 | 0 | 8,424 | 5,287 | 11,289 | $2.14 | 62.8 |
| 1896 | 6 | 55 | 0 | 8,940 | 4,785 | 8,676 | $1.813 | 53.5 |
Table XI—Showing character of coal used in the manufacture of coke in Kansas, 1890 to 1896. From Eighteenth Ann, Rep., 1896-'97. U. S. Geol. Surv, Min. Res., part V, page 704.
| Year | Run of mine | Slack | Total short tons |
||
|---|---|---|---|---|---|
| Unwashed short tons |
Washed short tons |
Unwashed short tons |
Washed short tons |
||
| 1890 | 0 | 0 | 19,619 | 2,190 | 21,809 |
| 1891 | 0 | 0 | 27,181 | 0 | 27,181 |
| 1892 | 0 | 0 | 15,437 | 0 | 15,437 |
| 1893 | 0 | 0 | 12,445 | 1,200 | 13,645 |
| 1894 | 0 | 0 | 13,288 | 0 | 13,288 |
| 1895 | 0 | 0 | 8,424 | 0 | 8,424 |
| 1896 | 0 | 0 | 8,940 | 0 | 8,940 |
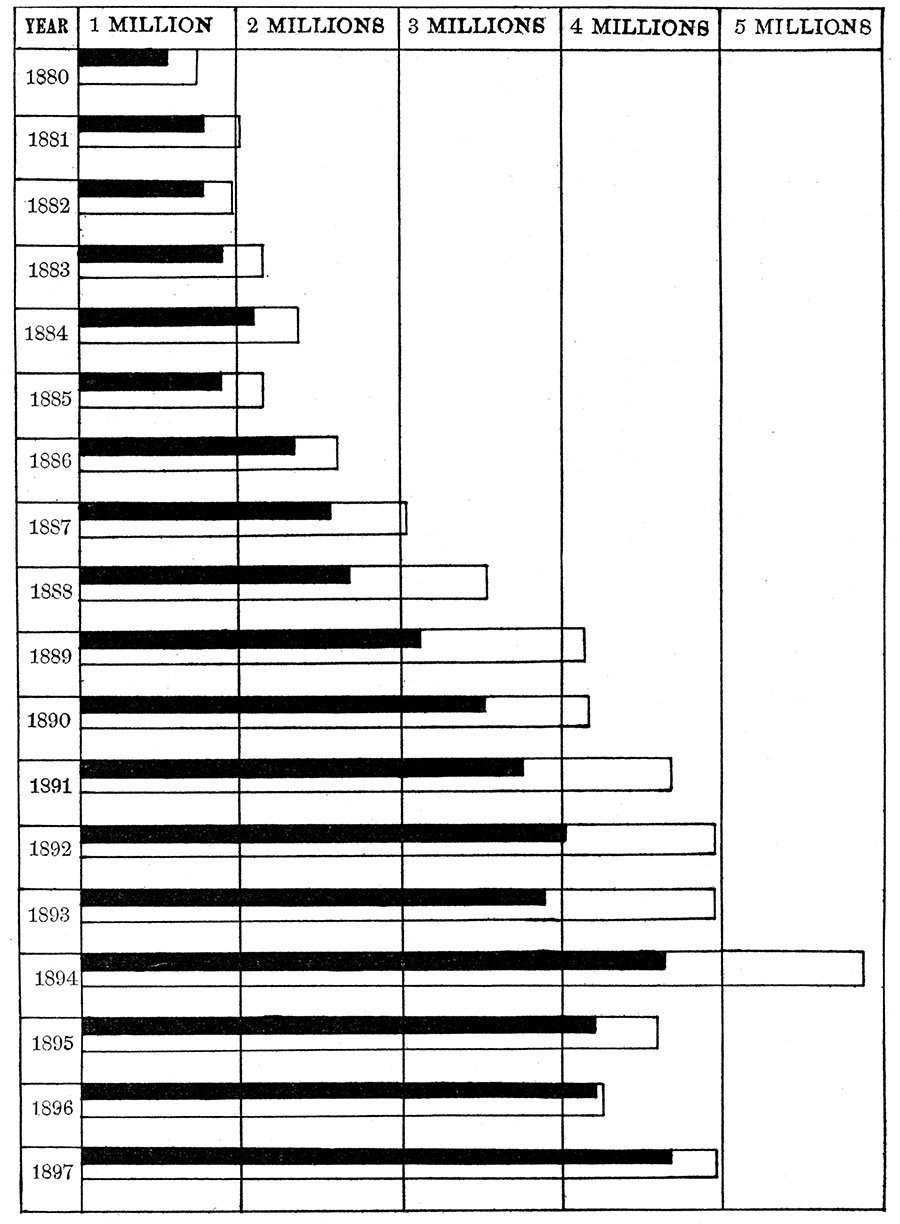
Plate LXVIII—Annual output and value of coal, from 1880 to 1897, inclusive. The output is represented by the solid black, and value by the open spaces.
Prev Page--Chemical Properties || Next Page--Mine Directory
Kansas Geological Survey, Geology
Placed on web Sept. 12, 2018; originally published 1898.
Comments to webadmin@kgs.ku.edu
The URL for this page is http://www.kgs.ku.edu/Publications/Bulletins/Vol3/54_value.html