![]()
Prev Page--Geology || Next Page--Well Records
Ground Water
Principles of Occurrence
The following discussion of the principles governing the occurrence of ground water has been adapted from the excellent discussion by Meinzer (1923), and the reader is referred to his report for a more complete discussion of the subject. A summary of the occurrence of ground water in Kansas has been made by Moore and others (1940).
Nearly all the rocks that immediately underlie the surface of the earth contain open spaces or interstices, which may contain water or other fluids. The number, size, shape, and arrangement of these openings are controlled by the character of the rock so that the occurrence of ground water is determined by the geology of the region. These openings in the rocks may range in size from microscopic pores or interstices to the huge caverns sometimes found in limestone regions. If the open spaces are connected, water can percolate from one to another, but sometimes these open spaces are isolated and there is relatively little movement of water. Some of the more prominent types of open spaces and the relation of rock texture to porosity are shown in Figure 7.
Figure 7--Diagram showing several types of rock interstices and the relation of rock texture to porosity. A, Well-sorted sedimentary deposit having a high porosity; B, poorly sorted sedimentary deposit having low porosity; C, well-sorted sedimentary deposit consisting of pebbles that are themselves porous so that the deposit as a whole has a very high porosity; D, well-sorted sedimentary deposit whose porosity has been diminished by the deposition of mineral ,matter in the interstices; E, rock rendered porous by solution; F, rock rendered porous by fracturing. (From O. E. Meinzer.)
In central Kansas the source of all ground water is precipitation, which falls as rain or snow. A part of the precipitation may percolate downward through the soil and eventually become ground water. The remainder runs off the surface, evaporates, or is transpired by plants. The proportion of the total precipitation that becomes ground water depends upon a large number of factors, such as the type and porosity of the soil, the permeability of the underlying rocks, the rate of evaporation, and the topography and drainage of the area.
The percentage of the volume of open spaces to the total volume of rock is known as the porosity. When all the porous spaces in a rock are filled with water, it is said to be saturated. The permeability of a rock is its ability to transmit water under a hydraulic gradient. A rock made up of very small particles may contain a large volume of openings, but because the openings are small, the rock may have a very low permeability even though the porosity is high. Similarly, larger openings that are not interconnected may result in a high rock porosity and a low permeability. If both the porosity and the permeability are high, water can move freely through the rock and the rock is a good aquifer.
In the North Solomon Valley, the Cretaceous rocks are somewhat porous but are composed predominantly of very fine-grained material and have small openings that are poorly connected. These rocks have a low permeability and are of no importance as aquifers in this area. In contrast the alluvial material comprising the gravels of the Meade formation, the Crete sand and gravel member of the Sanborn formation, the terrace deposits, and the alluvium of the major valleys is composed of relatively coarse, moderately sorted sediments that have both a high porosity and a high percentage of interconnected openings. These rocks have a relatively high permeability compared to the Cretaceous rocks.
The Water Table and Movement of Ground Water
The water table is defined as the upper surface of the zone of saturation in ordinary porous rock (Meinzer, 1923a, p. 32). If the upper surface is formed by a layer of impermeable rock, the water table is absent and artesian conditions exist. Actually, the water table is not a plane surface but is generally a sloping surface, which has irregularities caused by differences in the permeability of waterbearing material, by unequal additions or withdrawals of ground water, or by irregularity of the land surface. The water table does not remain stationary but fluctuates in response to additions to or withdrawals from water in storage.
Plate 2 shows the location of all water wells in which the depth to water was measured, the location of test holes drilled by the State Geological Survey, the altitude of the water surface with respect to sea level at various points along the channels of the major streams; and contours on the water table. Water-table contours are not shown in the areas of Cretaceous rocks because the general water table occurring in the valley area does not extend into those areas.
Shape and Slope
The shape and slope of the water table in the area covered by this report is shown on Plate 2 by means of contours. Each point on the water table on a given contour line is at the same altitude. Thus, the water-table contours show the configuration of the water surface in the same way that topographic contours show the shape of the land surface. The direction of ground-water movement is at right angles to the contour lines in the down-slope direction.
Plate 2 indicates that ground water moves down the valley from the west toward the east. Along the valley sides it moves also toward the center of the valley. The map shows, by contours close together, many places along the sides of the valley where the water table slopes more steeply than in the center of the valley. These steeper gradients are probably a reflection of the lower permeability of the rocks along the valley sides where the water-bearing sediments contain more fine-grained material derived from the Cretaceous rocks than is found in the central parts of the valley. It should be noted also that the general downstream movement of the ground water in the valley varies throughout the area. In western Phillips County, the downstream slope of the water table is at the rate of about 11.5 feet per mile, whereas near Kirwin it is about 6.4 feet per mile and near Downs it is a little less than 5 feet per mile.
Wells that draw large quantities of water from the ground-water reservoir may cause local depressions in the water table. As indicated on the water-table contour map (Pl. 2), the city well at Portis is the only one of the larger wells that seems to have created a local depression.
Relation to Geology
In many respects, the rate and direction of ground-water movement are controlled by the geology. It has already been stated that the general water table that lies under the main part of the valley does not extend into the Cretaceous rock that forms the valley walls. Furthermore, where the terrace deposits along the sides of the valley contain a considerable amount of locally derived material and are not well sorted, the gradient of the water table is much greater than in the coarser, better-sorted materials in the central part of the valley. Although it is not apparent on Plate 2, the materials that compose the Crete member of the Sanborn formation generally are finer than the younger terrace deposits; hence the ground-water movement through them is slower, and the gradient is probably steeper than it is in the terrace deposits. In a few localities, the water table may be in the Sanborn loess or in the upper silty part of the terrace deposits, which are still finer-grained and where movement of ground water is still slower. In some places under the main part of the valley, as in sec. 28, T. 4 S., R. 17 W., hills of Cretaceous rocks buried beneath the alluvial materials extend above the water table. Wells in these localities have not yielded ground water.
Relation to Topography and Drainage
The water table generally reflects the surface topography; thus, the downstream gradient of the water table is approximately equal to the downstream slope of the terrace surface, and where unconsolidated deposits form the walls of the valley, the water table extends into them. The water table near the valley walls generally has a greater slope than in the central part of the valley and reflects in a subdued way, the steepness of the valley walls. The depth to water in each well in the valley area is shown on Plate 2.
The most important features affecting the water table in this area are the streams. The North Solomon River and Bow Creek are the only perennial streams in this area. The major tributaries, Deer Creek, Madison Creek, Cedar Creek, Beaver Creek, Spring Creek, Dry Creek, and Lawrence Creek, are intermittent streams that flow except during prolonged dry seasons. All other streams are ephemeral, that is, they flow only in response to precipitation. Most ephemeral streams lie above the water table, and when they flow, probably contribute some water to the ground-water body. Figure 8, prepared by Latta (1944) to illustrate the Arkansas River, indicates the relation to the water table of both influent and effluent streams. Figure 8A is a longitudinal view of an influent stream that in its downstream course intersects the water table and becomes an effluent stream-that is, a stream that receives water from the ground-water body. Figure 8B is a cross section of a stream that contributes water to the reservoir and shows the mounding effect of the water table beneath such a stream. Most small tributaries probably lose some water to the ground-water body during periods of heavy runoff; however, the resultant mounding effect of the water table is probably small and is not noticeable after the stream stops flowing. Figure 8C is a cross-section of a stream that is gaining water from the water table. The Solomon River and its major tributaries throughout this area are gaining streams; their flow is maintained, in part, by ground water that seeps into them from the channel banks. Consequently the contours on the water-table map (Pl. 2) bend around the streams and each major stream flows in a small ground-water trench. This seepage is the most noticeable feature of the water table in this area and is an important factor in maintaining the flow of North Solomon River.
Figure 8--Diagrammatic sections showing influent and effluent streams. A, Longitudinal section showing (right) how river gains water and (left) how it loses water. B, Transverse section across influent part of river. C, Transverse section across effluent part of river. (After Latta, 1944, fig. 14.)
Fluctuations of the Water Table
The water table does not remain in a stationary position, but fluctuates vertically like the water level of a surface reservoir. The rise or decline of the water table depends upon the amount of recharge into the ground-water reservoir or the amount of discharge from the reservoir. When the inflow exceeds the draft the water table rises and, conversely, when the draft exceeds the inflow the water table declines. If the water-bearing materials have a specific yield of 20 percent, the addition of 1 foot of water to the groundwater reservoir will cause a rise of the water table of 5 feet.
Some of the factors that control the rise of the water table are the amount of precipitation that percolates downward through the soil to the water table, the amount of recharge by seepage from streams that lie above the water table, and the amount of water that moves into the area from upstream. The principal factors controlling the decline of the water table are the amount of water lost from the ground-water reservoir by effluent seepage into the streams, the amount of discharge through transpiration where the water table is within the reach of plants, the amount evaporated directly from the ground-water reservoir where it lies near the surface of the ground, the discharge by pumping within the area, and the amount of water leaving the area through subsurface flow in a downstream direction.
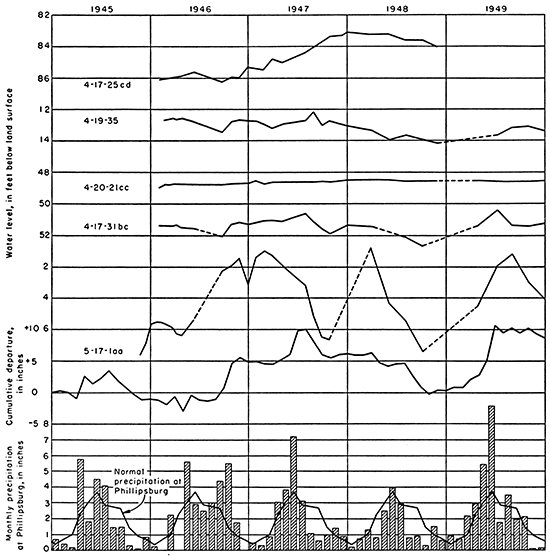
In order to determine the character and magnitude of the waterlevel fluctuations in this area, 22 wells were selected for observation, and periodic measurements of the depth to water in them were begun in 1945 and 1946. Annual records of these wells are published by the U. S. Geological Survey (Sayre and others, 1949) and fluctuations in some of the wells are illustrated graphically in Figures 9, 10, and 11. Each graph shows the normal precipitation in the area where the wells are located, the monthly precipitation, and the cumulative departure from the normal monthly precipitation.
Figure 9--Hydrographs showing fluctuations of water levels of two wells in Osborne County and graphs showing monthly precipitation and cumulative departure from normal monthly precipitation near Alton.
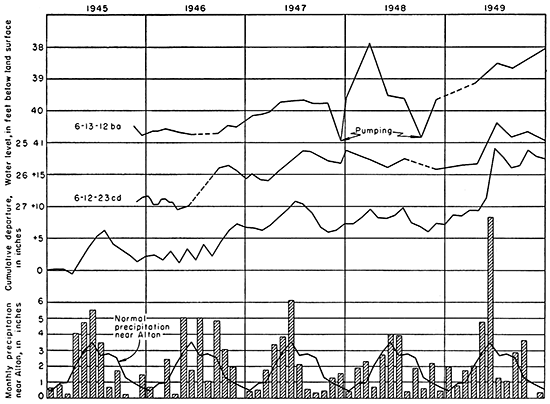
Figure 1O--Hydrographs showing fluctuations of water levels of several wells in Smith County and graphs showing monthly precipitation and cumulative departure from normal monthly precipitation at Smith Center.
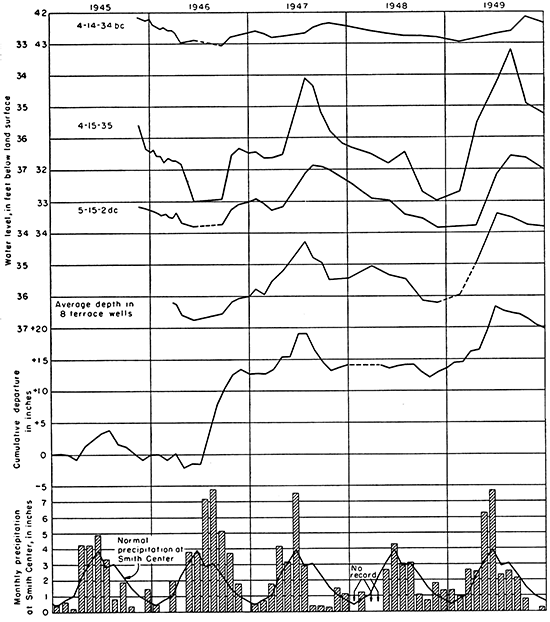
Figure 11--Hydrographs showing fluctuations of water levels of five wells in Phillips County and graphs showing monthly precipitation and cumulative departure from normal monthly precipitation at Phillipsburg.
Recharge
Recharge is the addition of water to the ground-water reservoir, and it takes place in several ways. Ground water that is within a practical drilling depth in the area described in this report is derived from water that falls as rain or snow in this or adjacent area. After the water becomes a part of the ground-water body, it moves down the slope of the water table and is discharged farther downstream.
Recharge from Precipitation
The normal annual precipitation in this area ranges from about 21.6 to 23.5 inches and averages about 22.5 inches. Probably only a small part of this water reaches the zone of saturation, the remainder being discharged as surface runoff, evaporation and transpiration. The depth to the water table and the character of the material underlying the land surface exert considerable influence on the amount of water that is added to the ground-water reservoir as recharge. Another factor influencing the proportion of precipitation that becomes recharge is the topography of the area. In an area of steep slopes, such as the valley sides, a very small proportion of the precipitation will become recharge. In a flat area, such as the broad terrace along North Solomon River, a much larger proportion of the total precipitation may become recharge.
Figure 9 shows the precipitation near Alton, the cumulative departure from the normal near Alton, and the fluctuations of the water level in wells in Osborne County. A direct relation may be seen between fluctuations of the water table and local precipitation. Thus water levels rose during the periods of heavy precipitation in the fall of 1946 and the spring of 1947, whereas they declined during the period of below-normal precipitation in the summer of 1947. The water table rose after the very heavy precipitation of May 1949 and declined during the period of below-normal precipitation during June and July of 1949. Figure 10 shows hydrographs of three wells on the terrace in Smith County, a graph of the average depth to water in eight terrace wells, precipitation data, and the cumulative departure from normal precipitation at Smith Center. These graphs indicate that the water table rose after heavy precipitation in September and October 1946, in May 1947, and in the late spring of 1949. Water levels declined during the fall of 1947 and the fall of 1948 after periods of below-normal precipitation. The curve of the average depth to water in the eight terrace wells shows a rise in the average water level of nearly 2.5 feet since the spring of 1946. During this period, the cumulative departure from the normal precipitation was nearly 20 inches. Figure 11 shows the water levels in five wells in North Solomon Valley in Phillips County and a graph of the cumulative departure from normal precipitation in Phillipsburg. These wells show effects that are directly related to the precipitation and that are similar to those shown in the other figures. The water level in well 5-17-1aa, which is on the flood plain of North Solomon River, fluctuated considerably more than the water levels in the other wells in the area and is believed to be affected by the water stage in North Solomon River. In November 1946, an automatic water-stage recorder was installed on well 6-11- 34aa (Pl. 10C). Small fluctuations of the water level, observed from the records of this well, indicate that part of the fluctuations are due to changes in atmospheric pressure. Several of the hydrographs of different wells indicate that a lowering of the water table during the summer months is probably the result of excessive transpiration. The relation between water levels and precipitation, as shown by the hydrographs, suggests that the ground-water reservoir is recharged largely by local precipitation.
Recharge from Streams
North Solomon River and all its principal tributaries in this area are effluent streams and receive water from the ground-water reservoir. During flood periods, the streams may contribute a small amount of water to the ground-water reservoir, but the quantity is small compared to the amount contributed by rainfall. The small tributary streams, which flow only after periods of rainfall, constitute an important source of recharge in this area. Many of these streams head in chalk hills a few miles from the Solomon Valley and carry considerable volumes of water. They have no channels across the terrace surface (Pl. 1) but they discharge water upon it, and a large part of this water percolates downward to the ground-water reservoir.
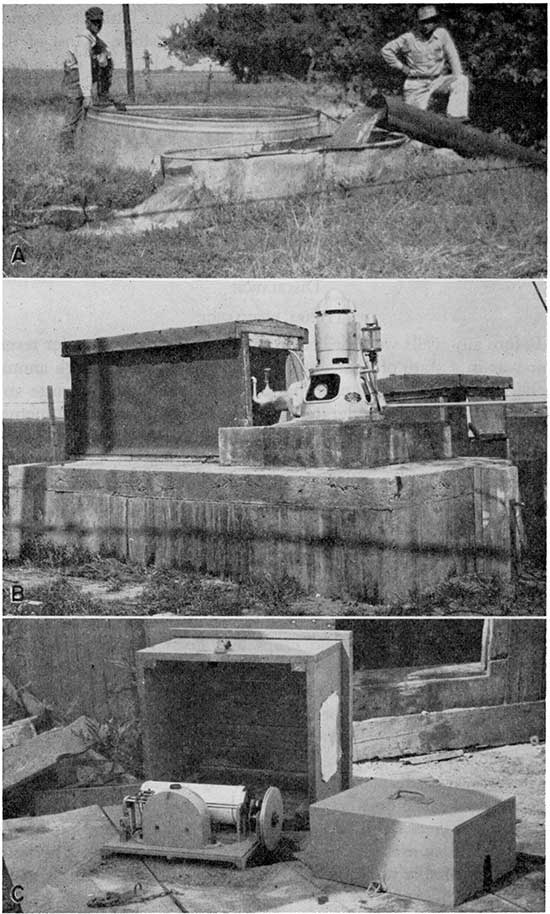
Plate 10--A, Part of Aaron Fink surface-water irrigation plant in operation in the SW sec. 14, T. 6 S., R. 12 W., April 1946. B, Phillipsburg municipal well No. 1 in the SW sec. 26, T. 4 S., R. 18 W. C, Automatic water-stage recorder on well 6-11-34aa, Osborne County.
In the chalk hills that border the valley a large number of ponds have been constructed to furnish water for livestock. Most of the ponds are located in small tributaries, and much of the water they hold eventually becomes ground-water recharge.
Recharge from Subsurface Inflow
The movement of ground water in this area, as indicated on Plate 2 by the slope of the water table, is toward the east and southeast in a downstream direction; hence, a small amount of recharge from the precipitation in parts of the valley to the west moves into western Phillips County and contributes to the available ground-water supply in this area.
Discharge
Natural Discharge
Before any wells were drilled in this area, the ground-water reservoir was in a state of near equilibrium; that is, the average annual recharge was nearly balanced by the average annual discharge and the water table was moderately stable except for seasonal fluctuations. Water was added to the ground-water reservoir by movement from the west, by recharge from precipitation, and by seepage from intermittent streams. Ground water was discharged from this area principally by movement to the east, by discharge into North Solomon River and its tributaries, by evaporation, and through transpiration by plants.
One of the principal methods of ground-water discharge in this area is transpiration. Water is taken up through the roots of plants from the zone of saturation and transpired at the leaf surfaces. The limit of lift by ordinary field crops and grass is only a few feet. However, the roots of alfalfa and certain desert plants have been known to penetrate the water table at depths of 60 feet. Alfalfa is a principal farm crop along the terrace in the valley area, and trees line the banks of the major streams; therefore the total discharge of water by transpiration in this area is considerable.
Ground-water discharge occurs also by direct evaporation, but this can take place only where the water table is shallow, as along the banks of creeks and in the narrow parts of the flood plain. As these conditions exist in only a small part of the area, evaporation losses are probably not large.
Discharge from Wells
The pumping of water from wells is now One of the principal means of ground-water discharge. Tables 5 and 6 show that the annual pumpage of ground water for industrial and public supply use amounts to more than 330 million gallons. This pumpage also constitutes ground-water discharge. This is probably several times the total amount pumped from farm wells for domestic and stock use in the valley area, but the total pumpage probably is considerably more than 350 million gallons per year.Recovery
Principles of Recovery
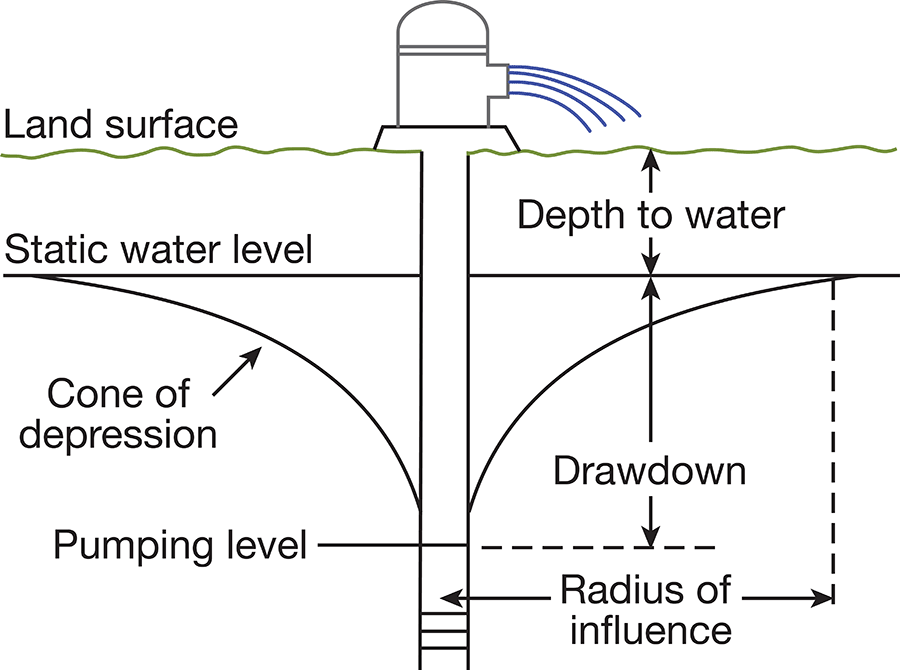
When water is standing in a well there is equilibrium between its head and the head of water in the aquifer outside the well. When water is withdrawn from the well, a difference in head is created between the water inside the well and the water in the aquifer for some distance from the well. The water table in the vicinity of the well develops a cone of depression (Fig. 12), which is greatest at the contact with the pumped well and extends some distance around the well. A higher pumping rate in a well produces a greater drawdown (depression of the water table) and the diameter of the cone of influence and the area of influence are increased. Thus, water moves toward the well from a greater distance, under a higher gradient, and at a greater rate. The specific capacity of a well is the rate of yield and is generally stated in gallons a minute per foot of drawdown. It is generally determined after the well has been pumped long enough to stabilize the drawdown. Table 4 gives the specific capacity and other hydrologic data for several of the municipal and industrial wells that have been test-pumped in this area.
Figure 12--Diagrammatic section of a well that is being pumped, showing its drawdown, cone of depression, and radius of influence. (After Meinzer, 1923a, fig. 30.)
The character of the water-bearing material largely controls the yield, drawdown, and specific capacity of a well. If the waterbearing material is coarse and well sorted, it will readily yield large quantities of water with a minimum of drawdown. If the waterbearing material is fine or poorly sorted, it will offer much resistance to the flow of water and thereby decrease the yield and increase the drawdown. All other things being equal, the drawdown of a well varies inversely with the permeability of the water-bearing material.
Types of Wells
Dug wells--Dug wells are excavated with picks, shovels, spades, and farm machinery. They range from 2 to 6 feet in diameter, most most of them being less than 4 feet. The dug wells are restricted to the area of terrace deposits or to the alluvium of tributary valleys in the uplands. They are generally walled with stone, brick, or boards, plastered with cement, or cased with large tile. Rock or brick walls are probably the most common. Of the 244 wells listed in the well tables, 95 are dug wells.
Because of the method of construction, a dug well is subject to contamination. Its large diameter permits surface seepage into the well where it is inadequately covered, and its rock or brick wall allows dirt, insects, snakes, and small boring animals to enter. It is generally dug only a few feet below the water table and may become dry in seasons when the water table declines. Unless the lower part is walled up with care, especially where the water-bearing material contains a large proportion of fine sand or silt, the fine material may work its way into the well, which will have to be cleaned periodically. Five of the wells that were visited had been dug some 20 or 30 feet-apparently, when the water table was exceptionally high-and had later been deepened by drilling or driving sand points inside the dug well.
Bored wells--Wells are bored by augers or post-hole diggers in unconsolidated sediments. Many of the shallow farm wells in the terrace and alluvial areas have been bored and 54 of the wells visited during the course of this investigation were bored wells. Such wells may be left uncased, but in this area most of the bored wells were cased with galvanized iron casing, tile, or boards. To penetrate far below the water table with a hand auger is difficult; therefore, most of the bored wells penetrate the water table only a few feet. Generally they are not more than 8 inches in diameter and most of them are about 6 inches in diameter. A few bored wells are 10 to 12 inches in diameter; one or two of the city wells in Downs have been bored with large auger equipment.
Drilled wells--A drilled well is excavated by means of a percussion or rotary drilling machine. In this area drilled domestic and stock wells generally are 5 to 10 inches in diameter and are cased with galvanized iron, tile, or wrought iron. Most of the public-supply and industrial wells are drilled. Eighty-eight drilled wells were inventoried in this area.
Methods of Lift and Types of Pumps
Most of the domestic and stock wells along North Solomon Valley are equipped with lift or force pumps. The cylinders of both types of pumps are similar and are located below the land surface, either above or below the water table. A lift pump can discharge water only at the pump head, but a force pump can deliver water above this point. Force pumps are used to pump water into elevated storage and stock tanks.
Except for the municipal well at Speed and the well of the Missouri Pacific Railroad at Harlan, the municipal and railroad wells in this area are equipped with turbine pumps that are powered by electric motors. Data concerning these wells are given in the table of well records (Table 15).
Utilization
During this investigation information was obtained for 244 wells in the North Solomon Valley. Most of them supply or have supplied water for domestic and stock use. Of the wells listed in Table 15, 12 were not in use when visited, 28 supplied water for domestic use, 61 supplied water for livestock, 119 supplied water for both domestic and stock use, 18 supplied water for municipalities, and 6 supplied water for railroads. Table 5 gives the industrial use of water, Table 6 the municipal use, and Table 7 the chemical character of municipal water supplies in this area.
Domestic and Stock Supplies
Domestic wells supply water to homes for cooking, drinking, and laundry, to schools not supplied from municipal systems, and for the irrigation of lawns and gardens. Stock wells supply drinking water for livestock. On many farms both domestic and stock supplies are obtained from one well, which generally is a dug or drilled well equipped with a cylinder pump and a windmill. Most of the wells are shallow, ranging in depth from about 20 feet to about 50 feet. The water is hard, but is satisfactory for domestic and stock use.
In the upland area that borders the valley, water supplies are difficult to obtain and ponds are used extensively to supply livestock with water. In this part of the area many domestic supplies are obtained from shallow alluvial wells in small tributary valleys and are supplemented with rain water that is stored in cisterns. During periods of extended drought, water is hauled from wells in the valley.
Railroad and Industrial Supplies
Several wells in the North Solomon Valley are used for railroad supplies. The wells obtain water from the alluvial sand and gravel that underlie the low terrace and flood plain surfaces.
Missouri Pacific Railroad Co. well at Downs--At Downs the Missouri Pacific Railroad is supplied with water from well 6-11-28a1. This is a gravel-walled well constructed by the Layne-Western Co. in 1938. It is 57 feet deep and had a static water level 36.5 feet below the surface in December 1940. The well is cased with 12-inch metal casing and is equipped with a turbine pump rated at 100 gallons per minute and powered by an electric motor. In 1946, an average of 805,000 gallons of water a month was pumped from this well. The water is treated with lime and soda ash to soften it for boiler use.
Well 6-11-28a2 is a gravel-walled well near well 6-11-28a1. It was constructed by Layne-Western Co. in 1936 and when completed had a drawdown of 5 feet after being test-pumped at 70 gallons per minute for 3 hours. The well was abandoned because it failed to supply the amount of water required by the railroad.
Missouri Pacific Railroad Co. well at Harlan--A drilled well (5-13-22ad1) supplies the Missouri Pacific Railroad at Harlan. This well was constructed in 1921 and is reported to be 60.5 feet deep and to have a static water level of 47 feet below the land surface. It is cased with 10-inch steel casing and is equipped with a cylinder pump powered by a 7-horsepower gasoline engine. An average of 60,000 gallons of water per month was pumped from this well in 1946. The water is hard but is not treated.
Chicago, Rock Island, and Pacific Railroad Co. wells at Glade--The Chicago, Rock Island, and Pacific Railroad has four wells (4-18-26da1, -26da2, -26da3, and -26da4) in the North Solomon Valley near Glade in southern Phillips County. Water from these wells is pumped about 6 miles to the railroad yards at Phillipsburg. Prior to the construction of the Phillipsburg municipal wells in the Solomon Valley in 1944, the railroad furnished the city with part of its water supply. The oil refinery of the National Co-operative Refinery Association at Phillipsburg obtains its water supply from the railroad wells.
Table 5--Pumpage of ground water in North Solomon Valley for railroad and industrial use
| Location | Number of wells |
Railroad | Annual pumpage, million gallons |
|---|---|---|---|
| Downs | 1 | Missouri Pacific | 9.7 |
| Glade | 4 | Chicago, Rock Island, and Pacific* | 120.0 |
| Harlan | 1 | Missouri Pacific | 0.7 |
| Total | 130.4 | ||
| * Sells water to National Co-operative Refinery Association at Phillipsurg. | |||
Table 6--Pumpage of ground water in North Solomon Valley for municipal use
| City | Number of wells |
Population (1950 census) |
Annual pumpage, million gallons |
|---|---|---|---|
| Downs | 4 | 1,221 | 42.4 |
| Gaylord | 2 | 231 | 4.4 |
| Kirwin | 1 | 374 | 19.1 |
| Logan | 3 | 859 | 30.0 |
| Phillipsburg | 3 | 2,589 | 29.7 |
| Portis | 1 | 286 | 44.0 |
| Smith Center | 3 | 2,026 | 69.9 |
| Speed | 1 | 70 | 2.2 |
| Totals | 18 | 7,656 | 201.7 |
Two of the railroad wells are located on the north side of the river and are reported to be 43 feet deep and to have a static water level of 34 feet. They have been in use for several years. The two wells on the south side of the river were constructed in 1940 and 1943. They are gravel-packed, have 18-inch concrete casing, are 53 feet deep, and had a static water level of 22.5 feet in June 1946. Well 4-18-26da4 had a drawdown of 23 feet when pumped for 24 hours at the rate of 275 gallons per minute in June 1943. A log of this well is included among the logs of wells and test holes. All four wells are equipped with turbine pumps powered by electric motors. Water is pumped into an underground reservoir on the north side of the river and then through a 6-inch pipeline to Phillipsburg. Water for steam boilers is softened with lime and soda ash at Phillipsburg. Raw water is furnished by the railroad to the refinery of the National Co-operative Refinery Association, where it is softened before use. The refinery also treats the water for algae and acidulates the water in the cooling pits before recirculating it. The railroad uses water at an average rate of about 3.1 million gallons per month and the refinery, when operating at normal capacity, uses water at the average rate of about 6.8 million gallons per month. The amount of water pumped is the greatest for any installation in the area.
Municipal Supplies
Eight cities obtain municipal water supplies from sand and gravel in the alluvium and the terrace deposits in the North Solomon Valley. With the exception of Phillipsburg and Smith Center, these cities are situated in the valley. Phillipsburg pumps water 6 miles from wells near GJade and Smith Center pumps water 10 miles from wells near Gaylord. Chemical analyses of water from each municipal supply are given in Table 7.
Logan--Water for Logan (population 859, 1950 census) is supplied by three shallow wells (4-20-34ca1, -34ca2, -34ca3) in the terrace deposits. A log of well 4-20-34ca3, which was dug in 1932, is included among the well logs. The other two wells were dug in 1937. All the wells are gravel packed with 20-inch copper alloy casing. They are reported to be 65 feet deep, with a static water level 30 feet below land surface. Elich is equipped with an electricpowered turbine pump rated at 150 gallons per minute. No data on the yield or drawdown were available. Water is pumped directly into the city mains; any excess goes into an 80,000-gallon elevated steel storage tank.
The average monthly consumption of water is reported to be about 2.5 million gallons, of which the Missouri Pacific Railroad uses about 0.2 million gallons. The water is hard but otherwise is of good quality.
Speed--Speed (population 70) is supplied by a gravel-packed well (4-19-25cb). The well is reported to be about 30 feet deep and to obtain water from coarse alluvial material. It is equipped with a lift pump powered by an electric motor. Water is pumped directly into the mains. Storage is provided by an elevated steel tank having a capacity of 30,100 gallons. The average monthly consumption of water is about 183,000 gallons. The water is hard but is suitable for most domestic uses.
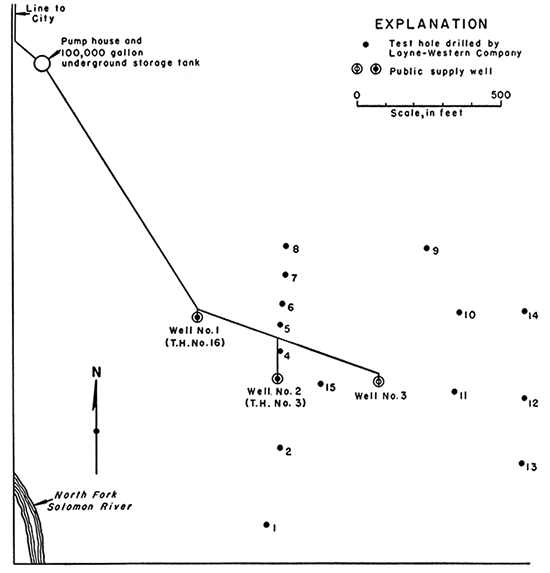
Phillipsburg--A large part of the Phillipsburg (population 2,589) water supply is obtained from three wells (4-18-26cc1, -26cc2, -26cc3) in the North Solomon Valley, 1 mile west and three-fourths mile south of Glade. Sixteen test holes were drilled in the alluvium in 1944 to determine the best location for the wells. Figure 13 shows the locations of these test holes and wells, and of the pumping station in the well field. Logs of the wells and test holes are given in the records of logs. The wells were drilled and put into use in the summer of 1944. All are gravel-packed with 12-inch casing and 10 feet of slotted casing set opposite the coarser material. Each is equipped with a turbine pump powered by an electric motor.
Figure 13--Phillipsburg well field showing locations of wells and test holes drilled by Layne-Western Co. (Modified from a map of Wilson and Co.)
Well 4-18-26cc1 (no. 1) is 57 feet deep with a static water level 17 feet below land surface (Pl. 10B). The well is reported to yield 175 gallons per minute with a drawdown of 35 feet after 8 hours of pumping. Well 4-18-26cc2 (no. 2) is 53 feet deep and has a static water level of 14 feet. The yield is reported to be 200 gallons per minute with 38 feet of drawdown after 8 hours of pumping. Well 4-18-26cc3 (no. 3) is 56 feet deep and has a static water level of 15 feet. At the end of an 8-hour pumping test, the drawdown was 36 feet at a pumping rate of 200 gallons per minute.
All wells discharge into a 100,000-gallon underground reservoir in the northwest corner of the well field. Water is pumped from this reservoir through an 8-inch pipeline to the water plant at Phillipsburg. Storage is provided by a 110,000-gallon elevated steel storage tank and at the water plant by a 210,000-gallon underground tank. Total monthly consumption of water by the city of Phillipsburg averages about 4.5 million gallons of which 2.5 million gallons comes from the wells in North Solomon Valley and the remainder from wells in the city. The water is hard, but otherwise is of good quality.
Kirwin--The water supply of Kirwin (population 374) is obtained from a bored well (4-16-27 ca) that penetrates the coarse material underlying the low terrace surface. The well is said to be 70 feet deep and is cased with 18-inch concrete casing. It is equipped with a turbine pump powered by an electric motor. Water is pumped directly through the mains into an elevated steel storage tank that has a capacity of 75,000 gallons. The average monthly consumption of water is 1.6 million gallons, of which the railroad uses 124,400 gallons. According to the State Board of Health, the water has a total hardness of 405 parts per million and a chloride content of 50 parts per million.
Figure 14--Smith Center well field showing locations of wells and test holes.
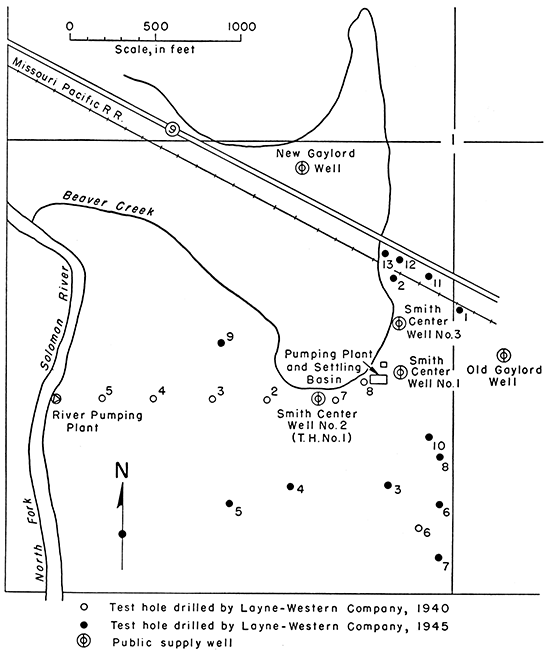
Smith Center--Smith Center (population 2,026) is supplied with water from three wells (5-14-1ca2, -1cd1, and -1cd2) near Gaylord, which penetrate terrace sand and gravel in the North Solomon Valley. Figure 14 shows the location of the wells and the test holes that were drilled in 1940 and 1945. Logs of the test holes are given in the records of logs. Water is piped to the city through the pipeline that was laid when a river pumping plant (no longer used) was built on North Solomon River.
Well 5-14-1cd1 (Smith Center well no. 1) is a 12-inch drilled well equipped with a turbine pump powered by an electric motor. Discharge is into a settling basin, from which water is repumped through the pipeline to Smith Center. The well is used only in case of fire or other emergency. Well 5-14-1cd2 (Smith Center well no. 2) is a gravel-packed well 68 feet deep, which had a static water level of 34 feet in 1940. It has a 10-inch casing and is equipped with a turbine pump powered by an electric motor. The water is pumped directly into the pipeline. Well 5-14-1ca2 (Smith Center well no. 3) is a gravel-packed well 70 feet deep, which has a static water level 43 feet below land surface. It has a 10-inch metal casing, with 10 feet of bronze shutter screen opposite the coarser material. The well is equipped with an electrically powered turbine. When pumped at a rate of 323 gallons per minute during a 4-hour pumping test in 1940, the drawdown was 21 feet. The well discharges directly into the pipeline.
Gaylord--Gaylord (population 231) obtains its water supply from two wells drilled into the low terrace deposits. Well 5-14-1db ( old well) is an 8-inch bored well with a reported depth of 70 feet. It is equipped with a turbine pump powered by an electric motor. Well 5-14-1ca1 (new well) is a gravel-walled well drilled during the summer of 1946. It has a 17-inch casing and is equipped with a turbine pump. Water from both wells is pumped directly into the city mains; the excess goes to a 50,000-gallon elevated steel storage tank located on the hill at the north side of the city. The average monthly consumption of water is about 466,000 gallons. The water is hard but is suitable for most domestic uses.
Portis--The water supply of Portis (population 286) comes from a dug well (6-12-5cb), which taps the sand and gravel underlying the low terrace. The well is 61 feet deep, the lower 8 feet penetrating the Carlile shale. The static water level is 47.51 feet below land surface. The well is equipped with an electrically powered turbine pump, which discharges directly into the city mains; the excess water goes into a 40,000-gallon elevated steel storage tank. Consumption is at an average rate of 417,000 gallons per month. The water is hard but otherwise of good quality.
Downs--The city of Downs (population 1,221) obtains its water supply from four wells (6-11-27c, -28d1, -28d2, -28d3) which penetrate the coarse terrace material. Well 6-11-27c is a gravel-walled well half a block south and one block east of the city pump house. It is reported to be 62 feet deep; the static water level in May 1946 was 24 feet below land surface. Well 6-11-28d1, at the city pump house, is an old dug well which is reported to be 49 feet deep and to have penetrated 15 feet of coarse sand and gravel. Well 6-11-28d2 is half a block south and one block west, and well 6-11-28d3 is half a block north and one block west of the pump house. Both are gravel-walled and are reported to be 50 feet deep.
All wells are equipped with turbine pumps powered by electric motors. The water is pumped directly into the mains, the excess water going to a 230,000-gallon steel standpipe reservoir at the north edge of the city. An average of about 3.6 million gallons per month was pumped during 1946. The water is hard but is suitable for most purposes.
Chemical Character of the Water
By Walton H. Durum
Introduction
Water charged with carbon dioxide from the atmosphere infiltrates the soil and dissolves mineral salts and organic substances. The mineral matter that goes into solution is called the dissolved solids. The relation of the mineral content of ground water to the mineral composition of rocks depends on such factors as the chemical character of the influent water, the chemical character of the geologic formations through which the water passes, and the rate of movement of the water in the aquifer.
The analytical results in Tables 7 and 8 show that the major constituents in ground water in the North Solomon Valley are the cations calcium, magnesium, sodium, and potassium; and the anions bicarbonate, sulfate, chloride, and nitrate. Determinations were also made for carbonate, iron, fluoride, and boron, which are present in smaller quantities.
Calcium, the predominant basic ion in the water, and magnesium cause hardness. Hardness in water is recognized both by the quantity of soap that is required to produce a lather and by an insoluble curd that is formed during washing. Water with a hardness of less than 50 parts per million is soft. A hardness of 50 to 150 parts per million increases the consumption of soap and causes considerable scale in boilers. Hardness above 150 parts per million can be easily detected. Where softening treatment is used for municipal supplies, the hardness is generally reduced to about 100 parts per million. Ground-water samples from the North Solomon Valley had a calcium content of 63 to 235 parts per million and a magnesium content of 9.6 to 31 parts per million. Total hardness, as CaCO3, ranged from 234 to 702 parts per million.
Sodium and potassium receive most attention in water supplies to be used for irrigation. A high percentage of sodium (equivalents per million of sodium divided by equivalents per million of total cations) is undesirable in an irrigation supply. The quantities of sodium and potassium were low in the samples that were analyzed, ranging from 5.0 to 154 parts per million. The percentage of sodium ranged from 4 to 55; in all but two samples it was less than 30.
Bicarbonate, the predominant anion in the ground water in this area, and carbonate cause the alkalinity of the water. The concentration of bicarbonate ranged from 290 to 597 parts per million.
Sulfate, chloride, and nitrate, combined with calcium and magnesium, cause permanent hardness in water. The concentrations in water samples from the North Solomon Valley were: Sulfate, 19 to 359; chloride, 1.5 to 119; and nitrate, 0-3 to 400 parts per million. One sample had no nitrate.
Fluoride in small quantities helps prevent tooth decay but in concentrations that exceed 1.5 parts per million may cause pitting or discoloration of children's teeth. Waters that were analyzed in this area had fluoride contents of 0.1 to 1.4 parts per million; only two samples had more than 0.5 part per million.
Ground water in the North Solomon Valley has a low boron content, ranging from 0.02 to 0.44 part per million in 17 samples; one sample had no boron. Irrigation water that contains more than 2.0 parts per million may adversely affect the growth of certain crops, particularly fruit and nuts.
Although ground water may contain considerable iron, most of the iron is precipitated when exposed to air and causes an unpleasant discoloration of the water. Iron in concentrations that exceed 0.3 part per million causes stains on porcelain fixtures and clothing. The total iron concentration was determined for five water samples from the terrace deposits. Of these, three samples contained more than 0.3 part per million, and the iron content of one sample (from well 6-12-23aa) was 25 parts per million.
Mineral Character of the Ground Water
Analyses, in parts per million, of ground-water samples from the North Solomon Valley are given in Tables 7 and 8. In Table 8 the wells sampled are listed under geologic source. Factors for converting parts per million of mineral constituents to equivalents per million are given in Table 9. The waters analyzed were from wells that ranged in depth from 22.8 to 110.7 feet. The geologic source of some of the water samples was difficult to determine because the well records were incomplete. If several water-bearing strata are penetrated in drilling a well, a sample taken from the well does not represent a particular formation but is probably a mixture of water from two or more sources.
Table 7--Analyses of water from municipal S1spplies in North Solomon Valley Analyzed by Howard Stoltenberg. Dissolved constituents given in parts per million.a
| Municipal Supply | Geologic source | Date of collection |
Temp. (°F) |
Dissolved solids |
Silica (SiO2) |
Iron (Fe) |
Calcium (Ca) |
Magnesium (Mg) |
Sodium and potassium (Na+K) |
Bicarbonate (HCO3) |
Sulfate (SO4) |
Chloride (Cl) |
Fluoride (F) |
Nitrate (NO3) |
Hardness as CaCO3 | ||
|---|---|---|---|---|---|---|---|---|---|---|---|---|---|---|---|---|---|
| Total | Carbonate | Noncarbonate | |||||||||||||||
| Logan | Terrace deposits | Sept. 29, 1947 | 637 | 22 | 4.0 | 133 | 19 | 61 | 422 | 87 | 73 | 0.4 | 2.4 | 410 | 346 | 64 | |
| Speed | Terrace deposits | Sept. 10, 1946 | 545 | 25 | .36 | 128 | 13 | 27 | 329 | 121 | 19 | .3 | 8,9 | 373 | 270 | 103 | |
| Phillipeburg | Alluvium | June 10, 1947 | 639 | 23 | .86 | 125 | 22 | 40 | 349 | 128 | 40 | .3 | 16 | 402 | 286 | 116 | |
| Kirwin | Terrace deposits | Jan. 22, 1947 | 718 | 34 | 0 | 126 | 22 | 86 | 437 | 137 | 50 | .1 | 26 | 405 | 358 | 47 | |
| Smith Center | Terrace deposits | June 5, 1947 | 770 | 31 | 6.7 | 131 | 21 | 88 | 497 | 151 | 27 | ,2 | 1.3 | 414 | 407 | 7 | |
| Gaylord | Terrace deposits | Aug. 26, 1947 | 738 | 38 | 5,6 | 120 | 19 | 96 | 486 | 131 | 36 | .2 | 1.5 | 378 | 378 | 0 | |
| Portis | Terrace deposits | Sept. 5, 1946 | 588 | 41 | 2,8 | 102 | 17 | 80 | 454 | 72 | 35 | .2 | 2.0 | 324 | 324 | 0 | |
| Downs | Terrace deposits | Nov. 26. 1946 | 442 | 28 | .03 | 101 | 11 | 34 | 339 | 42 | 23 | .2 | 21 | 297 | 278 | 19 | |
| a. One part per million is equivalent to one pound of substance per million pounds of water or 8.33 pounds per million gallons of water. | |||||||||||||||||
Table 8--Mineral constituents, in parts per million, and related physical measurements of waters in North Solomon Valley
| Source and well number |
Date of collection |
Depth of well (feet) |
Temp. (°F) |
pH | Specific conductance (micromhos at 25°C) |
Silica (SiO2) |
Iron (Fe) |
Calcium (Ca) |
Magnesium (Mg) |
Sodium and potassium (Na+K) |
Potassium (K) |
Carbonate (CO3) |
Bicarbonate (HCO3) |
Sulfate (SO4) |
Chloride (Cl) |
Fluoride (F) |
Nitrate (NO3) |
Boron (B) |
Dissolved solids |
Hardness as CaCO3 |
Percent sodium |
|
|---|---|---|---|---|---|---|---|---|---|---|---|---|---|---|---|---|---|---|---|---|---|---|
| Total | Noncarbonate | |||||||||||||||||||||
| Recent alluvium: | ||||||||||||||||||||||
| 4-19-35ab | Mar. 17, 1947 | 33.5 | 60 | 7.5 | 1,010 | 144 | 20 | 35 | 0 | 313 | 198 | 38 | 0.4 | 0.6 | 0.00 | 653 | 442 | 185 | 15 | |||
| 5-15-2bc | Mar. 18, 1947 | 22.8 | 58 | 8.7 | 766 | 121 | 16 | 35 | 0 | 325 | 131 | 16 | .2 | 25 | .06 | 553 | 368 | 101 | 15 | |||
| Terrace deposits: | ||||||||||||||||||||||
| 4-14-29cc | Mar. 18, 1947 | 37.1 | 60 | 7.5 | 1,210 | 201 | 29 | 43 | 0 | 597 | 107 | 37 | .1 | 75 | .09 | 895 | 621 | 131 | 13 | |||
| 4-14-34bc | Mar. 18. 1947 | 46.2 | 57 | 7.9 | 1,470 | 213 | 21 | 83 | 0 | 311 | 50 | 119 | .3 | 400 | 1,040 | 618 | 363 | 23 | ||||
| 4-14-36bd | Mar. 18, 1947 | 30.3 | 58 | 8.1 | 787 | 106 | 18 | 52 | 8 | 325 | 132 | 25 | .2 | 6.5 | .06 | 551 | 338 | 65 | 25 | |||
| 4-16-20da | Mar. 17, 1947 | 55.7 | 59 | 7.6 | 1,050 | 104 | 31 | 76 | 0 | 422 | 166 | 22 | .4 | 4.0 | .08 | 671 | 387 | 41 | 30 | |||
| 4-18-25ab | Mar. 17, 1947 | 42.0 | 58 | 7.4 | 620 | 83 | 13 | 31 | 0 | 332 | 42 | 7.5 | .4 | .0 | .02 | 385 | 261 | 0 | 20 | |||
| 4-18-30cc | Mar. 17, 1947 | 33.6 | 57 | 7.6 | 1,240 | 212 | 24 | 33 | 0 | 362 | 359 | 18 | .2 | 5.0 | .02 | 906 | 628 | 331 | 10 | |||
| 4-20-32db | Mar. 17, 1947 | 38.5 | 58 | 7.5 | 833 | 100 | 21 | 43 | 0 | 332 | 134 | 7.0 | .2 | 8.0 | .10 | 530 | 336 | 64 | 22 | |||
| 5-13-4dc | Mar. 18, 1947 | 42.6 | 60 | 7.5 | 1,490 | 235 | 28 | 91 | 0 | 520 | 233 | 78 | .2 | 150 | 1.080 | 702 | 276 | 22 | ||||
| 5-13-29aa | May 3, 1950 | 31.3 | 57 | 7.3 | 1,520 | 28 | 0.28 | 187 | 24 | 85 | 19 | 0 | 342 | 156 | 93 | .2 | 264 | .22 | 1,020 | 565 | 285 | 24 |
| 5-13-34aa | May 3, 1950 | 33.4 | 57 | 7.5 | 897 | 30 | .14 | 124 | 12 | 59 | 12 | 0 | 388 | 148 | 15 | .2 | 11 | .14 | 625 | 359 | 41 | 26 |
| 5-14-6dc | May 3, 1950 | 37.3 | 58 | 7.7 | 557 | 25 | .49 | 78 | 9.6 | 27 | 6.8 | 0 | 290 | 53 | 8.0 | .3 | 1.5 | .20 | 363 | 234 | 0 | 19 |
| 5-14-11da | May 3, 1950 | 50.0 | 56 | 8.4 | 943 | 28 | .42 | 132 | 16 | 53 | 7.6 | 18 | 302 | 187 | 32 | .3 | 18 | .20 | 694 | 396 | 118 | 22 |
| 6-12-23aa | Mar. 18, 1947 | 43.9 | 60 | 7.7 | 988 | 25 | 139 | 23 | 66 | 0 | 571 | 33 | 57 | .0 | 2.0 | 621 | 441 | 0 | 24 | |||
| 6-13-12ba | Mar. 18, 1947 | 47.7 | 59 | 7.6 | 787 | 112 | 14 | 52 | 0 | 373 | 86 | 34 | .0 | 5.0 | .11 | 526 | 337 | 31 | 25 | |||
| Crete member, Sanborn formation: | ||||||||||||||||||||||
| 4-16-30cc | Mar. 17, 1947 | 80.9 | 60 | 7.4 | 791 | 113 | 10 | 21 | 0 | 329 | 67 | 14 | .3 | 10 | .02 | 460 | 323 | 53 | 12 | |||
| 4-20-26cc | Mar. 17, 1947 | 51.4 | 58 | 7.8 | 581 | 94 | 12 | 5.0 | 0 | 310 | 20 | 1.5 | .3 | 10 | .02 | 351 | 284 | 30 | 4 | |||
| 5-13-23dd | Mar. 18. 1947 | 77.1 | 61 | 7.6 | 988 | 166 | 19 | 34 | 0 | 379 | 144 | 17 | .3 | 100 | .10 | 706 | 492 | 181 | 13 | |||
| 6-10-20aa | Mar. 18, 1947 | 36.1 | 59 | 7.7 | 702 | 122 | 10 | 12 | 0 | 313 | 19 | 41 | .1 | 45 | .06 | 485 | 346 | 89 | 7 | |||
| 6-11-24ad | Mar. 18. 1947 | 38.3 | 60 | 7.6 | 1,370 | 184 | 24 | 89 | 0 | 378 | 173 | 113 | .2 | 125 | 917 | 558 | 248 | 26 | ||||
| Niobrara formation: | ||||||||||||||||||||||
| 5-16-3bc | Mar. 17, 1947 | 110.7 | 59 | 7.7 | 1,210 | 63 | 29 | 154 | 0 | 464 | 140 | 57 | 1.4 | .3 | .44 | 697 | 276 | 0 | 55 | |||
| Surface water (low flow) at Kirwin: Discharge (sec.-ft.) |
||||||||||||||||||||||
| 35 | April 25, 1947 | 7.9 | 582 | .05 | 86 | 17 | 27 | 0 | 284 | 90 | 12 | .0 | .2 | 393 | 284 | 52 | 13 | |||||
| 8.0 | Aug. 20, 1948 | 7.8 | 376 | .02 | 56 | 8.5 | 14 | 0 | 198 | 34 | 4.0 | .3 | 1.7 | .00 | 254 | 175 | 13 | 15 | ||||
| 32 | May 2,1949 | 7.6 | 548 | .01 | 75 | 15 | 24 | 0 | 274 | 59 | 9.4 | .4 | 1.2 | 374 | 249 | 24 | 18 | |||||
| 12 | Sept. 20, 1949 | 8.1 | 583 | .02 | 92 | 17 | 16 | 0 | 276 | 90 | 10 | .4 | .5 | 413 | 300 | 74 | 11 | |||||
| Includes potassium (K) except where separate potassium analysis is reported. | ||||||||||||||||||||||
Table 9--Factors for converting parts per million of mineral constituents to equivalents per million
| Cation | Conversion Factor | Anion | Conversion Factor |
|---|---|---|---|
| Ca++ | 0.0499 | HCO3- | 0.0164 |
| Mg++ | 0.0822 | SO4-- | 0.0208 |
| Na+ | 0.0435 | Cl- | 0.0282 |
| NO3- | 0.0161 | ||
| F- | 0.0526 |
Table 10--Analyses, in parts per million, of water from the Recent alluvium
| Well number | Depth of well (feet) |
Dissolved solids |
Total hardness (CaCO3) |
Chloride | Nitrate | Percent sodium |
|---|---|---|---|---|---|---|
| 4-19-35ab | 33.5 | 653 | 442 | 38 | 0.6 | 15 |
| 5-15-2bc | 22.8 | 553 | 368 | 16 | 25 | 15 |
Table 11--Summary of chemical characteristics of 14 water samples collected from the terrace deposits.
| Parts per million | Number of samples | Parts per million | Number of samples | ||
|---|---|---|---|---|---|
| Dissolved solids |
Total hardness |
Chloride | Nitrate | ||
| 201-300 | 0 | 2 | 0-5.0 | 0 | 6 |
| 301-400 | 2 | 6 | 5.1-10 | 3 | 2 |
| 401-500 | 0 | 1 | 11-20 | 2 | 2 |
| 501-700 | 7 | 4 | 21-50 | 5 | 0 |
| 701-1,000 | 2 | 1 | 51-100 | 3 | 1 |
| More than 1,000 | 3 | 0 | More than 100 | 1 | 3 |
Twenty-two water samples were collected from four geologic sources: the alluvium, the terrace deposits, the Crete member of the Sanborn formation, and the Niobrara formation (Fig. 15). The principal mineral constituents, in equivalents per million, are shown diagrammatically in Figure 16. The total hardness, as CaCO3, in parts per million, is read from the right ordinate at the top of the magnesium column. The relation of several mineral constituents to total mineralization, expressed as specific conductance in micromhos, is shown in Figure 17. Dissolved solids, hardness, and calcium plus magnesium show linear trends when plotted against specific conductance. This relationship is constant for low-sodium waters from the alluvium, terrace deposits, and Crete deposits. The high-sodium water from the Niobrara formation does not follow the same linear trend.
Figure 15--Ground- and surface-water sampling points in the North Solomon Valley.
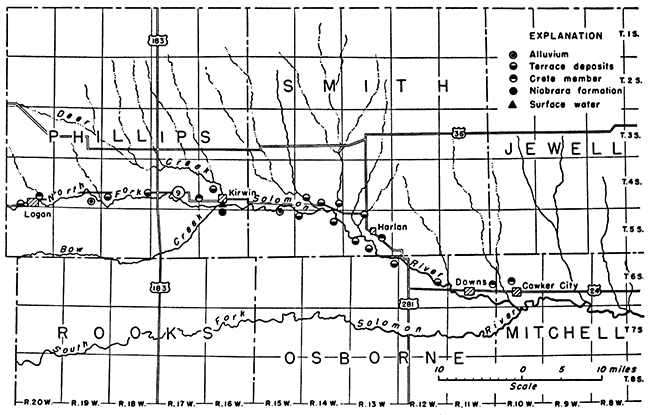
Figure 16--Mineral constituents of ground water from representative wells, North Solomon Valley. For hardness, as CaCO3 in parts per million, read from top of magnesium column on hardness scale at left.
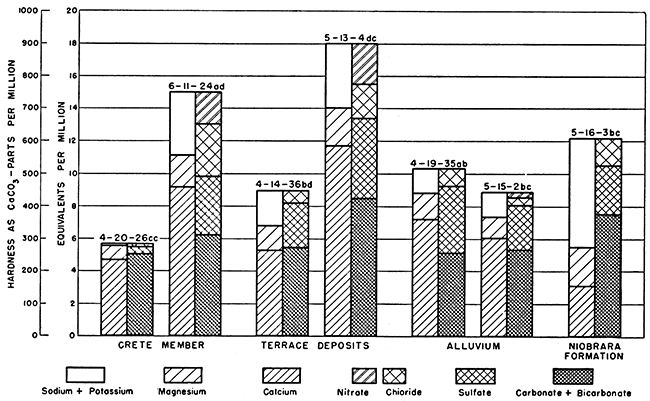
Figure 17--Relation of mineral constituents to specific conductance in ground water from North Solomon Valley.

Recent Alluvium--Table 10 gives the well depth and concentrations of several mineral constituents for two samples that were collected from wells in the Recent alluvium.
The water from the alluvium is hard and moderately high in mineral content. Calcium bicarbonate is the principal dissolved mineral and causes the excessive hardness of the water. The sample from well 5-15-2bc had 25 parts per million nitrate (as NO3) and was probably contaminated by surface drainage. High nitrate concentrations and correspondingly high chlorides in water may be an indication of pollution from sewage or drainage from barnyards. Another source of nitrate has been discussed by Frye and Leonard (1949, p. 81); wells near fields of alfalfa or other nitrate-producing legumes might receive nitrate from recharge waters percolating through the soil. They concluded that differences in nitrate concentrations in ground water in the area of investigation were not related to geologic formations.
Terrace deposits--Fourteen water samples were collected from wells that penetrate the terrace deposits. Their chemical characteristics are summarized in Table 11.
Water in the terrace deposits is similar in chemical character to the water in the alluvium, but several samples had a higher mineral concentration. It is difficult to compare the results obtained in the two stratigraphic units because of the limited sampling in the alluvium. Three water samples from the terrace deposits contained more than 1,000 parts per million dissolved solids, and nine samples contained between 501 and 1,000 parts per million. Total hardness ranged from 234 to 702 parts per million and averaged 445 parts per million. The percentage of sodium was low, and all the water was suitable for irrigation (Fig. 18). Four samples contained more than 45 parts per million of nitrate (as NO3); one of these had 400 parts. Three samples were from shallow dug wells (4-14-29cc, 4-14-34bc, and 5-13-4dc) of large diameter and porous wall construction. These samples also contained relatively high chloride concentrations, which suggest that the high nitrate content was due to contamination by surface drainage. Corrals near wells 4-14-34bc and 5-13-4dc were possible sources of contamination.
Figure 18--Classification as irrigation supplies of ground water from North Solomon Valley. (After Wilcox, 1948.)

Sanborn formation, Crete member--Samples of water were collected from five wells that penetrate the Crete member of the Sanborn formation. Table 12 gives a summary of the concentration of mineral constituents in water from these wells.
Table 12--Summary of chemical data from five water samples collected from the Crete member of the Sanborn formation
| Parts per million | Number of samples | Parts per million | Number of samples | ||
|---|---|---|---|---|---|
| Dissolved solids |
Total hardness |
Chloride | Nitrate | ||
| 201-300 | 0 | 1 | 0-5.0 | 1 | 0 |
| 301-400 | 1 | 2 | 5.1-10 | 0 | 2 |
| 401-500 | 2 | 1 | 11-20 | 2 | 0 |
| 501-700 | 0 | 1 | 21-50 | 1 | 1 |
| 701-1,000 | 2 | 0 | 51-100 | 0 | 0 |
| More than 1,000 | 0 | 0 | 1 More than 100 | 1 | 2 |
Ground water in the Crete deposits is similar in mineral composition and concentration to water in the alluvium and terrace deposits. All water samples were hard, were calcium bicarbonate in type, and had a low percentage of sodium. Two samples were high in nitrate; water from wells 5-13-23dd and 6-11-24ad had 100 and 125 parts per million of nitrate, respectively. The water from well 6-11-24ad also contained 113 parts per million chloride and was probably contaminated with surface seepage from a near-by corral. The high-nitrate concentration in water from well 5-13-23dd could be due to some other cause.
Niobrara formation--One sample of water was collected from a well (5-16-3bc) that penetrates the Niobrara formation. This water differed in composition from samples obtained from the unconsolidated deposits, although it is similar in total mineral content. The water was softer than the other water samples analyzed and had a hardness of 276 parts per million. Apparently, this water had been softened by the action of natural zeolites. The Huoride content (1.4 parts per million), boron (0.44 part per million), and the percentage of sodium (55) were the highest for any of the water samples analyzed.
Mineral Character of the Surface Water
Chemical analyses of four samples of water that were taken during periods of low flow from North Solomon River at Kirwin are given in Table 8. The calcium bicarbonate composition of the river water is similar to that of the ground water that was sampled in the area (Fig. 17). Concentrations of dissolved solids ranged from 254 parts per million for a flow of 8 second-feet to 413 parts per million for a flow of 12 second-feet. The low-nitrate content of the surface-water samples suggests that nitrate in the ground water is not related to the geology of the area. The concentrations of bicarbonate, sulfate, chloride, and calcium were also lower than are generally found in the ground water.
Relation of Quality to Use
Water samples were collected for analysis from 22 wells. Thirteen of the 22 furnished water for domestic and stock use, 3 for domestic use only, and 6 for stock use only.
Most of the analyzed water samples had amounts of the chemical constituents that fall within the limits recommended by the U. S. Public Health Service (1946, pp. 371-384) for public water supplies:
| Constituent | Maximum parts per million |
|---|---|
| Total iron and manganese (together) | 0.3 |
| Magnesium | 125 |
| Sulfate | 250 |
| Fluoride | 1.5 |
| Chloride | 250 |
| Dissolved solids | 500 (1,000 permitted) |
Limits of nitrate in water for domestic use are not well established. Comly (1945, pp. 112-116) suggests that water containing 45 to 90 parts per million nitrate (as NO3) is dangerous for use in infant feeding. Water containing more than 90 parts per million nitrate is likely to cause infant cyanosis. Apparently, older children, adults, and domestic animals are not affected by nitrate in drinking water. Six of the water samples that were analyzed contained more than 45 parts per million nitrate, and five samples contained more than 90 parts per million.
The percentage of sodium and the electrical conductivity of the water have been used by Wilcox (1948, p. 27) as a basis for rating water for irrigation. Table 13 gives the permissible limits.
Table 13--Permissible limits for electrical conductivity and percentage of sodium of several classes of irrigation water
| Classes of water | Electrical conductivity (micromhos at 25° C.) |
Percent sodium | |
|---|---|---|---|
| Rating | Grade | ||
| 1 | Excellent | Less than 250 | Less than 20 |
| 2 | Good | 250- 750 | 20-40 |
| 3 | Permissible | 750-2,000 | 4(H)0 |
| 4 | Doubtful | 2,000-3,000 | 60-80 |
| 5 | Unsuitable | More than 3,000 | More than 80 |
In Figure 18 the percentage of sodium for the water samples from the North Solomon Valley is plotted against electrical conductivity on a reproduction of Wilcox's diagram. The area in which the plotted point falls designates the quality classification of the water. Although none of the wells are presently supplying water for irrigation, all the water samples analyzed fall into the "good to permissible" classification.
Summary of Chemical Characteristics
The samples of ground water from the alluvium, terrace deposits, and Crete sand and gravel member of Sanborn formation were calcium bicarbonate waters of similar composition. They were moderately high in mineral content and were hard. The sample from the Niobrara formation was of sodium bicarbonate type and had a higher content of boron and fluoride than the other samples. Several samples contained excessive amounts of nitrate; this suggests contamination by surface drainage. All samples rated at least "good to permissible" for irrigation use.
Low-flow surface waters had a chemical composition similar to the ground water in the area, but they had lower mineral concentration.
Irrigation
Successful agriculture requires that the moisture supply be sufficient to mature growing plants. In any area where the precipitation during the growing season does not supply the amount of moisture needed by crops, some supplementary water must be added if the crops are to mature. In the North Solomon Valley precipitation normally is great enough to supply this demand adequately; however, periods of drought have been recurrent in this area. During such periods, interest in irrigation increases rapidly.
History of Irrigation
Although the North Solomon Valley is well suited for irrigation, it has been practiced very little. Numerous attempts to locate artesian water in the Dakota formation have produced only salt water. Shallow alluvial wells are used to irrigate small garden tracts, but only one attempt to utilize ground water for irrigation has been reported. Mr. J. A. Ifland of Gaylord reports that in the first part of the century a dug well in Beaver Creek Valley was used to irrigate about 40 acres of alfalfa. This project was abandoned after a few years. More recently, several attempts have been made to utilize surface water from North Solomon River and its principal tributaries (Table 14). The small flow of the river in drought seasons has handicapped these projects. In the summer of 1946, a well for irrigation purposes (5-13-18db) was drilled by Otto Meier. No pumping test has been made on the well and no attempt has been made to use it for irrigation.
Table 14--Surface-water supplemental irrigation plants in North Solomon Valley, 1946.
| Date use started |
Operator | Point of division | County | Maximum annual use acre-feet |
Pumping capacity, gallons per minute |
Acreage irrigated |
Remarks |
|---|---|---|---|---|---|---|---|
| 1928 | Clarence Billings | SE SE sec. 28, T. 4 S., R. 17 W. | Phillips | 33 | 1,100 | 22 | |
| 1928 | A. W. Gibbs | SW SE sec. 26, T. 4 S., R. 18 W. | Phillips | 8 | 450 | 5 | |
| 1941 | Bartlett & Thompson | SW NW sec. 10, T. 4 S., R. 17 W. | Phillips | 40 | 2,000 | 30 | Water from Deer Creek. |
| 1936 | Martin Tanis | N/2 SW sec. 24, T. 5 S., R. 11 W. | Smith | 132 | 500 | 122 | Water from Oak Creek. |
| 1938 | Albert Dannenberg | NE NE sec. 19, T. 5 S., R. 13 W. | Smith | 10 | 350 | 12 | |
| 1930 | A. G. Tack | NW SW sec. 20, T. 5 S., R. 13 W. | Smith | 43 | 350 | 45 | |
| 1930 | W. H Weiser | SW NW sec, 21, T. 5 S., R. 13 W. | Smith | 16 | 250 | 10 | Last used for irrigation in 1942. |
| 1938 | J. O. Grisier | NE sec. 2, T. 5 S., R. 14 W. | Smith | 36 | 350 | 25 | |
| 1940 | B. W. Verhage | SW sec. 27, T. 6 S., R. 11 W. | Osborne | 86 | 2.000 | 100 | . Owner, J. Rieman. |
| 1937 | B. W. Verhage | NW SW sec, 33, T. 6 S., R. 11 W. | Osborne | 147 | 2,000 | 117 | Several owners. |
| 1940 | Aaron Fink | SW SW sec. 14, T. 6 S., R. 12 W. | do | 77 | 1,250 | 50 | |
| 1939 | Ernest McClain | NW NW sec. 1, T. 6 S., R. 13 W. | Osborne | 100 | 2,000 | 80 | Owner, Mary Staalduine. |
| 1945 | Linn S. White | NE NW sec. 26, T. 6 S., R. 11 W. | Osborne | 95 | 1,000 | 50 | Under construction 6-28-1945. |
| Totals | 823 | 668 |
Surface-water Irrigation
According to the records of the Kansas State Board of Agriculture, the first use of surface water for irrigation in this area was in 1928 when two pumping plants were established on North Solomon River in Phillips County. Two more were established in Smith County in 1930, but it was the prolonged drought of the 1930's that stimulated interest in irrigation. Several more pumping plants were put into operation, and by 1946, 13 had been established in this area. Table 14 lists these plants and shows the acreage irrigated and the amount of water allotted to each plant annually. The heavy precipitation of the past few years has made supplemental irrigation unnecessary and most plants have not been operated regularly. The crops most frequently grown on irrigated land are alfalfa, corn, and forage crops; wheat is occasionally irrigated.
Most pumping plants draw water from the river with a centrifugal pump powered with a stationary engine or tractor. Water is forced up to the level of the Kirwin terrace surface, where a series of canals carries it to the field. The amount of water allotted ranges from 0.86 acre-foot to 1.9 acre-feet per acre; the average is about 1.3 acre-feet per acre. If all plants were operated to capacity, 823 acre-feet of water would be withdrawn from North Solomon River and its tributaries to irrigate 668 acres. Plate lOA shows part of Aaron Fink's pumping plant in operation during the spring of 1946.
The use of surface water for irrigation during seasons of subnormal precipitation is apparently a profitable procedure, as the number of pumping plants has increased in the past decade. The greatest disadvantage of using stream water for irrigation is that during periods of drought, when irrigation is most necessary, the stream flow may be too low.
Possibilities for Ground-water Irrigation
Fine to coarse alluvial material of moderate thickness underlies the valley of North Solomon River at shallow depth. In many places this material is not well sorted and the transmissibility is not high. Data furnished by the cities that have attempted to get municipalwater supplies along the valley and data from the test-drilling program indicate that the saturated material is not thick enough nor coarse enough for the development of wells with high yields. The greatest yield reported from the wells for which hydrologic data are given in Table 4 is 323 gallons per minute and the highest specific capacity is 16.7 gallons per minute per foot of drawdown. An irrigation well should have a yield of nearly twice that amount. The saturated material becomes less coarse in a downstream direction, where the valley gradient decreases and where the Cretaceous fine-grained chalk and shale replace the conglomeratic Ogallala formation as the bedrock along the valley walls.
The possibility of obtaining artesian water from the underlying Dakota formation for irrigation does not seem feasible, as wells in the area drilled to this formation tapped salt water. The water in the Dakota is judged to be highly mineralized throughout this area.
Irrigation Problems
Irrigation with ground water in this area creates several problemsOne is the problem of subsurface drainage for the irrigation water that is not used by plants. If subsurface drainage is inadequate, the soil may become waterlogged and unfit for crops.
Under natural conditions the proposed Kirwin irrigation district, which lies largely on the Kirwin terrace surface, has good subsurface drainage. The water table is in the coarser part of the terrace deposits and lies 30 to 40 feet below the land surface. Some of the precipitation on the terrace percolates downward to the water table, thus indicating that no widespread impervious beds occur above the water table.
In the eastern part of the irrigation area, where steep slopes on the Carlile shale form the valley sides, weathered shale material, in the form of heavy clay, has been deposited on the terrace surface by colluvial processes. This material is impermeable, and as water penetrates very slowly to the lower part of the soil in these local areas, serious drainage problems probably will occur.
The upper part of the terrace deposits consists of silt and sandy silt. Where these deposits are exposed, thin lenses of silty clay are interstratified with the silts. If large quantities of water are added to the land surface during irrigation, much of the colloidal material may be removed from the soil, moved downward through the silty layers, and be concentrated along the clay layers. This may also result in the local development of waterlogged areas.
Although natural drainage conditions are good, the danger of waterlogging is inherent in any irrigation development in this area. A detailed observation-well program is recommended to determine the seasonal fluctuation of the water table and to detect any areas where abnormal changes of the water table occur. If such a program were maintained during the early period of irrigation, any rise in the water table due to this alteration of natural conditions could be noted.
Another problem is a form of inhibited drainage, which may be termed temporary waterlogging. In the more arid regions, where irrigation is practiced extensively, almost no rainfall occurs during the crop-growing season. In the subhumid region, which includes the area discussed in this report, considerable rainfall occurs during the growing season when irrigation would be in progress. Much of this rainfall comes in heavy storms when several inches of rain may fall in a short period of time. If several inches of rain should fall immediately after the soil of an area had been saturated with several inches of irrigation water, the upper soil might be temporarily waterlogged, or water might even stand on the land surface long enough to damage the soil severely and destroy the crops in that area. Thus, temporary waterlogging in this area of moderate rainfall during the growing season is a definite hazard to be considered in the planning of irrigation.
Prev Page--Geology || Next Page--Well Records
Kansas Geological Survey, Geology
Placed on web May 24, 2014; originally published November 1952.
Comments to webadmin@kgs.ku.edu
The URL for this page is http://www.kgs.ku.edu/Publications/Bulletins/98/05_gw.html