![]()
Prev Page--Ground Water || Next Page--Well Records
Ground Water, continued
Chemical Character of Ground Water
The chemical character of the ground water in the Smoky Hill Valley area is shown by the analyses of 63 representative samples of the water given in Table 9. Of these, 61 samples were taken from wells in alluvium, one from a well (70) in the terrace deposits west of Abilene, and one from spring 73, which derives its water indirectly from the terrace deposits. Of the 61 samples collected from wells in alluvium, 41 are from wells in Smoky Hill Valley and 20 are from wells in valleys tributary to the Smoky Hill, including five each from Saline, Solomon, and Republican Valleys, two from Mulberry Valley, and one each from the valleys of Dry Creek, Clarke Creek, and an unnamed tributary south of Solomon. Figure 8 shows graphically the chemical character of typical waters from the alluvium in the major valleys by areas. Table 10 gives the chloride content of 29 additional samples of water collected from wells and test holes in alluvium. Of these, 14 samples were taken from test holes in Smoky Hill Valley between Abilene and Salina, 7 from test holes in Solomon Valley, 1 from a test hole in the valley of Gypsum Creek, and 7 from wells in Saline Valley.
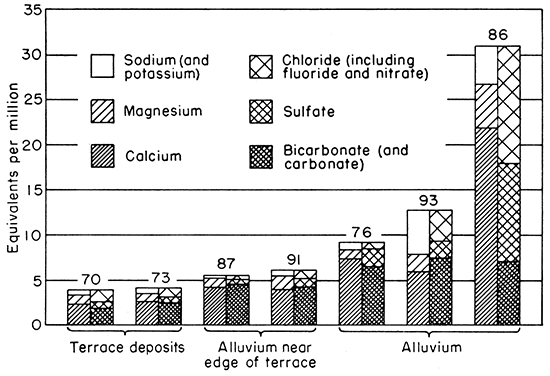
Figure 8--Chemical character of waters from 15 wells in Smoky Hill Valley and 9 wells in valleys tributary to Smoky Hill Valley in Saline, Dickinson, and Geary counties, Kansas. Numbers refer to wells described in text. Unless otherwise indicated, samples are from wells in Smoky Hill Valley.
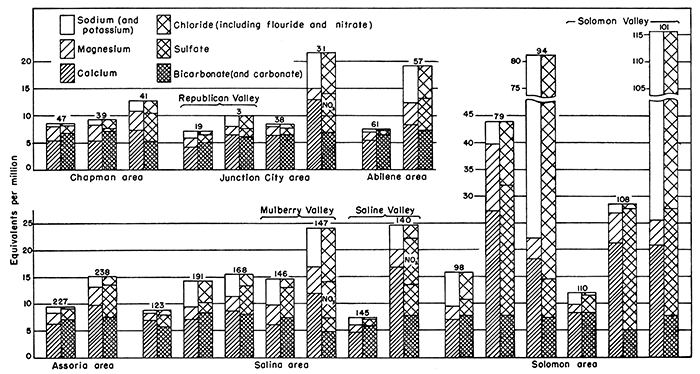
Table 9--Analyses of water from typical wells and spring in Smoky Hill Valley area in Saline, Dickinson, and Geary Counties, Kansas Dissolved constituents given in parts per milliona, and in equivalents per millionb (in italics). Analyzed by H. A. Stoltenberg.
| No. on Plate 1 |
Location | Depth, feet |
Geologic source |
Date of collection, 1943 |
Temp. (°F) |
Dissolved solids |
Silica (SiO2) |
Iron (Fe) |
Calcium (Ca) |
Magnesium (Mg) |
Sodium and potassium (Na+K) |
Bicarbonate (HCO3) |
Sulfate (SO4) |
Chloride (Cl) |
Fluoride (F) |
Nitrate (NO3) |
Hardness as CaCO3 | ||
|---|---|---|---|---|---|---|---|---|---|---|---|---|---|---|---|---|---|---|---|
| Total | Carbonate | Noncarbonate | |||||||||||||||||
| Geary County | |||||||||||||||||||
| T. 10 S., R. 5 E. | |||||||||||||||||||
| 1c | SW SE sec. 19 | 38 | Alluvium | Nov. 1939 | 507 | 1.8 | 106 5.29 |
17 1.40 |
32 1.41 |
338 5.53 |
52 1.08 |
33 0.93 |
0.3 0.01 |
34 0.55 |
335 | 277 | 58 | ||
| T. 11 S., R. 5 E. | |||||||||||||||||||
| 2 | SW NW sec. 7 | 24 | Alluvium | July 20 | 59 | 342 | 2.9 | 101 5.04 |
19 1.56 |
5.1 0.22 |
390 6.40 |
13 0.27 |
3 0.08 |
0.5 0.03 |
2.2 0.04 |
330 | 320 | 10 | |
| 3 | NE SW sec. 18 | 14 | Alluvium | July 20 | 59 | 570 | .4 | 130 6.49 |
19 1.56 |
43 1.89 |
373 6.12 |
76 1.58 |
31 0.87 |
0.4 0.02 |
84 1.35 |
402 | 306 | 96 | |
| 4 | SW NW sec. 27 | 20 | Alluvium | July 20 | 59 | 405 | .2 | 102 5.09 |
26 2.14 |
15 0.67 |
417 6.84 |
35 0.73 |
10 0.28 |
.2 0.01 |
2.6 0.04 |
362 | 342 | 20 | |
| 19d | SW SW sec. 36 | 52 | Alluvium | Mar. 15 | 433 | 1.3 | 85 4.24 |
19 1.56 |
32 1.38 |
305 5.00 |
69 1.44 |
24 0.68 |
0.5 0.03 |
1.8 0.03 |
290 | 250 | 40 | ||
| T. 11 S., R. 6 E. | |||||||||||||||||||
| 29 | SW SE sec. 35 | 35 | Alluvium | July 31 | 59 | 586 | .28 | 151 7.53 |
32 2.63 |
12 0.51 |
459 7.53 |
68 1.41 |
18 0.51 |
0.1 0.01 |
75 1.21 |
508 | 376 | 132 | |
| T. 12 S., R. 6 E. | |||||||||||||||||||
| 30 | NE SE sec. 5 | 60 | Alluvium | Aug. 4 | 58 | 444 | .48 | 122 6.09 |
28 2.30 |
7.6 0.33 |
440 7.22 |
38 0.79 |
22 0.62 |
0.1 0.01 |
5.3 0.08 |
420 | 361 | 59 | |
| T. 12 S., R. 5 E. | |||||||||||||||||||
| 31 | NE SW sec. 13 | 45 | Alluvium | Aug. 5 | 58 | 1,319 | .18 | 257 12.82 |
28 2.30 |
151 6.55 |
417 6.84 |
154 3.20 |
268 7.56 |
0.2 0.01 |
252 4.06 |
756 | 342 | 414 | |
| 36 | SE NE sec. 27 | 33 | Alluvium | July 20 | 59 | 584 | 0 | 167 8.33 |
21 1.73 |
18 0.80 |
476 7.81 |
71 1.48 |
37 1.04 |
0.1 0.01 |
32 0.52 |
503 | 390 | 113 | |
| 38 | NW NW sec. 32 | 20 | Alluvium | Aug. 4 | 59 | 451 | 9.1 | 126 6.29 |
18 1.48 |
15 0.66 |
395 6.48 |
58 1.21 |
25 0.70 |
0.1 0.01 |
2 0.03 |
388 | 324 | 64 | |
| Dickinson County | |||||||||||||||||||
| T. 13 S., R. 4 E. | |||||||||||||||||||
| 39 | NE NE sec. 4 | 40 | Alluvium | July 20 | 58 | 498 | .04 | 106 5.29 |
36 2.96 |
25 1.09 |
427 7.00 |
29 0.60 |
26 0.73 |
0.2 0.01 |
62 1.00 |
412 | 350 | 62 | |
| T. 12 S., R. 4 E. | |||||||||||||||||||
| 40e | NW NE sec. 31 | 68 | Alluvium | Aug., 1937 | 1,006 | .8 | 164 8.21 |
50 4.13 |
58 2.51 |
312 5.12 |
346 7.20 |
85 5.39 |
8.8 0.14 |
617 | 256 | 361 | |||
| 41e | NW NE sec. 31 | 68 | Alluvium | June 23 | 841 | .04 | 146 7.28 |
43 3.53 |
46 2.01 |
312 5.12 |
253 5.26 |
71 2.00 |
0.3 0.02 |
26 0.42 |
540 | 256 | 284 | ||
| T. 13 S., R. 4 E. | |||||||||||||||||||
| 45 | NW NW sec. 6 | 32 | Alluvium | Aug. 5 | 59 | 493 | 7.0 | 151 7.53 |
15 1.23 |
12 0.54 |
466 7.64 |
57 1.18 |
16 0.45 |
0.2 0.01 |
1.5 0.02 |
438 | 382 | 56 | |
| T. 13 S., R. 3 E. | |||||||||||||||||||
| 46 | NW NW sec. 10 | 35 | Alluvium | July 20 | 58 | 585 | .24 | 154 7.68 |
26 2.14 |
16 0.70 |
388 6.36 |
159 3.31 |
22 0.52 |
0.2 0.01 |
14 0.22 |
491 | 318 | 173 | |
| 47 | SE SE sec. 16 | 60 | Alluvium | July 20 | 60 | 448 | 2.4 | 109 5.44 |
32 2.63 |
13 0.63 |
415 6.81 |
70 1.46 |
11 0.31 |
0.3 0.02 |
2.9 0.05 |
404 | 340 | 64 | |
| 56f | SW SW NE sec. 20 | 41.5 | Alluvium | Aug. 11, 1944 | 1,134 | 0 | 162 8.08 |
47 3.86 |
145 6.29 |
410 6.72 |
243 5.05 |
216 6.09 |
0.3 0.02 |
22 0.35 |
597 | 336 | 261 | ||
| 57f | SW SW NE sec. 20 | 38 | Alluvium | Jan. 12 | 1,203 | 0 | 167 8.33 |
50 4.11 |
158 6.89 |
437 7.17 |
296 6.16 |
187 5.27 |
0.3 0.02 |
44 0.71 |
622 | 358 | 264 | ||
| T. 13 S., R. 2 E. | |||||||||||||||||||
| 61 | SW SE sec. 14 | 40 | Alluvium | July 21 | 59 | 391 | 4.5 | 108 5.39 |
19 1.56 |
14 0.61 |
399 6.54 |
34 0.71 |
10 0.28 |
0.2 0.01 |
1.5 0.02 |
348 | 327 | 21 | |
| 62 | SW SE SE sec. 21 | 63 | Alluvium | July 30 | 58 | 528 | 1.9 | 130 6.49 |
28 2.30 |
22 0.97 |
401 6.58 |
125 2.60 |
19 0.54 |
0.2 0.01 |
1.8 0.03 |
440 | 329 | 111 | |
| 65 | SW SW SE sec. 19 | 32 | Alluvium | July 20 | 58 | 335 | .19 | 89 4.44 |
17 1.40 |
8 0.35 |
277 4.54 |
36 0.75 |
12 0.34 |
0.2 0.01 |
34 0.55 |
292 | 227 | 65 | |
| T. 13 S., R. 1 E. | |||||||||||||||||||
| 70 | NE SE SE sec. 15 | 48 | Terrace deposits |
May 27, 1944 | 59 | 239 | 2.0 | 51 2.54 |
10 0.82 |
12 0.52 |
120 1.97 |
30 0.62 |
8 0.22 |
0.1 0.01 |
66 1.06 |
168 | 98 | 70 | |
| 73g | SE NW SE sec. 23 | Spring | Herington limestone member |
Nov. | 265 | .05 | 54 2.69 |
12 0.99 |
8.5 0.37 |
159 2.61 |
34 0.71 |
13 0.37 |
0.1 0.01 |
22 0.35 |
184 | 130 | 54 | ||
| 76 | NW SE sec. 26 | 35 | Alluvium | May 27, 1944 | 58 | 495 | .16 | 146 7.28 |
14 1.15 |
17 0.76 |
403 6.61 |
90 1.87 |
23 0.65 |
0.2 0.01 |
3 0.05 |
422 | 330 | 92 | |
| 79 | SW SE sec. 36 | 40 | Alluvium | July 30 | 59 | 2,771 | 11 | 545 27.20 |
151 12.41 |
103 4.46 |
478 7.84 |
1,162 24.17 |
250 7.06 |
0.4 0.02 |
310 4.99 |
1,980 | 392 | 1,588 | |
| T. 14 S., R. 1 E. | |||||||||||||||||||
| 81 | NE cor. sec. 3 | 20 | Alluvium | July 15 | 59 | 1.253 | 2.6 | 218 10.88 |
38 3.12 |
169 7.36 |
356 5.84 |
367 7.63 |
278 7.84 |
0.3 0.02 |
1.8 0.03 |
700 | 292 | 408 | |
| 85 | NW SW SW sec. 17 | 30.5 | Alluvium | July 30 | 58 | 2,514 | 3.0 | 611 30.49 |
73 6.00 |
60 2.61 |
321 5.26 |
1,320 27.46 |
144 4.06 |
0.5 0.03 |
142 2.29 |
1,824 | 263 | 1,561 | |
| T. 13 S., R. 1 E. | |||||||||||||||||||
| 86 | NE cor. sec. 31 | 26 | Alluvium | July 15 | 58 | 1,990 | 1.2 | 437 21.81 |
58 4.77 |
95 4.14 |
429 7.04 |
519 10.80 |
178 5.02 |
0.4 0.02 |
487 7.84 |
1,329 | 352 | 977 | |
| 87 | SW SE SE sec. 21 | 29.5 | Alluvium | July 30 | 59 | 290 | .48 | 87 4.34 |
14 1.15 |
2.5 0.11 |
282 4.62 |
34 0.71 |
8 0.22 |
0.2 0.01 |
2.6 0.04 |
274 | 231 | 43 | |
| 91h | NW SW SE sec. 18 | 50.5 | Alluvium | Nov. | 394 | .18 | 84 4.19 |
17 1.40 |
13 0.56 |
260 4.26 |
49 1.02 |
10 0.28 |
0.2 0.01 |
36 0.58 |
280 | 213 | 67 | ||
| 93 | SE SW NW sec. 19 | 30 | Alluvium | May 27, 1944 | 59 | 695 | 4 | 123 6.14 |
21 1.73 |
111 4.83 |
458 7.51 |
85 1.77 |
119 3.36 |
0.3 0.02 |
2.6 0.04 |
394 | 376 | 18 | |
| Saline County | |||||||||||||||||||
| T. 13 S, R. 1 W. | |||||||||||||||||||
| 94 | SW SE sec. 24 | 32 | Alluvium | Aug. 4 | 59 | 4,770 | 1.4 | 365 18.21 |
48 3.94 |
1,356 58.98 |
446 7.31 |
351 7.30 |
2,270 64.01 |
0.2 0.01 |
156 2.50 |
1,108 | 366 | 742 | |
| T. 14 S., R. 1 W. | |||||||||||||||||||
| 95 | NW SW NW sec. 2 | 35 | Alluvium | July 21 | 58 | 3.404 | .08 | 217 10.83 |
40 3.29 |
1,006 43.77 |
556 9.12 |
364 7.57 |
1,410 39.76 |
0.4 0.02 |
88 1.42 |
706 | 456 | 250 | |
| T. 19 S., R. 1 W. | |||||||||||||||||||
| 98 | NW SW NW sec. 32 | 36 | Alluvium | July 21 | 58 | 884 | .49 | 139 6.94 |
30 2.47 |
148 6.45 |
471 7.72 |
141 2.93 |
175 4.94 |
0.5 0.03 |
15 0.24 |
470 | 386 | 84 | |
| 100 | SE NE sec. 15 | 40 | Alluvium | July 21 | 59 | 2,150 | 3.4 | 503 25.10 |
79 6.49 |
54 2.36 |
366 6.00 |
1,280 26.62 |
45 1.27 |
0.6 0.03 |
2 0.03 |
1,580 | 300 | 1,280 | |
| 101 | SW SE sec. 16 | 40 | Alluvium | July 15 | 58 | 6,848 | 3.6 | 418 20.86 |
56 4.60 |
2,065 89.81 |
468 7.68 |
962 20.01 |
3,100 87.42 |
0.4 0.02 |
8.8 0.14 |
1,273 | 384 | 889 | |
| 108 | NW NW NE sec. 9 | 40 | Alluvium | July 21 | 60 | 1,813 | .46 | 425 21.21 |
68 5.59 |
42 1.83 |
307 5.03 |
1,089 22.65 |
30 0.85 |
0.5 0.03 |
4.4 0.07 |
1,340 | 252 | 1,088 | |
| 110 | NE cor. sec. 7 | 34 | Alluvium | July 15 | 58 | 662 | 2.2 | 166 8.28 |
19 1.66 |
49 2.15 |
506 8.30 |
157 3.26 |
14 0.39 |
0.2 0.01 |
1.7 0.03 |
492 | 415 | 77 | |
| 111 | SW SW NW sec. 7 | 44.5 | Alluvium | July 15 | 58 | 1,786 | 9.5 | 365 18.21 |
48 3.94 |
133 5.78 |
383 6.28 |
1,024 21.30 |
8 0.22 |
0.4 0.02 |
6.6 0.11 |
1,108 | 314 | 794 | |
| T. 13 S., R. 2 W. | |||||||||||||||||||
| 118 | SE SE sec. 28 | 44 | Alluvium | July 21 | 59 | 583 | 1.1 | 146 7.28 |
22 1.81 |
36 1.58 |
409 6.71 |
123 2.56 |
48 1.35 |
0.3 0.02 |
2 0.03 |
454 | 336 | 118 | |
| T. 14 S., R. 2 W. | |||||||||||||||||||
| 123 | NE NW NW sec. 10 | 40 | Alluvium | July 21 | 59 | 498 | 2.5 | 137 6.84 |
16 1.32 |
16 0.69 |
345 5.66 |
106 2.20 |
16 0.45 |
0.4 0.02 |
32 0.52 |
408 | 283 | 125 | |
| T. 13 S., R. 2 W. | |||||||||||||||||||
| 126 | SE SE SW sec. 31 | 50 | Alluvium | July 30 | 58 | 712 | .19 | 159 7.93 |
31 2.55 |
54 2.34 |
410 6.72 |
177 3.68 |
84 2.37 |
0.3 0.02 |
1.8 0.03 |
524 | 336 | 188 | |
| T. 13 S., R. 3 W. | |||||||||||||||||||
| 139 | SE SW SE sec. 27 | 68.7 | Alluvium | July 19 | 57 | 3,681 | 6.2 | 513 25.60 |
103 8.47 |
434 18.90 |
605 9.92 |
174 3.62 |
400 11.28 |
0.1 0.01 |
1,748 28.14 |
1,704 | 496 | 1,208 | |
| 140 | SE SW SE sec. 27 | 30 | Alluvium | May 27, 1944 | 55 | 1,626 | 1.4 | 335 16.72 |
41 3.37 |
107 4.64 |
470 7.71 |
279 5.80 |
91 2.57 |
0.3 0.02 |
536 8.63 |
1,004 | 386 | 618 | |
| 143 | SE SW SE sec. 17 | 42 | Alluvium | July 19 | 59 | 578 | .2 | 134 6.69 |
22 1.81 |
34 1.49 |
400 6.56 |
43 0.89 |
24 0.68 |
0.2 0.01 |
115 1.85 |
425 | 328 | 97 | |
| 144 | NE SE sec. 9 | 50 | Alluvium | July 19 | 59 | 462 | 110 5.49 |
17 1.40 |
36 1.57 |
372 6.10 |
85 1.77 |
20 0.56 |
0.1 0.01 |
1.5 0.02 |
344 | 305 | 39 | ||
| 145 | NE NE sec. 6 | 45 | Alluvium | July 19 | 58 | 395 | 2.2 | 93 4.64 |
15 1.23 |
36 1.59 |
359 5.89 |
51 1.06 |
17 0.48 |
0.2 0.01 |
1.4 0.02 |
294 | 294 | 0 | |
| T. 14 S., R. 4 W. | |||||||||||||||||||
| 146 | SE SE SE sec. 13 | 45 | Alluvium | July 29 | 65 | 846 | 5.0 | 121 6.04 |
45 3.70 |
115 5.01 |
446 7.31 |
272 5.66 |
60 1.69 |
0.4 0.02 |
4.4 0.07 |
487 | 366 | 121 | |
| T. 14 S., R. 3 W. | |||||||||||||||||||
| 147 | SW NW sec. 8 | 42 | Alluvium | July 29 | 58 | 1,499 | .52 | 237 11.83 |
60 4.93 |
166 7.21 |
293 4.80 |
118 2.45 |
355 10.01 |
0.1 0.01 |
416 6.70 |
838 | 240 | 598 | |
| 168i | NW SE NE sec. 13 | 72 | Alluvium | Oct. 19, 1938 | 830 | 2.5 | 173 8.63 |
32 2.63 |
95 4.13 |
490 8.03 |
247 5.14 |
76 2.14 |
0.6 0.03 |
3.3 0.05 |
563 | 402 | 161 | ||
| 171i | NE NW SE sec. 13 | 74 | Alluvium | Oct. 19 | 771 | .85 | 174 8.68 |
26 2.14 |
58 2.53 |
469 7.67 |
184 3.82 |
63 1.78 |
0.5 0.03 |
3.3 0.05 |
541 | 384 | 157 | ||
| 172i | SW NW SE sec. 13 | 81 | Alluvium | May 16, 1939 | 810 | .1 | 176 8.78 |
27 2.22 |
49 2.12 |
459 7.52 |
194 4.03 |
53 1.49 |
0.3 0.02 |
3.5 0.06 |
550 | 376 | 174 | ||
| 173i | NW SE SW sec. 13 | 84 | Alluvium | May 16, 1939 | 836 | 0 | 174 8.68 |
30 2.47 |
52 2.26 |
449 7.35 |
216 4.49 |
48 1.35 |
0.2 0.01 |
13 0.21 |
558 | 368 | 190 | ||
| 174i | SE SE SW sec. 13 | 81 | Alluvium | May 16, 1939 | 740 | 0 | 160 7.98 |
28 2.30 |
38 1.64 |
432 7.07 |
180 3.74 |
34 0.96 |
0.2 0.01 |
8.8 0.14 |
514 | 354 | 160 | ||
| 175i | NE NW sec. 24 | Alluvium | May 16, 1939 | 649 | 0 | 144 7.19 |
28 2.30 |
29 1.28 |
450 7.37 |
137 2.85 |
16 0.45 |
0.2 0.01 |
5.8 0.09 |
475 | 369 | 106 | |||
| 190 | SE SE SE sec. 28 | 51.5 | Alluvium | July 30 | 59 | 1,202 | 6.4 | 204 10.18 |
64 5.26 |
134 5.84 |
405 6.64 |
211 4.39 |
340 9.59 |
0.3 0.02 |
40 0.64 |
772 | 332 | 440 | |
| 191 | SE SE SW sec. 26 | 80 | Alluvium | May 27, 1944 | 60 | 843 | .06 | 140 6.99 |
28 2.30 |
113 4.90 |
503 8.25 |
90 1.87 |
43 1.21 |
0.2 0.01 |
177 2.85 |
464 | 412 | 52 | |
| T. 14 S., R. 2 W. | |||||||||||||||||||
| 192 | SE SW SE sec. 30 | 60 | Alluvium | May 27, 1944 | 57 | 622 | 1.2 | 144 7.18 |
24 1.97 |
42 1.82 |
311 5.10 |
180 3.74 |
74 2.09 |
0.3 0.02 |
1.4 0.02 |
458 | 255 | 203 | |
| T. 15 S., R. 3 W. | |||||||||||||||||||
| 210 | SW NW SW sec. 16 | 41 | Alluvium | July 29 | 59 | 1,362 | .76 | 255 12.72 |
61 5.01 |
125 5.45 |
424 6.95 |
45 0.94 |
380 10.72 |
0.1 0.01 |
283 4.56 |
886 | 348 | 538 | |
| T. 15 S., R. 2 W. | |||||||||||||||||||
| 226 | SW NE SE sec. 30 | 50 | Alluvium | July 29 | 59 | 588 | 3.1 | 148 7.38 |
27 2.22 |
29 1.28 |
470 7.71 |
123 2.56 |
20 0.56 |
0.4 0.02 |
2.1 0.03 |
480 | 386 | 94 | |
| T. 16 S., R. 3 W. | |||||||||||||||||||
| 227j | NW SE NW sec. 12 | 86 | Alluvium | Oct. | 569 | 3.4 | 126 6.29 |
23 1.89 |
32 1.38 |
431 7.07 |
94 1.96 |
17 0.48 |
0.3 0.02 |
2 0.03 |
409 | 353 | 56 | ||
| 237 | NW NW NE sec. 25 | 45 | Alluvium | July 29 | 59 | 566 | .25 | 116 5.79 |
21 1.73 |
61 2.66 |
334 5.48 |
126 2.62 |
72 2.03 |
0.4 0.02 |
2.1 0.03 |
376 | 274 | 102 | |
| 238 | SE SE SW sec. 34 | 50 | Alluvium | July 29 | 59 | 876 | 1.7 | 195 9.73 |
41 3.37 |
44 1.91 |
449 7.36 |
288 5.99 |
28 0.79 |
0.4 0.02 |
53 0.85 |
655 | 368 | 287 | |
| a. One part per million is equivalent to one pound of substance per million pounds of water or 8.33 pounds per million gallons of water. b. An equivalent per million is a unit chemical equivalent weight of solute per million unit weights of solution. Concentration in equivalents per million is calculated by dividing the concentraton in parts per million by the chemical combining weight of the substance or ion. c. Sample collected from well at Milford by city engineer. d. Sample collected from well at Junction City by water superintendent. e. Sample collected from wells at Chapman by city engineer. f. Sample collected from well at Enterprise by city engineer. g. Sample collected from hydrant at Abilene pumping station by city engineer. h. Sample collected from well at Solomon by city engineer. i. Sample collected from city well at Salina by water superintendent. j. Sample collected from water tower hydrant at Assaria by water superintendent. |
|||||||||||||||||||
Table 10--Chloride content of water from wells and test holes in the Smoky Hill Valley area in Saline and Dickinson Counties, Kansas. Analyzed by H. A. Stoltenberg.
| No. on Plate 1 |
Location | Depth, feet |
Source (1) |
Valley | Date of collection, 1944 |
Temp. (°F) |
Chloride (Cl) (parts per million) |
|---|---|---|---|---|---|---|---|
| Dickinson County | |||||||
| T. 13 S., R. 2 E. | |||||||
| 64 | SE cor. SW sec. 20 | 53-58 | TH | Smoky Hill | Mar. 13 | 19 | |
| T. 13 S., R. 1 E. | |||||||
| 75 | SE SW NE sec. 26 | 42-47 | TH | Smoky Hill | Feb. 24 | 32 | |
| 78 | NW NE SE sec. 35 | 62-67 | TH | Smoky Hill | Feb. 25 | 4,950 | |
| 80 | SE SW SE sec. 35 | 62-67 | TH | Smoky Hill | Feb. 25 | 1,940 | |
| 82 | NW cor. SW sec. 35 | 61-66 | TH | Smoky Hill | Feb. 26 | 4,750 | |
| 83 | SW cor. NW sec. 34 | 62-67 | TH | Smoky Hill | Feb. 26 | 8,400 | |
| 84 | SE cor. NE NE sec. 32 | 55-60 | TH | Smoky Hill | Feb. 27 | 5,475 | |
| 88 | NW SW sec. 21 | 38-43 | TH | Smoky Hill | Feb. 23 | 9 | |
| Saline County | |||||||
| T. 14 S., R. 1 W. | |||||||
| 96 | NW NE NW sec. 15 | 43-48 | TH | Gypsum Creek | Mar. 11 | 12 | |
| T. 13 S., R. 1 W. | |||||||
| 97 | NE cor. sec. 33 | 54-59 | TH | Smoky Hill | Mar. 11 | 2,900 | |
| 99 | SW cor. sec. 29 | 46-51 | TH | Smoky Hill | Mar. 6 | 10,000 | |
| 102 | SE SE NE sec. 19 | 55-60 | TH | Solomon | Mar. 7 | 47,000 | |
| 104 | SW SW NW sec. 16 | 52-57 | TH | Solomon | Mar. 8 | 15,100 | |
| 105 | NE NE NW sec. 16 | 52-57 | TH | Solomon | Mar. 8 | 580 | |
| 106 | SE SE NE sec. 9 | 42-47 | TH | Solomon | Mar. 9 | 21 | |
| 109 | NW SW SW sec. 4 | 47-52 | TH | Solomon | Mar. 9 | 47 | |
| 112 | SW cor. sec. 6 | 47-52 | TH | Solomon | Mar. 10 | 9 | |
| T. 13 S., R. 2 W. | |||||||
| 113 | NE cor. sec. 2 | 42.5-47.5 | TH | Solomon | Mar. 10 | 5.5 | |
| 114 | SW cor. sec. 25 | 57-62 | TH | Smoky Hill | Mar. 4 | 780 | |
| 117 | SW cor. sec. 27 | 57-62 | TH | Smoky Hill | Mar. 2 | 69 | |
| T. 14 S., R. 2 W. | |||||||
| 120 | NE cor. sec. 4 | 67-72 | TH | Smoky Hill | Mar. 2 | 54 | |
| 122 | SE cor. sec. 4 | 55-60 | TH | Smoky Hill | Mar. 3 | 69 | |
| T. 13 S., R. 3 W. | |||||||
| 128 | SE SW sec. 34 | 20 | D,S | Saline | May 24 | 58 | 35 |
| 131 | SW NW sec, 35 | 80 | D | Saline | May 25 | 58 | 27 |
| 133 | NE NW SW sec. 25 | 50 | D | Saline | May 24 | 60 | 50 |
| 136 | NW cor. NE sec. 25 | 35 | D | Saline | May 24 | 59 | 13 |
| 138 | Center sec. 24 | 40 | S | Saline | May 24 | 59 | 29 |
| 141 | SE SE SE sec. 28 | 84 | D,S | Saline | May 24 | 58 | 108 |
| 142 | NE NW sec. 27 | 50 | D | Saline | May 25 | 59 | 230 |
| 1. D, domestic well; S, stock well; TH, test hole. | |||||||
All the samples of water from wells were collected by me except those from public-supply wells, which were collected by the city engineers or water superintendents. The samples from test holes were collected by O. S. Fent. The analyses, which were made by Howard A. Stoltenberg in the Water and Sewage Laboratory of the Kansas State Board of Health, show only the dissolved mineral content of the water and do not in general indicate the sanitary condition. The suitability of the waters for the common industrial or commercial uses and for irrigation can be determined from the analyses, but not their suitability for human consumption. The constituents given were determined by the methods used by the United States Geological Survey.
Chemical Constituents in Relation to Use
The following discussion of the chemical constituents of ground water has been adopted in part from publications of the United States Geological Survey.
The residue left after a natural water has evaporated consists of rock materials, with which may be included some organic material and some water of crystalization. Waters that contain less than 500 parts per million of dissolved solids ordinarily are suitable for domestic purposes and for many industrial and commercial uses, except for the difficulties resulting from their hardness and, in some areas, excessive iron corrosiveness. Waters having more than 1,000 parts per million of dissolved solids are generally not satisfactory, for they are likely to contain enough of certain constituents to produce a noticeable taste or to make the water unsuitable in some other respects. According to these limits, the waters in the terrace deposits west of Abilene are satisfactory for most ordinary uses, but some of the waters from alluvium are unsatisfactory. Of the 61 samples collected from wells in alluvium, 16 contained between 290 and 500 parts per million of dissolved solids, 26 contained between 500 and 1,000 parts, 12 contained between 1,000 and 2,000 parts, and seven (79, 85, 94, 95, 100, 101, and 139) contained more than 2,000 parts. The greatest concentration of dissolved solids--6,848 parts per million--was found in the water from well 101.
With respect to ordinary uses, the hardness of a water is important and is the property that generally receives the most attention. A hard water requires more soap to be used in laundering; it forms scale in steam boilers, hot-water tanks, and other receptacles in which water is heated; and it must be treated to make it suitable for certain industrial uses. Water having a hardness of less than 50 parts per million is generally rated as soft, and its treatment for the removal of hardness under ordinary circumstances is not necessary. Hardness between 50 and 150 parts per million does not seriously interfere with the use of water for most purposes, but it does slightly increase the consumption of soap, and its removal by a softening process is profitable for laundries or other industries using large quantities of soap. Waters in the upper part of this range of hardness will cause considerable scale in steam boilers. Hardness above 150 parts per million can be noticed by anyone and if the hardness is 200 or 300 parts per million it is common practice to soften the water for household use or to install cisterns to collect soft rain water. Where municipal water supplies are softened, an attempt is generally made to reduce the hardness to 60 or 80 parts per million. The additional improvement from further softening of a whole public supply is not deemed worth the increase in cost.
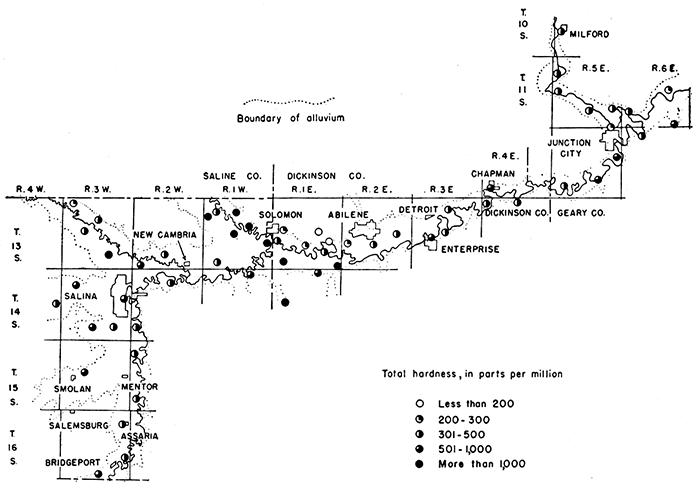
The ground waters in the Smoky Hill Valley area are hard to very hard. Only two samples (70 and 73), both from the terrace deposits west of Abilene, had less than 200 parts per million of hardness. The 61 samples from alluvium ranged in hardness from 274 to 1,980 parts per million. Of these, 32 samples had between 274 and 500 parts per million of hardness, 19 had between 500 and 1,000 parts, and 10 had more than 1,000 parts. The areal distribution of waters in the different ranges of hardness in this area is shown in Figure 9.
Figure 9--Total hardness of ground waters in the Smoky Hill Valley area.
In addition to the total hardness, the table of analyses shows the carbonate hardness and the noncarbonate hardness. The carbonate hardness is that due to the presence of calcium and magnesium bicarbonates. It is almost completely removed by boiling. In some reports this type of hardness is called temporary hardness. The noncarbonate hardness is due to the presen~e of sulfates or chlorides of calcium and magnesium. It cannot be removed by boiling and has sometimes been called permanent hardness. With reference to use with soaps, there is no difference between carbonate and noncarbonate hardness. In general, the noncarbonate hardness forms harder scale in steam boilers. The noncarbonate hardness was greater than the carbonate hardness in only 17 of the samples analyzed. The concentration of sulfate or chloride was exceptionally high in each of these 17 samples.
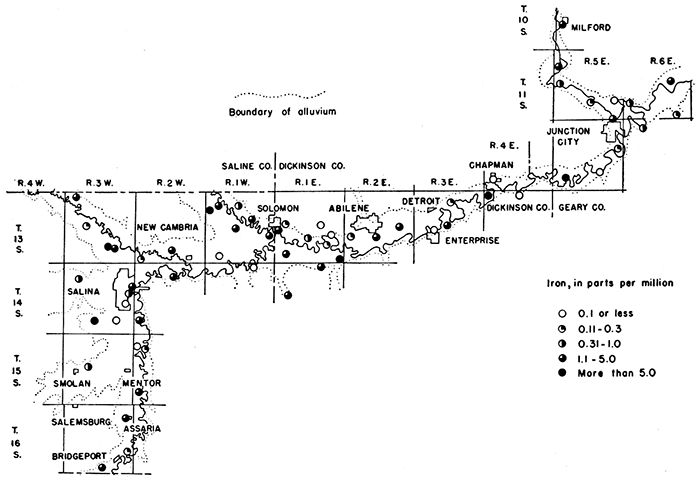
Iron, which is dissolved from many rock materials and may be dissolved from water pipes, is found in objectionable amounts in many waters in this area. If a water contains much more than 0.1 part per million of iron, the excess may separate out and settle as a reddish sediment. A water high in iron is not suited for use in laundries or breweries or for making ice or carbonated beverages unless the excess iron is removed. In the manufacture of high-quality papers and textiles, the upper limit of dissolved iron that can be tolerated in the water is even less than 0.1 part per million. Iron, which may be present in sufficient quantity to give a disagreeable taste and to stain cooking utensils, can be removed from most waters by simple aeration and filtration, but a few waters require the addition of lime or some other substance. Only 12 of the samples of water analyzed contained 0.1 part per million or less of iron, 19 contained between 0.1 and 1 part, 25 contained between 1.1 and 5 parts, and 7 contained more than 5 parts. The sample from well 79 had the greatest concentration of iron-ll parts per million. The areal distribution of iron in the ground waters of this area is shown in Figure 10.
Figure 10--Iron contained in ground waters in the Smoky Hill Valley area.
In parts of the Smoky Hill Valley area, waters in alluvium contain undesirable amounts of chloride. Chlorine combined as chloride is widely distributed in nature; it is an abundant constituent of sea water and is dissolved in small quantities from many rock materials. Chloride has little effect on the suitability of water for ordinary use, unless enough is present to impart a salty taste and render the water unpalatable. Waters high in chloride are not suited for use in irrigation and may be corrosive if used in steam boilers. Chlorides of calcium and magnesium contribute to the hardness of a water in a manner similar to the sulfates and carbonates of these elements. The removal of chloride from water supplies is difficult and expensive, and is seldom done. The areal distribution of chloride in the ground waters of the Smoky Hill Valley area is shown in Figure 11. Samples 70 and 73 from the terrace deposits contained 8 and 13 parts per million of chloride, respectively. Of 90 samples collected from alluvium,48 samples contained less than 50 parts per million of chloride, 64 contained less than 150 parts, and 12 contained more than 1,000 parts (Table 11). All the samples that had exceptionally high concentrations of chloride were collected from wells and test holes in the Solomon area.
Figure 11--Chloride contained in ground waters in the Smoky Hill Valley area.
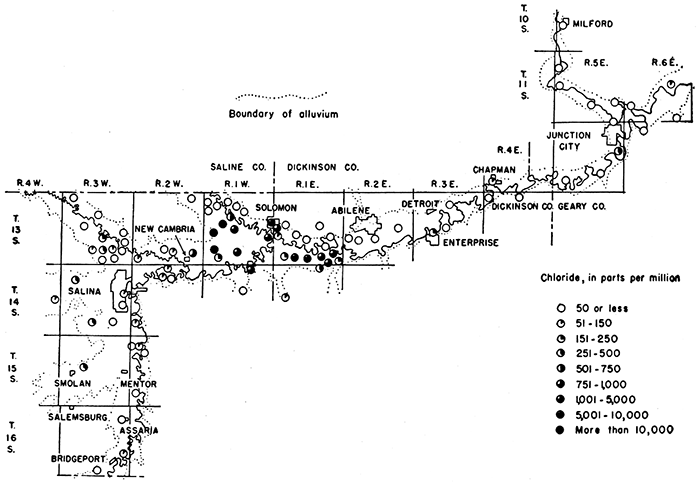
Table 11--Range in chloride content of water samples from wells and test holes in alluvium in the SmQky Hill Valley area
| Chloride (parts per million) |
Number of samples |
|---|---|
| Less than 50 | 48 |
| 50-150 | 16 |
| 151-250 | 6 |
| 251-500 | 6 |
| 501-750 | 1 |
| 751-1,000 | 1 |
| 1,001-5,000 | 7 |
| 5,001-10,000 | 3 |
| More than 10,000 | 2 |
| Total | 90 |
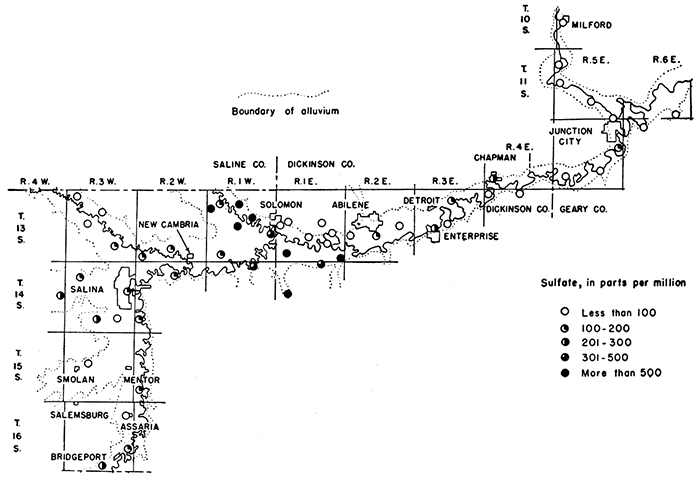
Reference has been made previously to the high sulfate content of some of the water samples from alluvium in this area. Sulfate in ground water in large quantities is generally derived from gypsum and from deposits of sodium sulfate. The areal distribution of sulfate in ground waters in the Smoky Hill Valley area is shown in Figure 12. The sulfate in samples of water collected ranged from 13 parts per million in the sample from well 2 to 1,320 parts in the sample from well 85. Samples from alluvium in the Solomon area had the greatest concentration of sulfate. Gypsum in the Wellington formation (Permian), which forms the uplands and underlies the alluvium in the Solomon area, is undoubtedly the source of most, of the sulfate.
Figure 12--Sulfate contained in ground waters in the Smoky Hill Valley area.
The amount of fluoride in waters that are to be used by children is important. It has been stated that waters containing 1.5 parts per million, or more, of fluoride are likely to produce mottled enamel on the teeth of children who drink the water during the formation of the permanent teeth. Smaller quantities of fluoride are thought to inhibit tooth decay. The analyses given in Table 9 show that ground water in this area is low in fluoride content. All the samples analyzed had 0.6 part per million or less of fluoride.
The suitability of water for use in irrigation is commonly believed to depend mainly on the total quantity of soluble salts and the ratio of the quantity of sodium to the total quantity of sodium, calcium, and magnesium. The quantity of chloride may be large enough to affect the use of the water, and in some areas other constituents, such as boron, may be present in sufficient quantity to cause difficulty. In a discussion of the interpretation of analyses with reference to irrigation in southern California, Scofield (1933) suggests that if the total concentration of dissolved salts is less than 700 parts per million there is not much probability of harmful effects in irrigation use, but if it exceeds 2,100 parts per million there is a strong probability of damage to either the crops or the land, or both. Water containing less than 50 percent sodium (the percentage being caculated as 100 times the ratio of the total bases, in equivalents) is not likely to be injurious, but if it contains more than 60 percent its use is inadvisable. Similarly, a chloride content of less than 142 parts per million is not objectionable, but more than 355 parts per million is undesirable. It is recognized that the harmfulness of irrigation water is so dependent on the nature of the land and the crops, on the manner of use, and on the drainage that no hard and fast limits can be adopted.
The analyses in Table 9 indicate that the ground waters in parts of this area are unsatisfactory for use in irrigation. The waters from 30 of the wells sampled contained more than 700 parts per million of dissolved solids, and the waters from seven wells (79, 85, 94, 95, 100,101, and 139) contained more than 2,100 parts per million. The dissolved solids in these seven wells ranged from 2,150 to 6,848 parts per million. All but three of the samples contained less than 50 percent sodium (including potassium) ; these three (wells 94,95, and 101) contained more than 60 percent. Of the samples analyzed for chloride, 27 samples contained more than 142 parts per million of chloride and 16 samples contained more than 355 parts per million. Fourteen of the 16 samples that contained more than 355 parts per million of chloride were collected from wells and test holes in the Solomon area, one was collected from a well (139) in Saline Valley northwest of Salina, and one was collected from a well (210) in the valley of Dry Creek, about a mile northeast of Smolan.
Chemical Character of Ground Water Described by Areas
The discussion given in the preceding section indicates the wide range in the amount of mineral matter in the samples from the Smoky Hill Valley area. In places the ground waters are highly mineralized, in other places the ground waters are only moderately mineralized, and in still other places the ground waters are comparatively low in mineral content. For convenience of description, the Smoky Hill Valley area has been divided into seven smaller areas. The chemical character of the ground waters in each of these areas is described on the following pages, and the average composition of the samples collected from each area is given in Table 12. As only a few samples were collected from some areas, the analyses given in the table are possibly not representative of the waters in those particular areas. In general, however, the analyses are believed to be representative of the waters from the areas to which they are ascribed. The analyses of typical waters from five of the areas described are shown graphically in Figure 8.
Junction City area--The Junction City area includes the valleys of Smoky Hill, Republican, and Kansas Rivers in Geary County. The analyses of nine samples of water from alluvium in this area are given in Table 9, five of which were collected from wells (1-4, and 19) in Republican Valley and four from wells (30, 31, 36, and 38) in Smoky Hill Valley. Analyses of waters from wells at the Cavalry Replacement Training Center and Fort Riley in Republican Valley and Camp Funston in Kansas Valley are given in Table 13. These analyses were made at the Station Hospital, Camp Whitside, and are of composite samples taken from each of the three well fields.
Table 12--Average composition of ground waters from different parts of the Smoky Hill Valley area, in parts per million.
| Source (a) | No. of analyses |
Dissolved solids |
Iron (Fe) |
Calcium (Ca) |
Magnesium (Mg) |
Sodium and potassium (Na+K) |
Bicarbonate (HCO3) |
Sulfate (SO4) |
Chloride (Cl) |
Total hardness as CaCO3 |
Analyses used in averages (b) |
|
|---|---|---|---|---|---|---|---|---|---|---|---|---|
| Junction City area: | ||||||||||||
| Smoky Hill River Valley | 4 | 670 | 2.44 | 168 | 24 | 48 | 432 | 80 | 88 | 517 | 30, 31, 36, 38 | |
| Republican River Valley | 5 | 451 | 1.32 | 105 | 20 | 25 | 365 | 49 | 20 | 344 | 1-4, 19 | |
| Abilene-Chapman area-Smoky Hill Valley | 10 | 713 | 1.69 | 140 | 35 | 51 | 397 | 161 | 66 | 491 | 39, 40, 41, 45-47, 56, 57, 61, 62 | |
| Sand hills area | 2 | 252 | 1.03 | 53 | 11 | 10 | 140 | 32 | 11 | 176 | 70, 73 | |
| Solomon area: | ||||||||||||
| Smoky Hill River Valley | 8 | 2,033 | 2.61 | 274 | 50 | 376 | 450 | 385 | 2,584 (c) | 889 | 76, 79, 81, 86, 93-95, 98 (75, 78, 80, 82-84, 97, 99, 114) | |
| Smoky Hill Valley near edge of sand hills | 3 | 340 | .28 | 87 | 16 | 7.8 | 273 | 40 | 12 (d) | 282 | 65, 87, 91, (64,88) | |
| Solomon River Valley | 5 | 2,652 | 3.83 | 375 | 54 | 469 | 406 | 902 | 5,496 (e) | 1,159 | 100, 101, 108, 110, 111, (102, 104-106, 109, 112, 113) | |
| Unnamed tributary valley south of Solomon | 1 | 2,514 | 3.0 | 611 | 73 | 60 | 321 | 1,320 | 144 | 1,824 | 85 | |
| Salina area: | ||||||||||||
| Smoky Hill River Valley | 12 | 758 | 1.24 | 161 | 30 | 60 | 428 | 170 | 73 (f) | 523 | 118, 123, 126, 168, 171-175, 190-192 (117, 120, 122) | |
| Saline River Valley | 5 | 1,348 | 2.5 (g) | 237 | 40 | 129 | 441 | 126 | 87 (e) | 754 | 139, 140, 143-145 (128, 131, 133, 136, 138, 141, 142) | |
| Mulberry Creek Valley | 2 | 1,173 | 2.76 | 179 | 53 | 141 | 370 | 195 | 208 | 663 | 146, 147 | |
| Assaria area--Smoky Hill Valley | 4 | 650 | 2.11 | 146 | 28 | 42 | 421 | 158 | 34 | 480 | 226, 227, 237, 238 | |
| Smolan area-Dry Creek Valley | 1 | 1,362 | .76 | 255 | 61 | 125 | 424 | 45 | 380 | 886 | 210 | |
| (a) Samples from sand hills area are from terrace deposits; all others are from alluvium. (b) Numbers within parentheses are of samples for which the chloride content only was determined. (c) Seventeen analyses. (d) Five analyses. (e) Twelve analyses. (f) Fifteen analyses. (g) Four analyses. |
||||||||||||
Table 13--Analyses of composite samples of water from wells at the Fort Riley Military Reservation. Analyzed at Station Hospital, Camp Whitside, March, 1943. Analyses furnished by Mr. Eglelston, water superintendent, Fort Riley Military Reservation. (Constituents given in parts per million)
| Numbers on Plate 1 | Wells 14 and 15 at the Cavalry Replacement Training Center | Wells 21-24 at Fort Riley | Wells 25-28 at Camp Funston |
|---|---|---|---|
| Total solids | 450 | 469 | 875 |
| Iron | .08 | .62 | 2.1 |
| Calcium | 87 | 98 | 92 |
| Magnesium | 27 | 33 | 12 |
| Silica | 13 | 13 | 13 |
| Bicarbonate alkalinity as CaCO3 | 298 | 240 | 252 |
| Sulfate | 80 | 84 | 180 |
| Chloride | 18 | 25 | 99 |
| Total hardness | 340 | 360 | 279 |
| Total alkalinity | 285 | 300 | 392 |
All the samples from wells in the Junction City area were hard calcium bicarbonate waters in which the hardness ranged from 279 to 756 parts per million. The hardest waters were taken from wells in Smoky Hill Valley. The five samples (1-4, and 19) from Republican Valley had 290 to 402 parts per million of hardness, whereas the four samples (30, 31, 36, and 38) from Smoky Hill Valley had 388 to 756 parts of hardness. A composite sample from the four wells (25-28) at Camp Funston in Kansas River Valley had 279 parts per million of hardness (Table 13).
The chloride content of most of the waters from the Junction City area was relatively low (Fig. 11). The largest concentration of chloride--268 parts per million--was found in the water from well 31, which is a farm well in Smoky Hill Valley south of Junction City.
Five of the samples (analyses 1, 2, 19, 25, and 38) contained more than 1 part per million of iron. Water from well 38 had 9.1 parts per million of iron-the largest concentration of iron found in the Junction City area. Of the four wells (25-28) at Camp Funston, those (wells 27 and 28) nearest the river are reported to yield waters having undesirable amounts of iron. For this reason, wells 27 and 28 are used only when wells 25 and 26 are unable to supply the demand.
Abilene-Chapman area--Waters from 10 wells (39, 40, 41, 45, 46,47,56,57,61, and 62) that tap alluvium in Smoky Hill Valley between Abilene and the Dickinson-Geary County line, the area which is here referred to as the Abilene-Chapman area, were analyzed. Most of the waters in this area are hard calcium bicarbonate waters similar in chemical character to those in the Junction City area. The hardness of the samples analyzed ranged from 348 to 622 parts per million and averaged 491 parts. Calcium is the predominant basic constituent in all the waters, and bicarbonate is the .predominant acidic constituent in all but the waters from wells 40 and 41 at Chapman. Sulfate exceeds bicarbonate in the water from well 40 and is nearly equal to the bicarbonate in the water from well 41.
Chloride in 8 of the 10 samples amounted to less than 100 parts per million, and in 6 samples it was less than 30 parts per million. Samples from the city wells (56 and 57) at Enterprise contained 187 and 216 parts of chloride. The iron content of the samples ranged from less than 0.1 to 7 parts per million. Four (45,47, 61, and 62) of the waters contained more than 1 part per million of Iron.
Sand hills area--Ground waters in the terrace deposits that underlie the dune sand in the area north of Smoky Hill Valley between Abilene and Solomon, although moderately hard, are the least mineralized of any of the waters sampled in the entire Smoky Hill Valley area. Samples 70 and 73, of waters from the terrace deposits, contained 239 and 265 parts per million of dissolved solids, had hardnesses of 168 and 184 parts, and 2.0 and .05 parts of iron, respectively. In both of these samples, calcium and bicarbonate were the predominant basic and acidic constituents, respectively. Analyses of samples 70 and 73 are shown graphically in Figure 13. Sand Springs (73), which derives water indirectly from the terrace deposits, is the source of the Abilene water supply.
Solomon area--This area takes its name from the City of Solomon in western Dickinson County, and includes Smoky Hill Valley between Abilene and New Cambria and the lower part of Solomon Valley. Analyses of 17 samples of water collected from wells in the Solomon area are given in Table 9. In addition to these, Table 10 gives the chloride content of 19 samples taken from test holes. Ground waters in the Solomon area differ greatly in content of dissolved mineral matter.
Samples from wells 65, 87, and 91, in alluvium near the edge of the sand hills between Abilene and Solomon, had the lowest concentrations of dissolved mineral matter of any of the samples collected from alluvium in the entire Smoky Hill Valley area. Samples 65, 87, and 91 were calcium bicarbonate waters and contained 335, 290, and 394 parts per million of dissolved solids and had hardness of 292, 274, and 280 parts, respectively. The iron and chloride concentrations were relatively low in all three samples. These samples doubtless represent waters of mixed originwaters of low mineralization from the terrace deposits mixed with more highly mineralized waters from other parts of the alluvium. Analyses of two samples from the terrace deposits, three samples from alluvium back from the sand hills, and two samples of mixed water from alluvium near the sand hills are shown graphically in Figure 13.
Figure 13--Analyses of waters from six wells and one spring (73) illustrating the mixing of slightly mineralized water from terrace deposits with more highly mineralized water from alluvium. Numbers refer to wells and spring described in text. Numbers 87 and 91 are mixed waters from alluvium near the edge of the sand hills.
Waters from alluvium in other parts of the Solomon area are in general of very poor quality, as indicated by the analyses of waters from 13 wells (76, 79, 81; 86, 93, 94, 95, and 98 in Smoky Hill Valley and 100, 101, 108, 110, and 111 in Solomon Valley). In addition to these analyses, chloride determinations for 16 other samples taken from test holes drilled in the Solomon area were made. All test hole samples were taken from the base of the alluvium. The distribution of the waters with respect to total hardness and their content of dissolved solids, chloride, and sulfate is shown in Table 14. Although they differ in content of dissolved mineral matter, most of the waters are highly mineralized. About two-thirds of the waters had more than 1,000 parts per million of dissolved solids. All the waters are very hard, about 90 percent having a hardness of more than 400 parts per million and about 50 percent a hardness of more than 1,000 parts, Although the waters in the Solomon area are similar with respect to hardness, they differ greatly in composition. The predominant basic and acidic constituents were, respectively, calcium and bicarbonate in samples 76, 93, and 110; calcium and sulfate in samples 79, 86, 100, 108, and 111; and sodium and chloride in samples 94, 95, and 101. In sample 81 calcium was the predominant basic constituent and bicarbonate and sulfate, which were present in about equal amounts, were the predominant acidic constituents. In sample 98 the concentrations of calcium and sodium were about equal and bicarbonate was present in the greatest concentration of the acidic constituents. The poor quality of the waters in alluvium in the Solomon area probably is the result of contamination by highly mineralized waters from the underlying Wellington formation (Permian). Gypsum and salt, both of which are easily dissolved in water, occur in the Wellington formation. The gypsum is undoubtedly the source for the high sulfate concentrations found in some of the waters from alluvium in this area. The sulfate content of nine waters was more than 300 parts per million and four had more than 1,000 parts of sulfate. A sample of water from well 85, which is in an unnamed tributary valley south of Solomon that drains an area of gypsum-bearing rocks, contained 1,320 parts per million of sulfate.
Table 14--Number of samples according to ranges, in parts per million, of dissolved solids, total hardness, sulfate, and chloride in waters from wells and test holes in alluvium in the Solomon area.
| Constituents, parts per million |
Number of samples |
|
|---|---|---|
| Dissolved solids: | ||
| Less than 500 | 1 | |
| 500-1,000 | 3 | |
| 1,001-3,000 | 6 | |
| 3,001-5,000 | 2 | |
| More than 5,000 | 1 | |
| Total hardness: | ||
| Less than 400 | 1 | |
| 400-500 | 3 | |
| 501-1,000 | 2 | |
| More than 1,000 | 7 | |
| Sulfate: | ||
| Less than 100 | 2 | |
| 100-300 | 2 | |
| 301-500 | 3 | |
| 501-1,000 | 2 | |
| More than 1,000 | 4 | |
| Chloride: | ||
| Less than 100 | 10 | |
| 100-250 | 4 | |
| 251-500 | 1 | |
| 501-1,000 | 2 | |
| 1,001-5,000 | 7 | |
| More than 5,000 | 5 | |
Of the 29 samples for which chloride determinations were made, 14 contained more than 500 parts per million of chloride, 12 contained more than 2,000 parts, and 5 contained more than 5,000 parts. The distribution of chloride in the Solomon area is shown in Figure 11. The greatest concentration of chloride-47,000 parts per million-was found in the sample from test hole 102, which was drilled in Solomon Valley near the tip of the divide that separates Solomon Valley from Smoky Hill Valley (Pl. 1). Samples from test holes 104 and 105 and well 101, northeast of test hole 102, had 15, 100, 580, and 3,100 parts of chloride, respectively. Samples from wells (100, 108, 110, and 111) and test holes (106, 107, 109, 112, and 113) in other parts of Solomon Valley were relatively low in chloride. Because of a higher specific gravity, waters high in chloride tend to concentrate in the lower part of the alluvium. In places in the Solomon area shallow wells may yield waters low in chloride, whereas deeper wells in the same vicinity may yield waters high in chloride. Water from well 98, a shallow well east of New Cambria, contained only 175 parts per million of chloride. Samples 97, 99, and 114 from test holes that tapped the lower part of the alluvium in the same area had 2,900, 10,000, and 780 parts of chloride. The chloride content of waters from four shallow wells (76, 79, 81, and 86) in that part of Smoky Hill Valley south of the river between Solomon and Abilene ranged from 23 to 278 parts per million. Of six samples collected from the lower part of the alluvium in this same area, one (75) contained 32 parts per million of chloride and five (78, 80, 82, 83, and 84) contained from 1,940 to 8,400 parts of chloride.
The City of Solomon formerly obtained its water supply from two wells in the southeastern part of town. These wells were abandoned in 1942, however, because the water had become excessively salty. In an effort to determine the limits of the salty water, the Division of Sanitation of the Kansas State Board of Health in 1940 collected samples from 22 private wells in Solomon and analyzed them for chloride. Samples from wells in the northern and northeastern parts of town contained relatively small amounts of chloride. Waters low in chloride from terrace deposits to the north probably migrate into the alluvium in these areas. Most of the waters from wells in the southern and western parts of Solomon were salty. Abandoned brine wells on the west side of Solomon River about 1 mile west of Solomon, which were used about 40 years ago by a salt company, are believed by many residents of Solomon to be the source of the salt water. The land on which the salt company was located is now fanned and there remains no evidence of the factory or the wells. The distribution of waters high in chloride, as shown in Figure 11, indicates that the occurrence of salty water in the Solomon area is a natural condition and cannot be attributed to the abandoned brine wells. Furthermore, the brine wells were drilled here because of the occurrence of a salt-water spring west of Solomon (Bailey, 1902, p. 72). The exact location of the salt-water spring is not known, but residents of Solomon report that it was in the bank of Solomon River near the site of the brine wells.
Most of the samples from the Solomon area, other than those from wells near the sand hills, contained excessive iron. Of the 13 samples analyzed, only one (95) had less than 0.1 part per million of iron, three (76, 98, and 108) had between 0.1 and 1.0 part, seven (81, 86, 93, 94, 100, 101, and 110) had between 1.1 and 5 parts, and two (79 and 111) had more than 5 parts.
Salina area--The Salina area includes Smoky Hill Valley from a point about 3 miles above Salina to New Cambria, the part of Saline Valley in Saline County, and the lower part of Mulberry Creek Valley. Nearly all the samples from wells in this area were very hard calcium bicarbonate waters, Analyses of six representative samples are shown graphically in Figure 8.
Of twelve samples collected from wells in Smoky Hill Valley in the Salina area (118, 123, 126, 168, 171-175, 190-192), 11 contained 498 to 843 parts per million of dissolved solids and had 408 to 563 parts of hardness. The chloride content of these waters was relatively low and the iron content ranged from less than 0.1 to 2.5 parts per million. The water from well 190, which is situated in a short, broad reentrant of Smoky Hill Valley southwest of Salina, was somewhat harder and more mineralized than other waters from Smoky Hill Valley. It (sample 190) contained 1,202 parts per million of dissolved solids, 340 parts of chloride, and 6.4 parts of iron, and had a hardness of 772 parts.
Waters from wells tapping alluvium in Saline Valley ranged from hard, moderately mineralized waters (samples 143, 144, and 145) to very hard, highly mineralized waters (samples 139 and 140). Samples 143, 144, ancl145 were of calcium bicarbonate waters that contained, respectively, 578, 462, and 395 parts per million of dissolved solids and had 425, 344, and 294 parts of hardness. Samples 139 and 140 were collected from two wells about 200 feet apart, one 68.7 feet deep and the other 30 feet deep. Both wells yield very hard, highly mineralized waters. Water (sample 140) from the shallow well contained 1,626 parts per million of dissolved solids, 91 parts of chloride, 1.4 parts of iron, and had 1,004 parts of hardness. Water (sample 139) from the deep well contained 3,681 parts of dissolved solids, 400 parts of chloride, and 6.2 parts of iron, and had 1,704 parts of hardness.
Most of the waters from Saline Valley had relatively low amounts of chloride. Of 12 waters analyzed for chloride, eight had 50 parts per million, or less, of chloride and four (samples 139-142) had 91 to 400 parts. The four waters having the highest concentrations of chloride were all from wells and test holes in sees. 27 and 28, T. 13 S., R. 3 W.
Samples of water were collected from two wells (146 and 147) in Mulberry Creek Valley, the analyses of which are shown graphically in Figure 8. One sample (146) was a hard calcium bicarbonate water that contained 846 parts per million of dissolved solids and had 487 parts of hardness. The other sample (147) was of a very hard, highly mineralized water, in which calcium was the predominant basic constituent and chloride was the predominant acidic constituent. This sample (147) contained 1,499 parts per million of dissolved solids and 355 parts of chloride, and had 838 parts of hardness.
Assaria area--The Assaria area includes Smoky Hill Valley in Saline County above the Salina area. Samples from four wells (226, 227, 237, and 238) in this area were of hard to very hard calcium bicarbonate waters that contained 566 to 876 parts per million of dissolved solids and 0.25 to 3.4 parts of iron, and had 376 to 655 parts of hardness.
Dry Creek Valley--Only one sample of water was collected from Dry Creek Valley. This sample, which was collected from a farm well (210) about 1 mile east of Smolan, mayor may not be representative of waters in alluvium of Dry Creek Valley. It was a very hard, highly mineralized water that contained 1,362 parts per million of dissolved solids, 380 parts of chloride and 0.76 part of iron, and had 886 parts of hardness.
Prev Page--Ground Water || Next Page--Well Records
Kansas Geological Survey, Geology
Placed on web Nov. 13, 2013; originally published October 1949.
Comments to webadmin@kgs.ku.edu
The URL for this page is http://www.kgs.ku.edu/Publications/Bulletins/84/06_grou2.html