![]()
Prev Page--Structure || Next Page--Sluss-Smock Pool
Oil and Gas Sands
General Statement
The oil- and gas-bearing beds in the Eldorado field probably number fifteen to twenty, but in many of these only "showings" are reported. Some of the latter appear to be but local porous areas in limestone, and may be considered erratic. Up to July 1, 1918, ten only of the beds had been found to contain sufficient quantities of oil and gas to sustain commercial production, and of these five produced oil and five produced gas. (See plate VI.)
The productive beds may be divided into three groups-a shallow oil series lying at depths generally less than 700 feet, an intermediate gas series between 800 and 1,550 feet in depth, and a deep oil series lying below 1,550 feet. Of the two productive sands in the shallow oil series, the 660-foot sand only was extensively exploited, whereas the other, the 550-foot sand, was productive in but two or three wells. Of the five productive sands in the intermediate gas-bearing series, the 900- and 1,275-foot pays were the most productive, and therefore the principal ones tapped. The other three are not as consistently productive, and hence were less exploited. Of the three productive sands in the deep oil series, the Stapleton is the prolific pay which yielded the gusher wells that made the Eldorado field famous. The Boyer and Stokes "sands" in July, 1918, were the producing beds in probably not over a dozen wells, but since then press reports indicate that the Boyer "sand" has been more generally exploited, especially on the Shumway dome.
Shallow Oil Sands
General Consideration
The shallow sands lie between 500 and 700 feet below the top of the Fort Riley limestone and probably within the Willard and Admire shales of the Wabaunsee formation. They are two in number-an upper sand about 550 feet below the top of the Fort Riley, and a lower sand about 660 feet below the Fort Riley, which produces practically all the shallow oil. It was the development of this 660-foot sand which was the principal feature in the Eldorado field during 1916. In addition to these sands a third and unproductive one lying about 20 feet above the 660-foot sand is often indicated in the well logs as a "stray sand."
550-Foot Sand
The highest pay sand is found about 550 feet below the Fort Riley limestone, and although representing the first of the shallow sands, its content of oil is so meager that but few wells obtain a profitable supply from it. Since this sandstone is not generally productive, most drillers make no effort to determine and record its presence in well logs. Where recorded, it appears to be coextensive with that of the shallow sand production; that is, on the Wilson, Chesney and Oil Hill domes. Its further extent is also possible, but through the lack of trustworthy well-log information, its limits cannot be more accurately defined. The reported thickness ranges from 1 to 22 feet, but generally it averages between 5 and 7 feet.
So far as the writer could ascertain, but two wells had been drilled to the 550-foot sand prior to July, 1918, for the purpose of extracting its oil. Both of these are in sec. 28, T. 25 S., R. 5 E., and their initial productions were reported to be 15 and 50 barrels, respectively. A few of the logs of the 660-foot-sand wells report gas in this more shallow sand, and for one well in sec. 21, T. 25 S., R. 5 E., an estimate of 500,000 cubic feet per day open-flow volume was given. Since most of the shallow wells were drilled to produce from the more prolific 660-foot sand, the oil in the 550-foot sand was greatly neglected. According to present information it would seem possible to increase the production from this sand, not only by drilling additional wells, but perhaps, if invading water does not prevent, by raising the casing in the 660-foot-sand wells after the production in the deeper pay becomes so low as to be unprofitable.
660-Foot Sand
General Statement. Samples of the 660-foot sands were obtained from but two wells, and these showed it to be formed of rather pure and rather well-rounded, comparatively fine quartz grains with a calcareous cement. These characters probably are uniform throughout its extent in the field.
Areal Distribution. The sand extends over considerable territory outside of its producing area, as shown by the distribution of shallow sand wells on plates I and XIV, but because it does not produce throughout its extent, drillers generally ignore its presence and do not record it in their logs. The logs, therefore, are not sufficient for tracing its full extent. Numerous wells drilled expressly for production from this sand report "no sand." This condition may not always be the case, however, for its "absence" may be due to the absence of oil in these localities, which with many drillers is the only criterion used to determine the presence of a sand.
Thickness. Over much of the productive area the 660foot sand averages about 10 to 20 feet in thickness. Locally it is thicker or thinner, and, as mentioned before, in several places it is recorded as entirely absent.
In some places it is interpreted by the writer that the thinning is compensated by a corresponding thickening of the underlying shale; that is, the lower part of the sand present in some places is missing at other places. In still other places the lower part of the bed seems persistent, but the sand thins through the absence of the upper part, whose place is occupied by a thickened portion of the overlying shale. The latter condition has apparently produced some small irregularities in the contours drawn on the top of the sand, as shown on plate XIV, which may be interpreted as minor domes and synclines. If these features have been correctly interpreted, the domes and synclines resulting from them must not be considered structural features, but depositional features instead. One locality, where the thinning of the sand appears to cause an irregularity in the structure contours, is in the north part of sec. 21, T. 25 S., R. 5 E. This detail is to be observed in contours drawn on the top of the 660-foot sand on plate XIV, where the reentrant syncline on the north side of the Chesney dome is probably due to such a thinning, causing a secondary dome at the south quarter corner of section 16. A similar slight thinning probably causes the double apex on the Oil Hill dome. A third thinning, and possible elimination (some wells report "no sand"), extends across sec. 31, T. 25 S., R. 4 E. A fourth thinning and complete elimination of this sand causes the marked reentrant in the structure contours near the south quarter corner, sec. 32, T. 25 S., R. 5 E. Another such thinning and probable elimination causes the "dome" present in sec. 6, T. 26 S., R. 5 E.
These above-mentioned minor irregularities in the structure contours, which are shown on plate XIV, represent the attitude of the top of the sand and are probably in large part due to its variation in thickness.
Structure. Outside of the minor irregularities of surface due to thinning, the general structure of the sand is similar to the structure of the surface rocks. On the Wilson dome the folding of the 660-foot sand is remarkably parallel to that of the surface rocks. One feature, and an important one, as will be discussed later, is the apparently greater amount of folding in the 660-foot sand than in the surface rocks. The closure in the 660-foot sand certainly exceeds 50 feet, and if accurate information were available would probably exceed 60 feet. This is in contrast to the 40- to 50-foot closure in the surface rocks.
The Chesney dome is modified by thinning as previously discussed. If it were not for this the contours drawn on its top would be very similar to those of the surface rocks. The closure in the 660-foot sand is practically 40 feet; here also in excess of the closure of the surface rocks, about 20 feet.
The Oil Hill dome in the 660-foot sand is modified by some local thinning, producing a secondary apex near the east quarter corner, section, 33, which may be present in the surface rocks, but because of the absence of mappable horizons in the latter at this immediate point it is not apparent. The closure in the 660-foot sand amounts to 42 feet (not fully indicated by contours), which here also is greater than that in the surface rocks, which probably (not certainly) is but slightly greater than 25 feet.
As discussed above, there is what appears to be an anticline near the northeast corner, sec. 6, T. 26 S., R. 5 E. This is not due to structure, as such, but to the attitude of the top of the sand caused by a pinching out of the bed to the southwest. This conclusion is supported, but not proved, by the fact that no similar structure is present in the surface rocks. Near the northeast, corner, sec. 19, T. 25 S., R. 5 E., which is outside of the principal producing areas, is a small area where the 660foot sand is producing under irregular conditions. The top of the sand does not have the same attitude as the surface rocks, nor is its structural relation to the shallow sand on the Wilson and Chesney domes apparent.
Production. The 660-foot sand produces oil only. A few wells encountered some gas in the top of the sand, but not in sufficiently large quantities to make profitable gas wells.
During the early development of this sand the initial productions of the wells generally ranged from 40 to 80 barrels, although several wells were brought in with productions of 100 barrels or more. Some of these f.owed for a short time, but the rapid decline soon necessitated pumping. After the early flush production was passed the initial production of new wells declined until in 1918 they averaged about 20 barrels. Up to this time very few wells had been drilled to this sand whose initial capacity was less than 10 barrels. The productivity of the wells bears a slight but not marked relation to their locations on the domes; that is, the initial productivity of wells on the apexes of the domes is usually slightly larger than those one-half to three-quarters of the way down on the flanks. At the margin of the productive areas, however, and in the localities where the sand is thin, there is a corresponding lower initial production. It is here that the low yields-five to ten barrels are met, and, too, it is in these wells that the ingress of water was first noticeable.Gas "Sands."
Distribution of the "Sands."
The strata of the Eldorado field which are reported in well records to contain gas number ten to fifteen, and possibly more, but up to the spring of 1918 those which were proven to contain commercial quantities numbered but five. Named according to their approximate stratigraphic distance below the top of the Fort Riley limestone, they are the 900-, 1,125-, 1,200-, 1,275- and 1,475-foot "sands." In places the distinction of the middle three is riot sharply defined; and where this is the case they are grouped and spoken of as the 1,200-foot sand. In the stratigraphic section given in plate VI it may be seen that all five gas "sands" are included in the Shawnee and Douglas formations. The strata from which the gas is obtained are in practice termed "sands," but so far as the writer could ascertain this is for the most part a misnomer; they probably are porous layers in limestone. The locations of the more or less productive gas areas are usually found in drilling oil wells, and from the locations thus determined the gas is then later exploited by drilling special wells. This indicates a more or less pockety distribution, due, no doubt, to the locations of the more porous parts of the gas-bearing strata. Although the nature of the limestones determines the locations of the gas occurrences, it is only where this feature is high on the domes that the gas is found. Its distribution is much more confined to the apexes of the domes than the oil in either the 660-foot sand or the Stapleton zone. In fact, its areal distribution is about one-third that of the oil, as shown in figure 2. The controlling feature in the accumulation of the gas appears to be a combination of the structure and the relative position of the more porous portions of the gas-bearing limestones. It is to be noted that no gas wells are located on the Robinson dome or the Koogler nose.
Figure 2—Map of the El Dorado field, showing extent of the gas-producing territory in comparison to that of the oil-producing territory.
Discontinuity of the various "sands"-or perhaps, more correctly, their porous parts-is indicated in the distribution of the wells obtaining their supply from the different horizons as indicated in the following table, which shows the principal productive localities for each "sand."
| Table showing distribution of production from the various gas sands. | ||||||||
|---|---|---|---|---|---|---|---|---|
| "Sand." | Shumway dome |
Boyer dome |
Koogler nose |
Bancroft syncline |
Oil Hill dome |
Chesney dome |
Wilson dome |
Robinson dome |
| 900 ft | + | + | + | |||||
| 1,125 ft | + | + | + | |||||
| 1,200 ft | + | + | + | + | + | |||
| 1,275 ft | + | + | + | + | + | |||
| 1475 ft | + | |||||||
The 900-foot "sand" produces principally on the Oil Hill and Boyer domes and in the north part of the elongated Shumway dome. But few wells obtain their gas supply from the 1,125-foot "sand," and these are scattered over the same folds as the 900-foot "sand." The 1,200-foot "sand" is the producing bed in a few more wells than the 1,125-foot "sand," and also is more widely scattered, being productive on the Wilson, Oil Hill, Boyer and Shumway domes and the minor Bancroft syncline. The 1,275-foot "sand" is productive principally on the Wilson, Chesney, northeastern part of the Oil Hill and the northern part of the Boyer domes. It is to be noted that this is the only "sand" thus far productive on the Chesney dome. The deep "sand" found at 1,475 feet beneath the top of the Fort Riley limestone is more restricted in its productivity than the others. It is confined almost altogether to the Shumway dome.
Structure
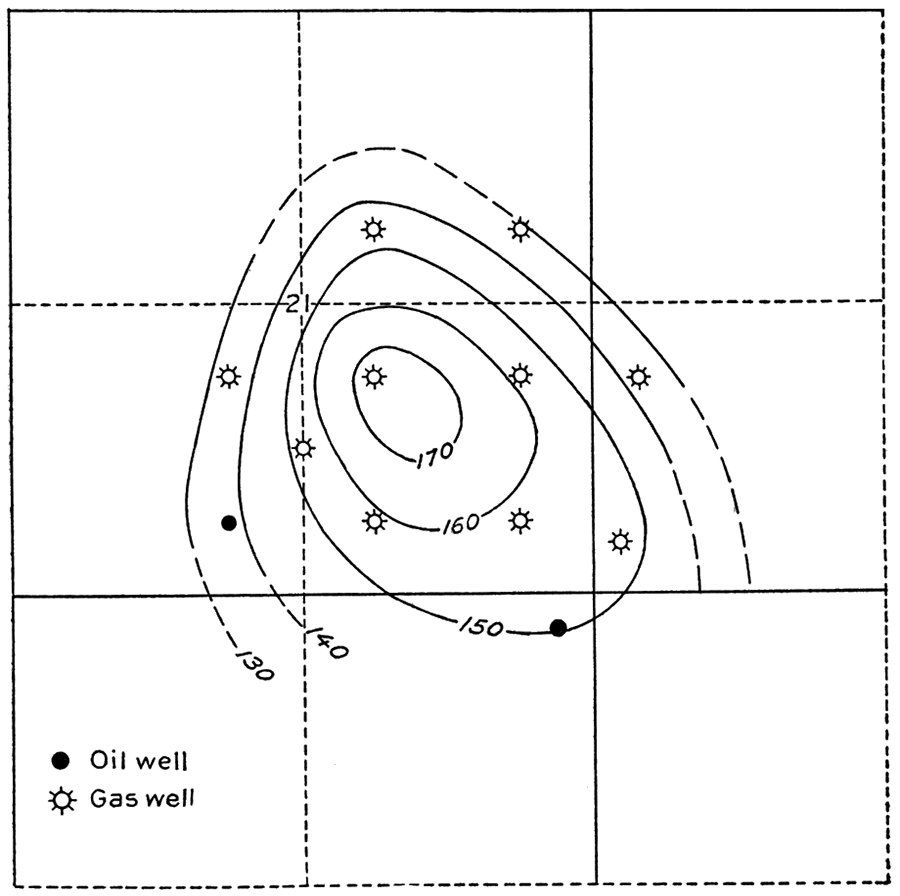
In a few localities sufficient wells have been drilled to the gas "sands" so that these productive zones can be contoured and their structure studied. This was possible for the 1,275-foot gas "sand" on the Chesney dome and the 900-foot gas "sand" on the Boyer dome. The structure of the 1,275-foot "sand" on the Chesney dome, as given in figure 3, is very similar to the folding of the 660-foot oil sand. The amount of closure is equally as great as, and possibly greater than, that of the 660-foot sand, indicating an increase in the amount of apparent folding of the beds with depth on this structural feature-a feature which was pointed out in the discussion of the 660-foot "sand" in relation to the surface rocks.
Figure 3—Contour map of the Chesney dome, showing structure of the 1,275-foot gas "sand."
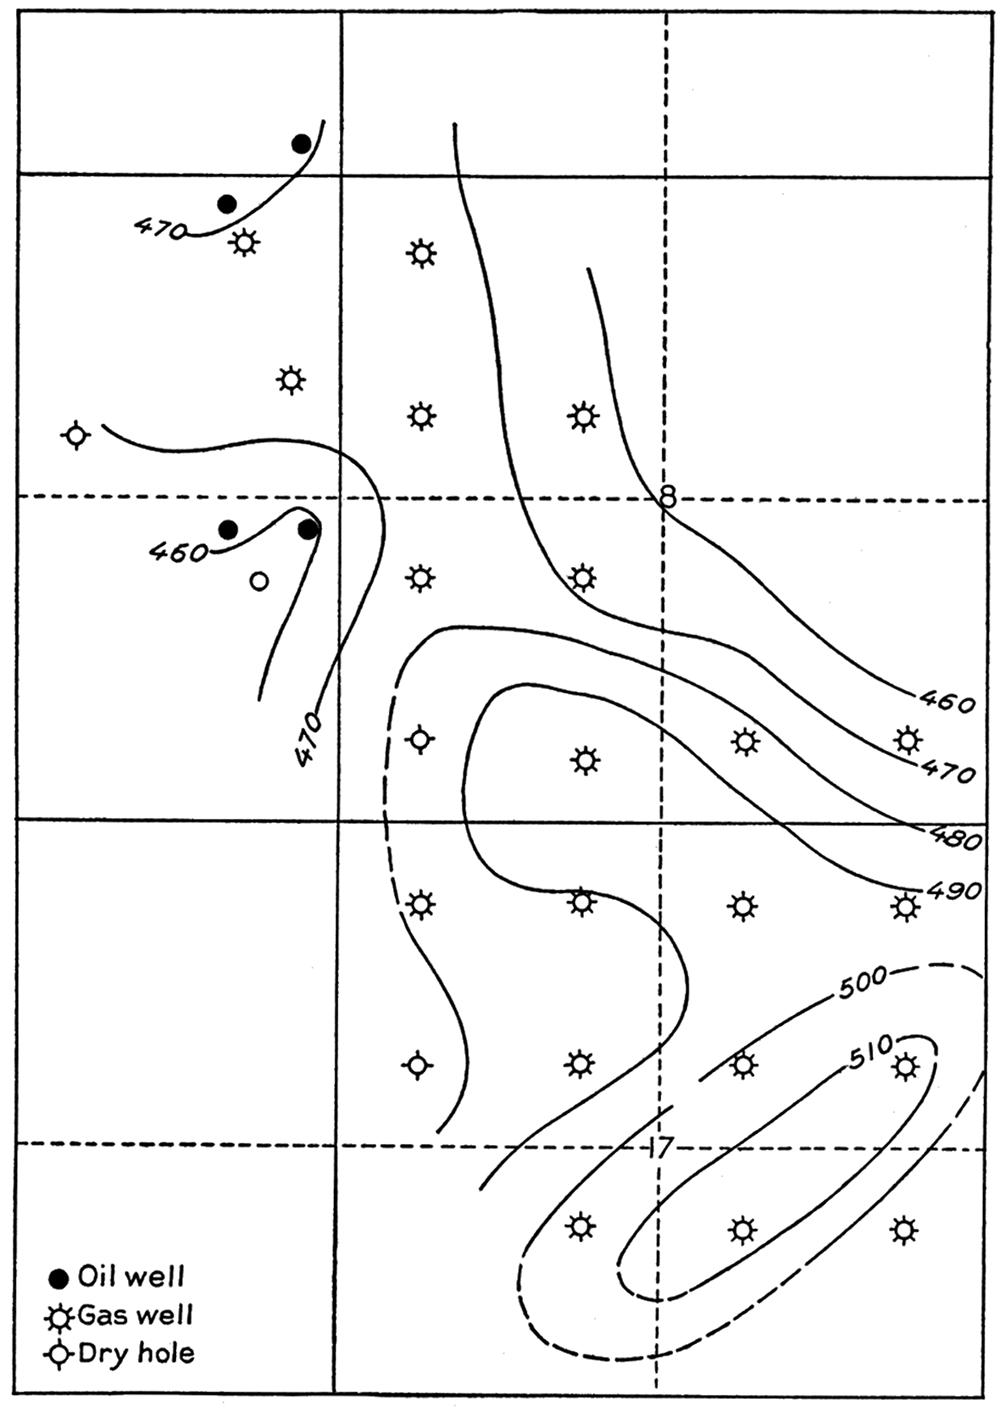
The structure of the 900-foot gas "sand" on the Boyer dome is shown in figure 4. It is not so readily determinable as that of the 1,275-foot "sand," described above, since it does not conform closely to the structure of the surface rocks nor to that of the Stapleton sand. A northeasterly trending minor fold is suggested crossing the southeast quarter of section 17, which is not indicated in the structure of the surface rocks (see plate 1), nor in that of the Stapleton pay zone (see plate XIV). As will be pointed out in the discussion of the Stapleton pay zone, the Boyer dome represents the poorest exhibition of conformity between the structure of the surface and underground rocks, and it would seem that the 900-foot gas "sand" accords well with this fact.
Figure 4—Contour map of the Boyer dome, showing structure of the 900-foot gas "sand."
Production
Total Field Production. Much of the gas produced in the Eldorado field during 1916 and 1917, and practically all of it produced since then, is used for development purposes, principally under boilers and in gas engines which pump the oil wells.
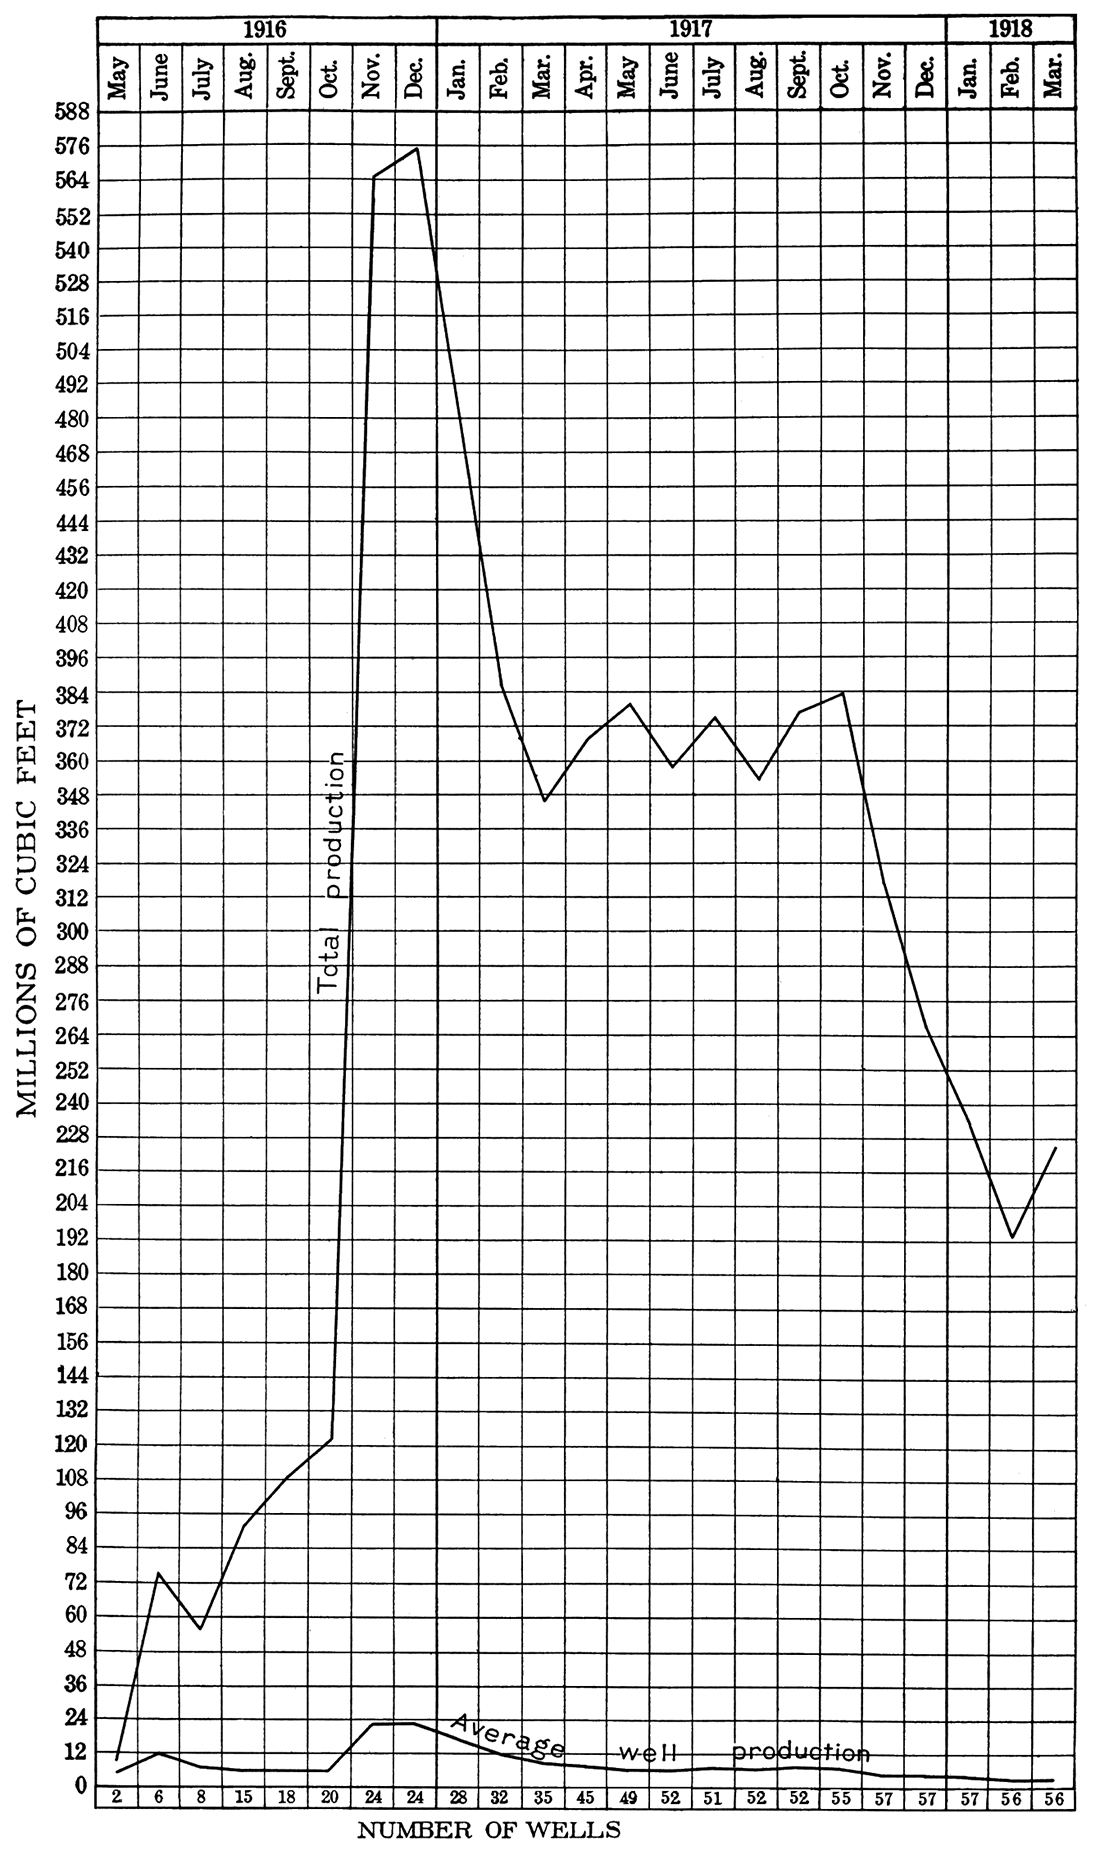
The gas used on many of the leases where it originates is not metered, and for this reason gas-production data for the entire field cannot be determined accurately. Production data covering the gas wells owned by the Empire Gas and Fuel Company, which represent approximately three-fourths of the gas wells of the field, are graphically indicated in figure 5, which gives the total and average well production per month, for the period from May, 1916, to March, 1918. The total production of these 69 gas wells during this period amounted to 6,660,276,000 cubic feet, and if this be considered as three-fourths of the production for the entire field, then the Eldorado field produced a total of 8,880,356,000 cubic feet prior to April, 1918.
Figure 5—Graph showing total gas production and average well production per month of 69 gas wells over a period of 23 months.
A rough estimate was made of the proportion which this total production bore to the original total gas content of the field. This was obtained by determining how much the average original rock pressure for all the "sands" had been reduced by the total production. The determination of the original rock pressure for each "sand" was first obtained by assuming it to be the initial closed rock pressure of the first well tapping it where this pressure was not exceeded in some later well. If this first well did not have the highest initial closed rock pressure, then an average was taken of the pressure of the first well and the highest closed rock pressure of any later-drilled well. The pressure thus obtained for each "sand" was as follows:
| 900-foot "sand" | 332.5 lbs. per sq. in. |
| 1,125-foot "sand" | 460. 0 lbs. per sq. in. |
| 1,200-foot "sand" | 450.0 lbs. per sq. in. |
| 1,275-foot "sand" | 462.5 lbs. per sq. in. |
| 1,475-foot "sand" | 382.5 lbs. per sq. in. |
The relative extent or capacity of the reservoirs of these "sands" for this field was considered by the writer to be roughly indicated by the number of wells drilled to each; hence to obtain an average for the original closed rock pressure for the field the above "original pressures" for the various "sands" were weighted according to the number of wells drilled to each, and the resulting average was calculated to be 393 pounds.
If this pressure of 393 pounds per square inch is considered to be the average original rock pressure for all the gas "sands" in the Eldorado field, and a production of 8,880,356,000 cubic feet reduced this pressure to 108 pounds by March, 1918, then the total production, 8,880,356,000 cubic feet, is to the total amount of gas originally in the field as the decrease in the rock pressure, 285 pounds, is to the original rock pressure, 393 pounds. [Note: One hundred and eight pounds is the average as shown by the curve in figure 6, whereas 98 pounds was the average determination.] The solution of this proportion gives the total amount of gas originally in the field as about 12,245,000,000 cubic feet, of which the production up to March, 1918, represented 73 per cent. This, of course, represents but a rough approximation. The possibility that encroaching water under high pressure is keeping up the gas pressure, thereby making the above calculated original volume too large, or that there is a lag in the rock pressure due to friction in passing through the pay sand, which diminishes the pressure at the well, thereby causing the calculated volume to be too small, were not taken into consideration. In the absence of porosity determinations for the various sands-a feature whose average would be quite difficult to ascertain, inasmuch as the rock is a porous limestone with a probable varying porosity-no attempt was made to determine the original amount of gas in the field by estimating the amount of pore space in conjunction with the average original rock pressure.
The graph in figure 5 shows that from May to October, 1916, but a small part of the potential production was taken from the wells, but that during the following cold months, when much of the gas was supplied to the town of Eldorado for domestic use, the wells were drawn on for a large part of their available production. The high production maintained during most of 1917 was used for field development by a constantly increasing number of wells drilled. During the winter of 1917-'18 but little if any gas was sold for domestic use, and the marked slump during this period may be accounted for by the great curtailment of drilling operations caused by the severe cold weather. Assuming that the graph in figure 5 represents but three-fourths of the total production for the field, the average daily production (reduced from the monthly production of the graph) reached a maximum of 25,572,800 cubic feet during December, 1916; and that in March, 1918, the last month for which production figures are given, was 10,005,244 cubic feet.
Initial Open-Flow Capacities. The productivity of the wells when drilled in varies greatly. Of seventy-nine wells whose records were accessible, the largest open-flow volume measured 21 million cubic feet per day. Three others had open-flow capacities of 10 million or more, and those with capacities of 5 million or more but less than 10 million numbered eleven. The remaining sixty-three had initial open-flow volumes of less than 5 million cubic feet. The 1,275-foot "sand" leads in the initial size of its wells, four wells with capacities of 10 or more million obtaining their supply from this "sand." The 900-foot "sand" yielded five wells with open flows greater than 5 million but less than 10 million, and the 1,475-foot "sand" furnished four similarly sized wells. This information is summarized in the following table. It is to be noted that the information here given differs slightly from that given on figure 7, which referred to but sixty-eight wells.
| Table showing initial open-flow volumes of 79 wells whose records were available. | |||||
|---|---|---|---|---|---|
| Sands | |||||
| 900-foot | 1,125-foot | 1,200-foot | 1,275-foot | 1,475-foot | |
| Number of wells with volumes of 10 million or more cubic feet | 4 | ||||
| Number of wells with volumes of 5 million or more, but less 4 than 10 million cubic feet | 5 | 2 | 4 | ||
| Number of wells with volumes of I million or more, but less than 5 million cubic feet | 31 | 5 | 5 | 8 | 8 |
| Number of wells with volumes less than I million cubic feet | 2 | 3 | 1 | 1 | |
| Total wells | 36 | 7 | 8 | 15 | 13 |
| Average initial volume, in millions of cubic feet per day | 2.8 | 1.6 | 1.1 | 6.2 | 3.4 |
Decline in Rock Pressure and Open-Flow Volume. The large initial productions of these wells is exceedingly short lived. The withdrawing of gas lowers the rock pressure, and the productivity, which is largely dependent on the rock pressure, declines at nearly the same rate. The decline in productivity varies for the different sands. Also, those with large initial open-flow volumes decrease most rapidly, which is to be expected, since it is the large wells which are drawn upon most generously, and those with small initial open-flow volumes decrease more slowly.
The decline in productivity is generally studied in the decline of rock pressure, upon which the productivity is in large part dependent. When first "drilled in," the closed rock pressures of those wells whose records were available varied from 110 to 510 pounds per square inch. That the rock pressures vary also for the wells producing from the different "sands" has previously been pointed out.
Consideration will first be directed to the decline in rock pressures of seven wells on the Chesney dome which produce from the 1,275-foot "sand." The bimonthly determinations of their closed rock pressures during a period of about two years are graphically shown in plate XV. It is to be noted that these wells were completed within a period of three months, and that except for wells F and G the decline has been very uniform. The reason for the exceedingly slow decline in well G is not apparent. It is possible that it was not drawn upon as much as the other wells.
The initial pressures of wells F and G, in that they are lower than the earlier completed wells, closely coincide with the principle formulated by Rogers (1918, p. 37), that in any gas pool the initial pressures of wells correspond closely to the existing pressures of the wells already producing. The apparent low initial pressure in curve a of plate XV is due to some cause, possibly insufficient penetration of the "sand," but this is compensated later by an increase when the full rock pressure in the sand became effective in this well.
The decline in sixteen wells (lettered a to p in the order of their completion) producing from the 900-foot "sand" on the Boyer dome is given in plate XVI. The heavy line which connects the initial rock pressures of the successively completed wells shows that wells j, k, l, m, n and o closely follow the principle of declining initial pressures formulated by Rogers, but wells i and p are specially marked discrepancies. It is possible that these discrepancies indicate some local sand condition, possibly lack of free access of gas throughout the porous reservoir. This may be due to the discontinuity of the porous gas-bearing layers, such as is to be expected more or less in limy strata.
A comparison of plates XV and XVI shows that the gas in the 1,275-foot "sand" on the Chesney dome originally had a much higher rock pressure-about 500 pounds-than the 900foot "sand" in the Boyer dome, with its average pressure of about 340 pounds. It is to be noted that at the end of May, 1918, the 1,275-foot "sand," with its higher initial rock pressure, retained its lead over the 900-foot "sand" by about 50 per cent. This difference in the rock pressures of wells producing from different "sands" is graphically shown in figure 6, which gives the averages of the wells producing from each "sand."
Figure 6—Decline curve of closed rock pressures based on the records of 68 wells grouped according to the "sands" from which they produce.
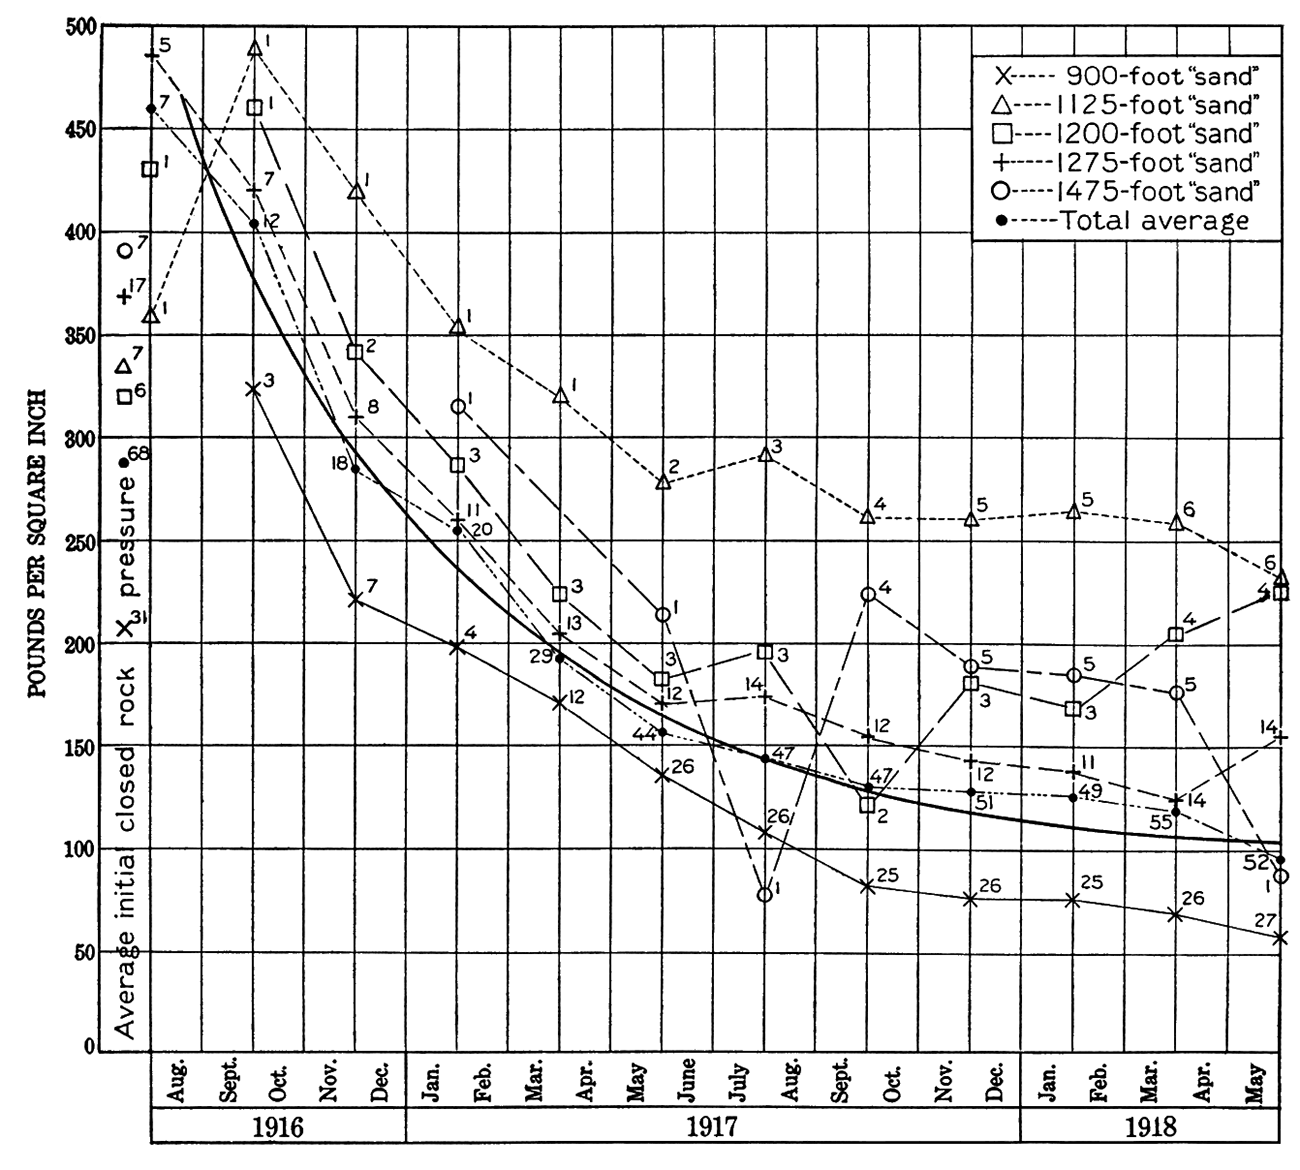
Although the 1,475-foot "sand" has the highest initial average closed rock pressure, its decline is more rapid than that of the 1,125-foot "sand." Similarly, the 1,275-foot "sand" has a higher average initial closed rock pressure than either the 1,125- or 1,200-foot "sands," but its decline is more rapid. By noting the number of wells from which the decline information was obtained, indicated by figures at the sides of the bimonthly determinations for each "sand," several interesting features may be deduced. The rapid decline of one 1,475-foot-"sand" well from January to July, 1917, is, noteworthy, and the increase thereafter in the average closed rock pressures of wells producing from this "sand" is due solely to the drilling of additional wells.
That the rock pressure does not completely govern the open-flow volume is illustrated by comparing the rock-pressure curve (figure 6) with the open-flow volume curve (figure 7). It will be noted that, whereas the 1,125-foot "sand" has the highest initial average closed rock pressure, the open-flow volume of its wells is less than that of the other "sands," with the exception of the 1,200-foot "sand." On the other hand, the 900-foot "sand" has the lowest rock-pressure-decline curve, but its decrease in open-flow volume is greater than that of all the other "sands." The 1,475-foot "sand," whose decline in closed rock pressure was noted as specially rapid, is even more marked in its rapid decline in open-flow volume. One of its wells-the sole producer from this "sand" between January and July, 1917 -completed on January 3, 1917, with an open-flow volume of 11,000,000 cubic feet, declined by the end of the month, when the first determination shown on the graph was made, to 4,500,000 cubic feet, and by July had reached the low figure of 280,000 cubic feet. The increase thereafter in the open-flow-volume determinations for this "sand" is due solely to the bringing in of new wells.
Figure 7—Decline curve of daily open-flow volumes based on the records of 68 wells grouped according to the "sands" from which they produce.
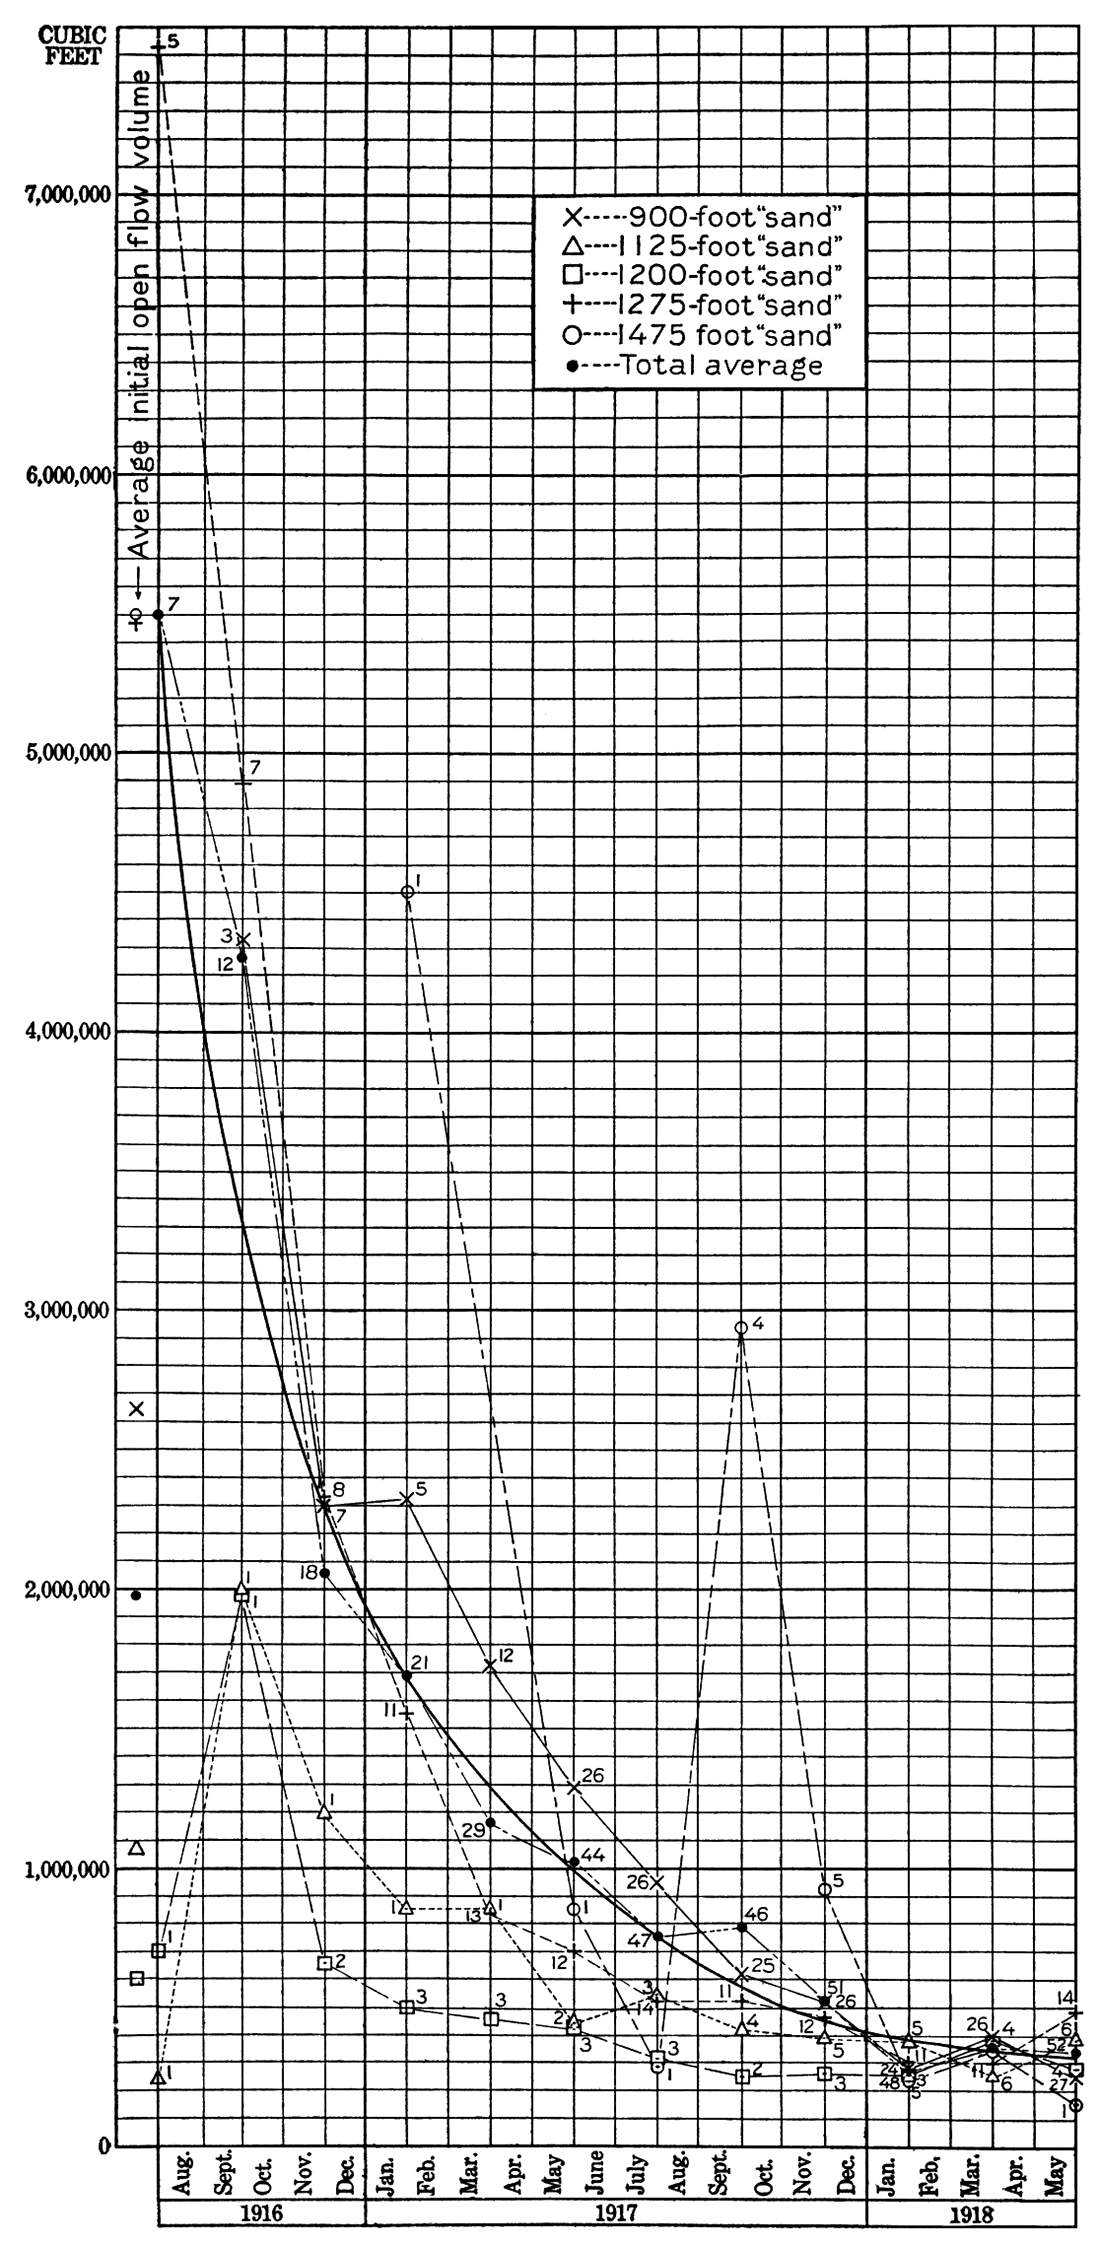
Life of Gas Production. A study of figures 6 and 7 would seem to indicate that the 1,475-foot "sand" wells cannot be relied upon to furnish any considerable part of the future gas supply. Its excessively rapid decline in open-flow volume, which necessitated the abandonment of four wells in February, 1918, after a life of less than six months, clearly shows the greater pockety nature of this "sand" in comparison to the more shallow "sands." The other "sands" show a more uniform decline in their production, and hence will continue to supply gas for at least a short time to come.
If, as roughly estimated on page 86, but 27 per cent of the original gas supply remained in the ground, the end of the Eldorado field as a producer of gas is not far distant. The time when the drilling of new gas wells will cease at Eldorado will probably not be before the average daily open-flow volume becomes less than 100,000 cubic feet.
Deep Oil "Sands"
Boyer "Sand"
The Boyer "sand," which is located in the lower part of the Douglas formation about 1,700 feet below the top of the Fort Riley limestone, was discovered on the Boyer lease in sec. 17, T. 26 S., R. 5 E., after which it is named. The discovery well had an initial daily production reported to have been 150 barrels. The productive portion of the "sand" in this vicinity is very limited, and although the discovery of the "sand" was made in July, 1916, but one additional well was completed in it in the immediate locality prior to 1919.
An oil-bearing "sand" at about the same stratigraphic position-which in this report will be considered the same-was found about two miles to the northwest on the Shumway dome in the Empire Gas and Fuel Company's Enyart well No. 10 (northwest corner location, sec. 12, T. 26 S., R. 4 E.), and Paulson well No. 2 (center location, NE SE, sec. 2, T. 26 S., R. 4 E.), which were completed during November, 1917, with initial productions of about 100 barrels. Further attempts to develop this "sand" on the Shumway dome were not made until late in 1918 and 1919, when, according to press reports, numerous wells were drilled to exploit the oil contained in it.
The Boyer "sand," according to drilling logs, is rather uniformly oil-bearing over the northern part of the Shumway dome; that is, in sec. 35, T. 25 S., R. 4 E., and in secs. 1, 2, 10, 11 and 12 of T. 26 S., R. 4 E. It has also been reported in the logs of a few wells on the Oil Hill dome. Even though rather widely oil-bearing over a part of the Shumway dome, the oil seems to be present in commercial quantities only along the crest of this fold.
Drill cuttings from the Boyer "sand" in Paulson well No. 2, previously cited, show that the oil is contained in a calcareous limestone, and a few well logs record the "sand" as limestone, from which evidence it seems reasonable to infer that the Boyer oil zone is contained in a calcareous limestone.
Most of the Boyer "sand" development on the Shumway dome was done after the completion of the field work on which this report is based, and hence the information here presented must of necessity be very meager. Following are the logs of the original Boyer "sand" well and of a Boyer "sand" well on the Shumway dome:
| Log of Empire Gas and Fuel Company's Fee Well No. 1 | |||
|---|---|---|---|
| Location, center of NW NE, sec. 17, T. 26 S., R. 5 E. Drilled April 25 to June 30, 1916. Elevation of well mouth, 1,377 feet, which is about 60 feet below top of Fort Riley limestone. Initial production, 100 barrels. Casing record: 15 1/2-inch, 100 feet; 12 1/2-inch, 670 feet; 10-inch, 920 feet; 8 1/4-inch, 1,590 feet; 2-inch, 1,670 feet. Log furnished by Empire Gas and Fuel Company. | |||
| Drillers' record | Thickness in feet |
Depth in feet |
Geological correlations by the writer |
| Lime | 34 | 34 | Florence flint |
| Lime | 6 | 40 | |
| Shale | 17 | 57 | |
| Lime | 8 | 65 | |
| Shale | 15 | 80 | |
| Lime | 20 | 100 | |
| Shale | 3 | 103 | |
| Lime | 7 | 110 | |
| Lime | 20 | 130 | |
| Shale | 5 | 135 | |
| Lime | 15 | 150 | |
| Shale | 55 | 205 | |
| Lime | 5 | 210 | |
| Shale | 20 | 230 | |
| Shale | 10 | 240 | |
| Lime | 20 | 260 | |
| Shale | 15 | 275 | |
| Lime | 25 | 300 | |
| Shale | 100 | 400 | |
| Shale | 15 | 415 | |
| Lime | 8 | 423 | |
| Shale | 6 | 429 | |
| Lime | 4 | 433 | |
| Shale | 17 | 450 | |
| Shale | 15 | 465 | |
| Lime | 20 | 485 | |
| Shale | 5 | 490 | |
| Lime | 10 | 500 | |
| Shale | 20 | 520 | |
| Mud | 8 | 528 | |
| Lime | 4 | 532 | |
| Red bed | 5 | 537 | |
| Mud | 2 | 539 | |
| Lime | 2 | 541 | |
| Shale | 5 | 546 | |
| Lime | 9 | 555 | |
| Shale | 3 | 558 | |
| Lime | 4 | 562 | |
| Lime-flint | 5 | 567 | |
| Shale | 3 | 570 | |
| Shale | 6 | 576 | |
| Lime | 9 | 585 | |
| Shale | 2 | 587 | |
| Lime | 2 | 589 | |
| Lime | 6 | 595 | |
| Shale | 3 | 598 | |
| Lime | 14 | 612 | |
| Shale | 8 | 620 | |
| Shale | 8 | 628 | |
| Lime | 4 | 632 | |
| Shale | 8 | 640 | |
| Lime | 4 | 644 | |
| Shale | 2 | 646 | |
| Lime | 4 | 650 | |
| Lime | 4 | 654 | |
| Shale | 12 | 666 | |
| Shale | 2 | 668 | |
| Lime | 5 | 673 | |
| Shale | 23 | 696 | |
| Lime | 8 | 704 | |
| Shale | 10 | 714 | |
| Lime | 15 | 729 | |
| Shale | 25 | 754 | |
| Lime | 40 | 794 | |
| Shale | 15 | 809 | |
| Lime | 3 | 812 | |
| Shale | 3 | 815 | |
| Shale | 55 | 870 | |
| Shale | 6 | 876 | |
| Sand | 6 | 882 | |
| Shale | 15 | 897 | |
| Lime, gas | 3 | 900 | 900-foot gas "sand." |
| Shale | 5 | 905 | |
| Shale | 15 | 920 | |
| Lime | 5 | 925 | |
| Shale | 25 | 950 | |
| Shale | 82 | 1,032 | |
| Lime | 33 | 1,065 | |
| Lime | 40 | 1,105 | |
| Break | 5 | 1,110 | |
| Lime | 50 | 1,160 | |
| Shale | 4 | 1,164 | |
| Shale | 3 | 1,167 | |
| Gas sand | 3 | 1,170 | |
| Sand | 15 | 1,185 | |
| Sand | 10 | 1,195 | |
| Lime | 49 | 1,244 | |
| Lime | 61 | 1,305 | |
| Lime | 65 | 1,370 | |
| Shale | 5 | 1,375 | |
| Shale | 20 | 1,395 | |
| Lime | 25 | 1,420 | |
| Shale | 50 | 1,470 | |
| Sand | 15 | 1,485 | |
| Shale | 80 | 1,565 | |
| Shale | 20 | 1,585 | |
| Shale | 2 | 1,587 | |
| Lime | 30 | 1,617 | |
| Shale | 20 | 1,637 | |
| Lime | 8 | 1,645 | |
| Lime | 8 | 1,653 | |
| Sand; oil | 25 | 1,678 | Boyer "sand." |
| Log of Empire Gas and Fuel Company's Paulson Farm Well No. 2 | |||
|---|---|---|---|
| Location, center of NE SE, sec. 2, T. 26 S., R. 4 E. Drilled September 5 to November 4, 1917. Elevation of well mouth, 1,395 feet, which is about 15 feet below top of Fort Riley limestone. Initial production, 100 barrels. Casing record: 12 1/2-inch, 14 feet; 8 1/4-inch, 825 feet; 6 5/8-inch, 1,300 feet; 5 3/16-inch, 1,644 feet; 2-inch tubing, 1,688 feet. Log furnished by Empire Gas and Fuel Company. | |||
| Drillers' record | Thickness in feet |
Depth in feet |
Geological correlations by the writer |
| Soil | 5 | 5 | |
| Lime, white, firm | 75 | 80 | Fort Riley limestone and Florence flint |
| Shale, white, soft | 15 | 95 | |
| Lime, gray, hard | 35 | 130 | |
| Shale, blue, soft | 20 | 150 | |
| Lime, gray, hard | 25 | 175 | |
| Red rock, red, soft | 10 | 185 | |
| Shale, white, soft | 20 | 205 | |
| Lime, gray, hard | 15 | 220 | |
| Shale, white, soft | 70 | 290 | |
| Lime, gray, hard | 35 | 325 | |
| Shale, blue, soft | 25 | 350 | |
| Lime, gray, hard | 15 | 365 | |
| Shale, dark, soft | 10 | 375 | |
| Lime, gray, firm | 55 | 430 | |
| Shale, white, soft | 25 | 455 | |
| Lime, gray, hard | 10 | 465 | |
| Shale, dark, soft | 15 | 480 | |
| Shale, white, soft | 15 | 495 | |
| Lime, gray, hard | 10 | 505 | |
| Shale, blue, soft | 25 | 530 | |
| Lime, white, firm | 15 | 545 | |
| Red rock, red, soft | 15 | 560 | |
| Shale, dark, soft | 10 | 570 | |
| Lime, gray, firm | to | 580 | |
| Shale, white soft | 40 | 620 | |
| Shale, blue, soft | 30 | 650 | |
| Lime, white, firm | 15 | 665 | |
| Shale, dark, soft | 20 | 685 | |
| Shale, white, soft | 55 | 740 | |
| Lime, gray, hard | 50 | 790 | |
| Sand, white, soft; water | 10 | 800 | |
| Lime, sandy, gray, firm | 20 | 820 | |
| Shale, white, soft | 10 | 830 | |
| Lime, gray, hard | 5 | 835 | |
| Shale, white, soft | 60 | 895 | |
| Sand, white, soft; 3,000,000 cu. ft. of gas; water | 25 | 920 | 900-foot gas "sand." |
| Lime, sandy, gray, firm | 30 | 950 | |
| Lime, gray, hard | 30 | 980 | |
| Shale, dark, soft | 25 | 1,005 | |
| Sand, white, soft; water | 10 | 1,015 | |
| Shale, dark, soft | 10 | 1,025 | |
| Sand, white, soft | 5 | 1,030 | |
| Sand, dark, firm | 10 | 1,040 | |
| Shale, white, soft | 40 | 1,080 | |
| Lime, gray, hard | 30 | 1,110 | |
| Shale, dark, soft | 10 | 1,120 | |
| Shale, white, soft | 10 | 1,130 | |
| Lime, gray, hard | 15 | 1,145 | |
| Shale, dark, soft | 5 | 1,150 | |
| Lime, white, firm; 500,000 cu. ft. of gas | 55 | 1,205 | |
| Shale, dark, soft | 10 | 1,215 | |
| Lime, gray, hard | 25 | 1,240 | |
| Shale, dark, soft | 10 | 1,250 | |
| Lime, gray, firm | 73 | 1,323 | |
| Lime, white, soft | 7 | 1,330 | |
| Shale, dark, soft | 45 | 1,375 | |
| Lime, gray, hard | 20 | 1,395 | |
| Shale, white, soft; 200,000 cu. ft. of gas | 25 | 1,420 | |
| Shale, dark, soft | 15 | 1,435 | |
| Lime, sandy, gray, soft | 10 | 1,445 | |
| Sand, gray, firm | 60 | 1,505 | |
| Lime, sandy, gray, firm | 40 | 1,545 | |
| Shale, dark, soft | 40 | 1,585 | |
| Lime, gray, hard | 35 | 1,620 | |
| Shale, dark, soft | 24 | 1,644 | |
| Lime, gray, hard | 2 | 1,646 | |
| Lime, sandy, gray, firm | 3 | 1,649 | |
| Oil sand, gray, firm | 28 | 1,677 | Boyer "sand." |
Stokes "Sand"
The Stokes "sand," which lies about 2,000 feet below the top of the Fort Riley limestone, was discovered on the Stokes lease near the east quarter corner of sec. 33, T. 25 S., R. 5 E., from which it obtains its name. From the discovery of commercial production in this "sand," during March, 1917, and up until the end of that year, but two additional wells located in the immediate vicinity of the discovery well were completed to this pay in the entire field. It would appear also from the information given in press reports for 1918 that no additional Stokes "sand" wells were completed during this year. The initial daily capacities of these three wells were reported as ranging from 100 to 300 barrels. As pointed out in the discussion on stratigraphy, the Stokes "sand" belongs to the Kansas City formation, as differentiated in plate VI, which is there indicated as consisting principally of limestone. The mineralogical composition of the Stokes "sand," as recorded in the logs of the wells which obtain their oil from it, is reported as "broken sandy lime" in one, and "sand" in the other two. In the logs of other wells scattered rather widely in the field, and which also record this "sand," it is generally referred to as "sand," but a few specifically record it as "lime." Since most drillers call any oil-bearing rock a "sand," without reference to its mineralogical composition, it may be that the few who specify this oil-bearing rock as "lime" more truthfully indicate its mineralogical character.
The Stokes "sand" is slightly oil-bearing over a larger area than the Boyer "sand," but the extent of the area in which its content of oil is present in commercial quantities, as indicated by the two wells producing from it, is much more limited. Its presence, according to logs of oil wells, is recognized on the Robinson, Wilson, Chesney, Oil Hill and Shumway domes and at the north extremity of the Boyer dome. Following is a log of a Stokes "sand" well:
| Log of Union Oil Company of Wichita's Hill Farm Deep Well No. 2 | |||
|---|---|---|---|
| Location, center of west line, NW SW, sec. 34, T. 25 S., R. 5 E. Drilled April 3 to (?), 1917. Elevation of well mouth, 1,368 feet, which is about 50 feet below top of Fort Riley limestone. Initial production, 300 barrels. Log furnished by the Union Oil Company of Wichita. | |||
| Drillers' record | Thickness in feet |
Depth in feet |
Geological correlations by the writer |
| Lime, white, hard | 50 | 50 | Florence flint |
| Slate, black, soft | 10 | 60 | Matfield shale |
| Slate, white, soft | 20 | 80 | |
| Lime, white, hard | 10 | 90 | |
| Slate, white, soft | 30 | 120 | |
| Red rock, red, soft | 5 | 125 | |
| Lime, white, hard | 15 | 140 | Wreford limestone. |
| Sand, white, soft | 20 | 160 | |
| Slate, black, soft | 60 | 220 | |
| Lime, white, hard | 15 | 235 | |
| Shale, white, soft | 30 | 265 | |
| Lime, white, hard | 10 | 275 | |
| Slate, white, soft | 20 | 295 | |
| Lime, white, hard | 15 | 310 | |
| Slate, black, soft | 5 | 315 | |
| Lime, white, hard | 5 | 320 | |
| Slate, black, soft | 5 | 325 | |
| Shale, white, soft | 15 | 340 | |
| Slate, black, soft | 10 | 350 | |
| Lime, white, hard | 5 | 355 | |
| Slate, black, soft | 20 | 375 | |
| Slate, white, soft | 40 | 415 | |
| Slate, black, soft | 5 | 420 | |
| Slate, white, soft | 10 | 430 | |
| Slate, black, soft | 10 | 440 | |
| Lime, white, hard | 5 | 445 | |
| Slate, black, soft | 5 | 450 | |
| Lime, white, hard | 10 | 460 | |
| Slate, white, soft | 10 | 470 | |
| Slate, black, soft | 5 | 475 | |
| Slate, white, soft | 10 | 485 | |
| Lime, gray, hard | 5 | 490 | |
| Slate, black, soft | 30 | 520 | |
| Slate, white, soft | 10 | 530 | |
| Slate, black, soft | 5 | 535 | |
| Lime, gray, hard; 3 bailers water per hour | 5 | 540 | |
| Slate, black, soft | 5 | 545 | |
| Slate, white, soft | 10 | 555 | |
| Shale, white, soft | 15 | 570 | |
| Slate, black soft | 15 | 585 | |
| Slate, white, soft | 10 | 595 | |
| Sand, white, soft; oil | 15 | 610 | 660-foot oil sand. |
| Slate, black, soft | 20 | 630 | |
| Slate, white, soft | 20 | 650 | |
| Slate, black, soft | 55 | 705 | |
| Slate, white, soft | 20 | 725 | |
| Lime, white, hard | 25 | 750 | |
| Slate, white, soft | 15 | 765 | |
| Lime, white, hard; 2 bailers of water per hour | 40 | 805 | |
| Slate, black, soft | 57 | 862 | |
| Sand, white, soft; gas | 2 | 864 | |
| Slate, black, soft | 6 | 870 | |
| Sand, white, soft; hole full of water | 25 | 895 | |
| Slate, black, soft | 65 | 960 | |
| Lime, white, hard | 10 | 970 | |
| Slate, black, soft | 70 | 1,040 | |
| Lime, white, hard | 20 | 1,060 | |
| Slate, black, soft | 15 | 1,075 | |
| Lime, white, hard | 25 | 1,100 | |
| Slate, black, soft | 25 | 1,125 | |
| Sand, white, hard; gas at 1,140 | 18 | 1,143 | |
| Slate, white, soft | 10 | 1,153 | |
| Lime, white, hard; water at 1,160 | 30 | 1,183 | |
| Slate, black, soft | 10 | 1,193 | |
| Lime, brown, hard | 42 | 1,235 | |
| Sand, white, hard; 3,000,000 cu. ft. of gas at 1,240 | 30 | 1,265 | |
| Lime, white, hard | 20 | 1,285 | |
| Slate, black, soft | 15 | 1,300 | |
| Lime, gray, hard | 20 | 1,320 | |
| Slate, black, soft | 10 | 1,330 | |
| Lime, white, hard | 25 | 11355 | |
| Slate, black, soft | 10 | 1,365 | |
| Lime, gray, hard | 10 | 11375 | |
| Slate, black, soft | 10 | 1,385 | |
| Lime, white, soft | 15 | 1,400 | |
| Slate, black, soft | 150 | 1,550 | |
| Lime, gray, hard; 2 bailers of water per hour | 20 | 1,570 | |
| Slate, black, soft | 30 | 1,600 | |
| Lime, white, hard | 40 | 1,640 | |
| Sand, white, hard; oil showing at 1,650 | 30 | 1,670 | |
| Slate, dark, soft | 35 | 1,705 | |
| Lime, white, hard | 105 | 1,810 | Lansing formation |
| Slate, white, soft | 140 | 1,950 | |
| Sand, white, hard; first oil at 1,985 and second oil at 2,015 | 132 | 2,082 | Kansas City formation containing Stokes "sand." |
Stapleton Oil Zone
Resume of Stratigraphic Relations
In a preceding chapter the Stapleton oil zone is described as lying below the pre-Cherokee peneplained erosion surface. This erosion surface, as discussed there, bevels the Boone ( ?) limestone and in places completely eliminates it, bringing the underlying sandstone in unconformable contact with the superposed Pennsylvanian rocks. The erosion surface, so far as can be ascertained, possessed a very low and gentle relief. It is the writer's opinion, which is amplified on a later page, that diastrophic forces gently bowed up this surface in early Pennsylvanian time, prior to the deposition of the Cherokee shale and the Marmaton formation. It is the upper portion of this eroded terrain which now contains the deep-lying oil of the Eldorado district, and is called the Stapleton oil zone. The present attitude of the surface of this unconformity, as modified by additional folding during Pennsylvanian, Permian, and even later time, has been determined from well-record data, and is shown by contours on plate XIV.
The agreement of the general features of folding in the Stapleton oil zone with those of the surface rocks and the 660foot oil sand is quite striking. It is more intricately folded and differs from them principally in the intensity of the folding, the deep-lying Stapleton being more strongly flexed. This greater intensity of folding, as discussed on pages 155-164, the author believes is due largely to the fact that the older rocks were subjected to flexing prior to the deposition of the later rocks. Therefore, the contours drawn on top of the Stapleton oil zone show several local details of flexing not present in the surface rocks and the 660-foot oil sand, because the movement which caused them was not repeated after the later beds were deposited, and the inequalities of the Stapleton surface were filled by later sediments.
Structure
Shumway Dome. The dome in the Stapleton zone covers essentially the identical area as in the outcropping Fort Riley limestone, extending from sec. 14, T. 26 S., R. 4 E., to sec. 36, T. 25 S., R. 4 E. Its crest line follows in general the elongated crest in the Fort Riley but its crest area is not as regular in the Stapleton as in the Fort Riley, being slightly wrinkled with several low upfolds and a few shallow depressions.
The Shumway dome in the Stapelton zone is limited on the east by the same features as the dome in the surface rocks, the Bishop and Fowler synclines. The Bishop syncline, however, is so sharply developed that it appears to approach a fault and may in reality be one, which for lack of sufficient drilling information cannot be indicated as such on plate XIV. The Fowler syncline, too, is strongly developed, so much so that it might be termed a pit. In addition to these features there is another in sec. 31, T. 25 S., R. 5 E., not represented in the surface rocks, which starts in the southwest corner of sec. 31, T. 25 S., R. 5 E., and runs northeasterly until it joins the northwest extension of the Bancroft syncline near the northeast corner of the section.
So far as the information at hand indicates, production in the Stapleton zone is continuous across this depression and also the Fowler syncline. A few dry holes, including the original well drilled by the city of Eldorado, are present here on the east flank between the center and east quarter corner of sec. 1, T. 26 S., R. 4 E. This series of dry holes is noteworthy. They all lie above the 1,030-foot contour on plate XIV, whereas a short distance to the south production has been developed as far down as the -1,100-foot contour. The writer has no information from which he can obtain a specific explanation for this local barrenness of the Stapleton. The lower limit of production varies considerably. To the southeast, in section 13, it appears to be limited at about the -1,030-foot elevation, but farther west, near the center of section 14, it extends below the -1,050-foot contour. Northwest of this point the production limit rises somewhat, but drops again at the north side of section 10 and in section 3 to below the -1,075-foot contour. In sec. 35, T. 25 S., R. 4 E., good wells have been obtained as low as the -1,060-foot contour and in section 25 of the same township almost down to the -1,090-foot contour. A range of about 60 feet in elevation is thus indicated in the margin of the oil limits in the Stapleton oil zone on the Shumway dome.
The Shumway dome is the most productive portion of the Eldorado field, the largest wells ever drilled in the Midcontinent field, several of which initially produced more than 15,000 barrels per day, being located on this structure. During the early development of the Shumway dome, wells with initial daily capacities of more than 1,000 barrels were common, and from this figure they ranged up to 15,000 barrels, and even better. These wells of high yield follow rather closely the crest of the structure, with their greatest concentration in sec. 11, T. 26, R. 4. A few wells with initial productions of 500 to 3,000 barrels are located east of the crest, but instead of being in the deep Fowler or Bishop synclines they are located, on the ridgelike fold between these depressions, which extends eastward across the SE, sec. 12, T. 26 S., R. 5 E., and into sec. 7, T. 26 S., R. 5 E. The distribution of these prolific wells, graded according to size, is shown on plate XVII. The logs of the original gusher well and of the Shumway well No. 5 follow:
| Log of Eureka Oil Company's Williams & Walker Farm Well No. 3 (Trapshooters Oil Company's Well No. 2). |
|||
|---|---|---|---|
| Location, southeast corner, W2 NW, sec. 11, T. 26 S., R. 4 E. Drilled April 19 to June 2, 1917. Elevation of well mouth, 1,369 feet, which is about 10 feet below top of Fort Riley limestone. Initial production estimated to have been between 6,000 and 24,000 barrels. Log furnished by Eureka Oil Company. | |||
| Drillers' record | Thickness in feet |
Depth in feet |
Geological correlations by the writer |
| Lime | 65 | 65 | Fort Riley limestone and Florence flint. |
| Slate | 15 | 80 | Matfield shale. |
| Sand | 20 | 100 | |
| Slate | 25 | 125 | |
| Lime | 10 | 135 | Wreford limestone. |
| Slate | 15 | 150 | |
| Sand | 10 | 160 | |
| Slate | 10 | 170 | |
| Lime | 20 | 190 | |
| Slate | 10 | 200 | |
| Lime | 50 | 250 | |
| Slate | 15 | 265 | |
| Lime | 58 | 323 | |
| Slate | 22 | 345 | |
| Slate and shell | 305 | 650 | |
| Lime | 5 | 655 | |
| Red rock | 8 | 663 | |
| Lime | 12 | 675 | |
| Slate and shell | 25 | 700 | |
| Red rock | 5 | 705 | |
| Lime | 15 | 720 | |
| Slate and shell | 45 | 765 | |
| Lime | 15 | 780 | |
| Slate and shell | 32 | 812 | |
| Lime | 20 | 832 | |
| Slate and shell | 118 | 950 | |
| Lime | 15 | 965 | |
| Slate | 38 | 1,008 | |
| Sand | 12 | 1,020 | |
| Slate | 30 | 1,050 | |
| Lime | 40 | 1,090 | |
| Slate | 20 | 1,110 | |
| Lime | 10 | 1,120 | |
| Slate; gas | 20 | 1,140 | |
| Lime | 85 | 1,225 | |
| Slate | 10 | 1,235 | |
| Lime | 25 | 1,260 | |
| Slate | 7 | 1,267 | |
| Lime | 53 | 1,320 | |
| Slate | 30 | 1,350 | |
| Lime; gas | 40 | 1,390 | |
| Slate | 10 | 1,400 | |
| Lime | 15 | 1,415 | |
| Slate | 35 | 1,450 | |
| Lime | 25 | 1,475 | |
| Slate | 5 | 1,480 | |
| Lime | 38 | 1,518 | |
| Slate | 17 | 1,535 | |
| Lime | 5 | 1,540 | |
| Slate | 40 | 1,580 | |
| Lime | 10 | 1,590 | |
| Slate | 35 | 1,625 | |
| Lime | 13 | 1,638 | |
| Slate | 22 | 1,660 | |
| Lime | 170 | 1,830 | Lansing formation. |
| Slate | 106 | 1,945 | |
| Lime; oil at 1,955 | 145 | 2,090 | Kansas City formation. |
| Slate | 5 | 2095 | |
| Lime | 10 | 2:105 | |
| Black slate | 51 | 2,156 | Marmaton formation, with possibly some Cherokee shale at bottom. |
| Lime | 4 | 2,160 | |
| Black slate | 30 | 2,190 | |
| White slate | 85 | 2,275 | |
| Lime | 25 | 2,300 | |
| Black slate | 46 | 2,346 | |
| Sand; oil at 2,360 | Stapleton oil zone. | ||
| Log of Gypsy Oil Company's Shumway Farm Well No. 5. | |||
|---|---|---|---|
| Location, center of west line, SW NE, sec. 11, T. 26 S., R. 4 E. Drilled July 25 to September 7, 1917. Elevation of well mouth, 1,372 feet, which is about 25 feet below top of Fort Riley limestone. With tools in the hole the production for one hour on September 10 gauged 800 barrels per hour. Casing record: 12 1/2-inch, 1,053 feet; 10-inch, 1,519 feet; 8 1/4-inch, 1,803 feet; 6 5/8-inch, 2,278 feet. Log furnished by Gypsy Oil Company. | |||
| Drillers' record | Thickness in feet |
Depth in feet |
Geological correlations by the writer |
| Soil, black, soft | 5 | 5 | |
| Red rock, soft | 10 | 15 | |
| Lime, white, hard | 20 | 35 | |
| Shale, black, soft | 45 | 80 | |
| Lime, white, hard | 55 | 135 | |
| Lime, white, hard | 10 | 145 | |
| Shale, white, soft | 55 | 200 | |
| Shale, white, soft | 40 | 240 | |
| Lime, white, soft | 10 | 250 | |
| Shale, white, soft | 20 | 270 | |
| Lime, white, hard | 10 | 280 | |
| Shale, white, soft | 70 | 350 | |
| Lime, white, hard | 10 | 360 | |
| Shale, dark, soft | 40 | 400 | |
| Lime, white, hard | 10 | 410 | |
| Shale, black, soft | 40 | 450 | |
| Lime, white, hard | 15 | 465 | |
| Shale, black, soft | 35 | 500 | |
| Red rock, soft | 10 | 510 | |
| Shale, black, soft | 90 | 600 | |
| Water sand, white, soft | 10 | 610 | |
| Shale, brown, soft | 70 | 680 | |
| Shale, white | 35 | 715 | |
| Lime, white, hard | 15 | 730 | |
| Shale, brown, soft | 20 | 750 | |
| Lime, white, hard | 30 | 780 | |
| Sandy lime, white, soft | 30 | 810 | |
| Shale, brown, soft | 30 | 840 | |
| Shale, brown, soft | 60 | 900 | |
| Lime, white, hard | 20 | 920 | |
| Shale, brown | 40 | 960 | |
| Sand, white, soft | 20 | 980 | |
| Shale, soft | 40 | 1,020 | |
| Lime, soft | 10 | 1,030 | |
| Lime, hard | 25 | 1,055 | |
| Lime, hard | 25 | 1,080 | |
| Shale, white, hard | 10 | 1,090 | |
| Lime, white, hard | 80 | 1,170 | |
| Shale, brown, soft | 20 | 1,190 | |
| Lime, white | 70 | 1,260 | |
| Shale, white, soft | 10 | 1,270 | |
| Shale, white, soft | 15 | 1,285 | |
| Lime, white, soft | 85 | 1,370 | |
| Lime, white, hard | 70 | 1,440 | |
| Gas sand, white, soft | 30 | 1,470 | |
| Water sand, white | 50 | 1,520 | |
| Shale, brown, soft | 55 | 1,575 | |
| Broken lime, white, soft | 25 | 1,600 | |
| Lime, white | 80 | 1,680 | |
| Lime, white | 30 | 1,710 | |
| Water sand, white | 20 | 1,730 | Lansing formation. |
| Lime, white, hard | 70 | 1,800 | |
| Shale, brown, soft | 100 | 1,900 | |
| Lime, white | 50 | 1,950 | Kansas City formation, containing Stokes "sand." |
| Oil sand | 20 | 1,970 | |
| Lime, white, hard | 80 | 2,050 | |
| Sand, white | 20 | 2,070 | |
| Lime | 10 | 2,080 | |
| Shale, black, soft | 120 | 2,200 | Marmaton formation, and possibly some Cherokee shale at bottom. |
| Shale, black, soft | 77 | 2,277 | |
| Lime, white | 13 | 2,290 | |
| Broken lime | 80 | 2,320 | |
| Unrecorded | 10 | 2,330 | |
| Top of first pay | 2,330 | Stapleton oil zone. | |
| Thickness, one screw | 2,335 | ||
| Limestone break, few feet | |||
| Second pay | |||
| Total depth | 2,340 | ||
While the wells of highest yield are in general located on the highest portion of the structure, in accordance with the generally accepted interpretation of the influence of anticlinal structure, there is no apparent structural reason why the Shumway dome, rather than the other domes of the field, should have in such a large measure the preponderance of high-yield wells. This coincidence must be explained by a local condition in the pay rock.
The pay rock, as described on pages 30-37, is not uniform in character, but varies from good quartz sand to cherty, dolomitic limestone. The fact that on the Shumway dome it is principally cherty, dolomitic limestone makes an explanation easier. Limestone is naturally not a porous rock, and hence when it contains oil it cannot generally be considered that the oil is contained in natural pore spaces such as prevail in sandstones. Secondary features must, instead, be brought under consideration. Of such secondary features for cherty limestone the following are the most common:
- Joint cracks;
- Solution cavities and channels;
- Fault fissures and brecciation;
- Minute and small crevices due to—
- crystalline growth of minerals,
- chemical changes in mineral composition,
- dolomitization,
- different brittleness and strength of chert and limestone subjected to deformational forces; and
- possible other causes.
Where the production is more normal it would seem that joint cracks and the small and variously formed crevices could account for much of the pore space, but it is difficult to conceive how these alone could account for the exceptional and prolific yield of wells concentrated principally on the Shumway dome. To the writer it seems necessary that large and open spaces be present, and especially must this be true in this field, where there is no apparent great gas pressure behind the oil. So small is this pressure that when the Gypsy Oil Company's Shumway well No. 5 (center location in west line of SW NE, sec. 11, T. 26 S., R. 4 E.) came in at better than 15,000 barrels, the column of oil rose but about 6 feet above the 6-inch casing before breaking and falling back to the derrick floor.
The behavior of some wells has demonstrated flow channels between them, as when the Shumway No. 5 ceased flowing soon after well No. 13 (the adjacent well to the northeast) was drilled in with a flush production of 17,000 barrels. Solution channels or open fissures can probably best account for such a condition. Additional evidence of such open spaces is found in the drilling in of the Denny well No. 18 (southwest corner location in SEI/t, sec. 12, T. 26 S., R. 4 E., belonging to the Union Oil Company of Wichita), in which it was reported that an open space was found, the top of which was at 2,450 feet and the bottom 39 feet deeper, at 2,489.
Less direct evidence of open channels in the pay rock is to be found in the disparity in size of adjacent wells; e. g., the Gypsy Oil Company's well No. 5 (center location along west side, SW NE, sec. 11, T. 26 S., R. 4 E.), with an initial production of 15,000 plus barrels, which is offset to the north by an 800-barrel well, Shumway No. 7. The Empire Gas and Fuel Company's Cardey well No. 6 (southwest corner location in NW SE, sec. 11, T. 26 S., R. 4 E.), with a production reported by the company to have been 20,000 barrels, is offset to the south by the 100-barrel Cardey well No. 9. On the same lease, Cardey well No. 17 (center location along south side, NE SE, sec. 11, T. 26 S., R. 4 E.), with a reported initial production of 12,000 barrels, is offset to the north by a 300-barrel well, Cardey No. 21. In section 12, T. 26 S., R. 4 E., the Empire Gas and Fuel Company's Enyart well No. 22 (northwest corner location in NE NW) was drilled in with a 10,800-barrel production, and this is offset to the north by a previously completed 320-barrel well, Abraham well No. 4. In sec. 2, T. 26 S., R. 4 E., the Carter Oil Company's Porter well No. 35, an 8,000-barrel starter, was drilled in after the completion of its offsetting wells to the east, south and west, which had flush productions of 200, 600 and 450 barrels, respectively.
If the interpretation that the top of the Stapleton zone represents the dissected upper surface of the Mississippian rock series is correct, then the possible porous and cavernous nature of this pay rock and its absence locally can be readily understood as being largely due to the effects of erosion and solution by surface waters during the time it was subjected to subaerial agencies.
Bishop Syncline. The Bishop syncline in the outcropping rocks is comparatively a shallow structure, being more of a synclinal reentrant in line with the still smaller Fowler syncline, and, with it, separating the Shumway and Boyer domes. Sufficient drilling information is not at hand to show the details of the structure, but a strongly developed syncline is indicated in the Stapleton zone. So strongly is it developed that a fault is suggested, and because of the possibility that a fault may be present, the doubtful area was left blank on plate XIV.
The influence of the Bishop syncline on production is quite marked. It apparently is the controlling feature in cutting off production on the west side of the Koogler nose, which here follows a line almost parallel with the dip rather than the strike. This abrupt termination of production is evidence supporting the previously stated inference that the flexing here may have been so intense that fracturing and faulting have taken place.
Fowler Syncline. This structure in the Fort Riley limestone is but a shallow trough about 40 feet in depth separating the Shumway and Boyer domes. In the deep-lying Stapleton it is represented by a downfold which suggests a pit, the base of which lies near the southeast corner of sec. 1, T. 26, R. 4. The bottom of this depression is about 190 feet below the apex of the Shumway dome, which is quite in contrast to the 40-foot trough in the Fort Riley limestone at the surface.
Production has been found on the southwest slope of this downfold, but whether it continues uninterruptedly across it had not been demonstrated prior to 1919.
Boyer Dome. This structure, which is well developed in the surface rocks, cannot be identified as such in the Stapleton zone, and represents the greatest lack of conformity between underground and surface structure in the Eldorado field. There is no Boyer dome, as such—that is, a minor bulge on top of the major Eldorado anticline—but simply a comparatively large area of low relief, more or less isolated by the deep Fowler pit, and occupying much of sections 7, 8, and a part of 17, T. 26 S., R. 5 E. A lack of drilling on the east and south flanks, in sections 9, 16 and 17, leaves unknown the configuration of the Stapleton surface in these sections. It is believed, however, that the east flank of the Boyer dome, or rather the east flank of the Eldorado anticline, is strongly developed. This probability should largely compensate for the minor development of the Boyer dome as a feature distinct from the Shumway dome. The minor development of the crest of the Boyer dome may in part be explained by considering the Stapleton surface in this locality to have been a topographic depression in pre-Cherokee times, and that the later folding was not sufficient to reverse the attitude of this surface. The wells located on the Boyer dome are quite ordinary in size, 100 to 300 barrels initial daily production being the average. But one well, Opperman No. 2, in the northeast corner, SE NE, sec. 7, T. 26 S., R. 5 E., had a reported initial daily production as high as 500 barrels. This generally low yield may in part be explained by the absence of strong folding in the Stapleton pay.
Following is a log of a Stapleton zone well located on the Boyer dome:
| Log of Empire Gas & Fuel Company's Gussman Farm Well No. 3. | |||
|---|---|---|---|
| Location, northeast corner, NW NW, sec. 17, T. 26 S., R. 5 E. Drilled March 10 to May 22, 1917. Elevation of well mouth, 1,376 feet, which is 55 or more feet below top of Fort Riley limestone. Initial production, 125 barrels. Log furnished by Empire Gas and Fuel Company. | |||
| Drillers' record | Thickness in feet |
Depth in feet |
Geological correlations by the writer |
| Mud, soft | 8 | 8 | |
| Lime, white, hard | 20 | 28 | Florence flint. |
| Slate, blue, soft | 10 | 38 | |
| Lime, gray, hard | 20 | 58 | |
| Slate, blue, soft | 30 | 88 | |
| Lime, gray, hard | 12 | 100 | |
| Lime, gray, hard | 30 | 130 | |
| Shale, blue, soft | 10 | 140 | |
| Red bed, red, soft | 7 | 147 | |
| Lime, gray, hard | 3 | 150 | |
| Shale, blue, soft | 10 | 160 | |
| Lime, white, hard | 65 | 225 | |
| Shale, blue, soft | 20 | 245 | |
| Lime, gray, hard | 20 | 265 | |
| Shale, blue, soft | 8 | 273 | |
| Red bed, red, soft | 7 | 280 | |
| Lime, white, hard | 30 | 310 | |
| Shale, blue, soft | 15 | 325 | |
| Lime, white, hard | 15 | 340 | |
| Shale, dark, soft | 20 | 360 | |
| Lime, white, hard | 70 | 430 | |
| Shale, blue, soft | 60 | 490 | |
| Sand, light, soft; water | 10 | 500 | |
| Shale, light, soft | 15 | 515 | |
| Lime, white, hard | 5 | 520 | |
| Shale, blue, soft | 5 | 525 | |
| Lime, white, hard | 35 | 560 | |
| Shale, blue, soft | 17 | 577 | |
| Slate, dark, soft | 20 | 597 | |
| Sand, white, soft; water | 33 | 630 | |
| Shale, dark, soft | 12 | 642 | |
| Shale, light, soft | 60 | 702 | |
| Lime, white, hard | 40 | 742 | |
| Shale, dark, soft | 10 | 752 | |
| Lime, white, hard | 50 | 802 | |
| Shale, blue, soft | 94 | 896 | |
| Sand, gray, soft; gas | 10 | 906 | |
| Lime, gray, hard | 64 | 970 | |
| Shale, blue, soft | 50 | 1,020 | |
| Lime, white, hard | 70 | 1,090 | |
| Shale, blue, soft | 10 | 1,100 | |
| Lime, gray, hard | 125 | 1,225 | |
| Blue mud, blue, soft | 100 | 1,325 | |
| Lime, gray, hard | 75 | 1,400 | |
| Shale, blue, soft | 70 | 1,470 | |
| Sand, gray, soft; water | 20 | 1,490 | |
| Lime, gray, hard | 10 | 1,500 | |
| Shale, blue, soft | 60 | 1,560 | |
| Lime, white, hard | 40 | 1,600 | |
| Shale, blue, soft | 60 | 1,660 | |
| Sand, dark, soft; oil | 10 | 1,670 | Boyer "sand." |
| Lime, gray, hard | 10 | 1,680 | |
| Sand, white, soft; water | 30 | 1,710 | |
| Lime, white hard | 40 | 1,750 | Lansing formation. |
| Lime, gray, hard | 75 | 1,825 | |
| Shale, blue, soft | 125 | 1,950 | |
| Shale, blue, soft; oil | 20 | 1,970 | |
| Lime, gray, hard; water | 70 | 2,040 | Kansas City formation. |
| Lime, white, hard | 85 | 2,125 | |
| Lime, gray, hard | 20 | 2,145 | |
| Shale, blue, soft | 70 | 2,215 | Marmaton formation, with possibly some Cherokee shale at bottom. |
| Shale, blue, soft | 25 | 2,240 | |
| Shale, blue, soft | 20 | 2,260 | |
| Lime, white, hard | 10 | 2,270 | |
| Brake, black, soft | 6 | 2,276 | |
| Shale, blue, soft | 15 | 2,291 | |
| Lime, white, hard | 11 | 2,302 | |
| Shale, black, soft | 78 | 2,380 | |
| Shale, blue, soft | 5 | 2,385 | |
| Lime shell, black, hard | 10 | 2,395 | |
| Shale, blue, soft | 10 | 2,405 | |
| Sand, white, hard | 4 | 2,409 | Stapleton oil zone. |
| Sand, white, hard | 4 | 2,413 | |
| Sand, white, hard | 37 | 2,350 | |
| Sand, brown, soft; oil | 12 | 2,462 | |
| Sand, light, hard | 3 | 2,465 | |
Koogler Nose. The Koogler nose in the Stapleton zone, so far as information at hand indicates, conforms very closely to the area occupied by and to the configuration of the structure as developed in the surface formations. Its southwesterly slope is greater than that of the Fort Riley limestone in having a difference of elevation of 140 feet between the northeast corner of section 19 and the west quarter corner of sec. 30, T. 26, R. 5, whereas the Fort Riley difference is but 40 feet.
The east flank was not sufficiently drilled to supply much information concerning it. At only one place was any information available, and that in the vicinity of the south quarter corner of section 29. To the south of this corner the dip becomes very steep to the southeast, while to the north offsetting wells found their respective pays at depths which varied as much as 100 feet in elevation—a situation which may suggest the presence of a possible fault. The information, however, is too meager to permit definite statements. The presence of three dry holes in this same vicinity is perplexing. This situation adds weight to the possibility of faulting.
Production on the Koogler nose is irregularly distributed. To the west in the vicinity of the Bishop syncline—or possibly it is a fault—production is cut off without respect to height on the dip. It is possible that the Bishop syncline is replaced by a fault in the Stapleton. On the southwest flank of the nose, in the vicinity of the Bishop syncline, producing wells seem to be limited to about the -1,300-foot contour. To the southeast, where the Stapleton begins to dip southeasterly at a rapid rate, wells have been brought in as low as the -1,520-foot contour.
The wells when brought in have in general been rather uniform in size, ranging from 100 to 400 barrels, and in but two cases has an 800-barrel initial daily production been obtained. The first wells drilled in any one place on this structure had larger initial daily productions than the later wells, but in no case was the production of the first wells excessively large. The initial well on this structure, the Page-Lewis Oil Company's Koogler No. 1, in the northwest corner, NE, sec. 30, was a 500-barrel well, and No. 2, immediately adjacent to the east, was an 800-barrel well. The offsetting well to the northwest, the Empire Gas and Fuel Company's Huston No. 1, in the southeast corner, SW, sec. 19, was good for 550 barrels. Harmon well No. 7, in the southeast corner of section 24, owned by the Ramsey Petroleum Company, was reported to yield 700 barrels. The McK Oil Company's Nuttle well No. 1, in the northeast corner, section 31, came in at 800 barrels, and No. 2, immediately to the south, at 500 barrels. These represent the largest wells, and from these figures the later wells ranged down to 10 barrels, with a general average of about 200 barrels, prior to 1919. This greater uniformity in yield may be attributed in part to the character of the pay rock in this vicinity, which the available information indicates to be largely a quartz sand, a type of rock which generally has a more uniform porosity than limestone.
Four logs of scattered wells on the Koogler nose follow. The log of Koogler well No. 2 is representative of wells high along the crest line. The Hill farm well No. 1 is low on the south end, and the, Kinney farm well No. 1 is one of those in which production was not obtained until about 100 feet below the normal depth. The Sargent farm well No. 2 is located on the west flank near the Bishop syncline.
| Log of Page & Lewis Oil Company's Koogler Farm Well No. 2. | |||
|---|---|---|---|
| Location, near center of north line of NW NE, sec. 30, T. 26 S., R. 5 E. Drilled May 24 to October 28, 1917. Elevation of well mouth, 1,349 feet, which is a few feet above the top of the Fort Riley limestone. Initial production, 800 barrels. Casing record: 12 1/2-inch, 712 feet; 10-inch, 814 feet; 8 1/4-inch, 1,616 feet; 6 5/8-inch, 2,365 feet; 5 3/16-inch, 2,601 feet. Log furnished by Page & Lewis Oil Company. | |||
| Drillers' record | Thickness in feet |
Depth in feet |
Geological correlations |
| Lime | 95 | 95 | Fort Riley limestone and Florence flint. |
| Slate | 20 | 105 | Matfield shale. |
| Red rock | 10 | 115 | |
| Lime | 10 | 125 | |
| Slate | 20 | 145 | |
| Red rock | 10 | 155 | |
| Lime | 90 | 185 | Wreford limestone. |
| Slate | 10 | 195 | |
| Red rock | 5 | 200 | |
| Lime | 20 | 220 | |
| Slate | 15 | 235 | |
| Lime | 10 | 245 | |
| Slate | 5 | 250 | |
| Lime | 20 | 270 | |
| Slate | 20 | 290 | |
| Lime | 5 | 295 | |
| Slate | 10 | 305 | |
| Lime | 20 | 325 | |
| Slate | 5 | 330 | |
| Red rock | 5 | 335 | |
| Slate | 10 | 345 | |
| Lime | 10 | 355 | |
| Sand; water | 5 | 360 | |
| Shale | 15 | 375 | |
| Lime | 10 | 385 | |
| Slate | 25 | 410 | |
| Lime | 10 | 420 | |
| Slate | 10 | 430 | |
| Lime | 10 | 440 | |
| Slate | 5 | 445 | |
| Lime | 5 | 450 | |
| Slate | 20 | 470 | |
| Lime | 55 | 525 | |
| Slate | 15 | 540 | |
| Lime | 20 | 560 | |
| Slate | 5 | 565 | |
| Lime | 5 | 570 | |
| Slate | 60 | 630 | |
| ,Lime | 5 | 635 | |
| Slate | 10 | 645 | |
| Sand; water | 20 | 665 | |
| Lime | 10 | 675 | |
| Slate | 21 | 696 | |
| Sand | 9 | 705 | |
| Lime | 2 | 707 | |
| Slate | 3 | 710 | |
| Lime | 25 | 735 | |
| Lime | 10 | 745 | |
| Slate | 55 | 800 | |
| Lime | 30 | 830 | |
| Slate | 25 | 855 | |
| Lime | 150 | 1,005 | |
| Slate | 35 | 1,040 | |
| Shell | 10 | 1,050 | |
| Slate | 15 | 1,065 | |
| Shale | 20 | 1,085 | |
| Slate | 45 | 1,130 | |
| Lime | 5 | 1,135 | |
| Slate | 50 | 1,185 | |
| Lime | 5 | 1,190 | |
| Slate | 25 | 1,215 | |
| Lime | 10 | 1,225 | |
| Slate | 5 | 1,230 | |
| Lime | 5 | 1,235 | |
| Slate | 5 | 1,240 | |
| Lime | 10 | 1,250 | |
| Slate | 40 | 1,290 | |
| Lime | 35 | 1,325 | |
| Shell | 75 | 1,400 | |
| Lime | 5 | 1,405 | |
| Slate | 85 | 1.490 | |
| Lime | 10 | 1,500 | |
| Slate | 25 | 1,525 | |
| Shell | 5 | 1,530 | |
| Slate | 15 | 1,545 | |
| Sand; water | 25 | 1,570 | |
| Slate | 30 | 1,600 | |
| Lime | 60 | 1,660 | |
| Lime | 20 | 1,680 | |
| Slate | 5 | 1,685 | |
| Lime | 15 | 1,700 | |
| Slate | 20 | 1,720 | |
| Slate | 55 | 1,775 | |
| Lime | 165 | 1,940 | Lansing formation. |
| Slate | 135 | 2,075 | |
| Lime | 20 | 2,095 | Kansas City formation. |
| Slate | 5 | 2,100 | |
| Lime | 10 | 2,110 | |
| Slate | 15 | 2,125 | |
| Lime | 10 | 2,135 | |
| Slate | 30 | 2,165 | |
| Lime | 5 | 2,170 | |
| Slate | 30 | 2,200 | |
| Lime | 10 | 2,210 | |
| Slate | 20 | 2,230 | |
| Lime | 5 | 2,235 | Marmaton formation, with possibly some Cherokee shale at bottom. |
| White slate | 15 | 2,250 | |
| Lime | 38 | 2,288 | |
| Slate | 17 | 2,305 | |
| Lime | 25 | 2,330 | |
| Sand; water | 5 | 2,335 | |
| Slate | 5 | 2,340 | |
| Lime | 20 | 2,360 | |
| Sand | 10 | 2,370 | |
| Lime | 10 | 2,380 | |
| Slate | 5 | 2,385 | |
| Slate and lime shells | 65 | 2,450 | |
| Slate | 10 | 2,460 | |
| Lime | 10 | 2,470 | |
| Slate | 10 | 2,480 | |
| Lime | 5 | 2,485 | |
| Slate | 15 | 2,500 | |
| Lime | 10 | 2,510 | |
| Black slate | 5 | 2,515 | |
| Lime | 5 | 2,520 | |
| Red rock | 10 | 2,530 | |
| Brown slate | 40 | 2,570 | |
| Lime | 7 | 2,577 | |
| Black slate | 23 | 2,600 | |
| Cap rock | 6 | 2,606 | |
| Top of pay sand | 20 | 2,626 | Stapleton oil zone. |
| Log of Theta Oil Company's Hill Farm Well No. 1. | |||
|---|---|---|---|
| Location, northwest corner of sec. 32, T. 26 S., R. 5 E. Drilled November 17, 1917, to February 1, 1918. Elevation of well mouth, 1,323 feet, which is a few feet below top of Fort Riley limestone. Initial production, 150 barrels. Casing record: 15 1/2-inch, 23 feet; 12 1/2-inch, 710 feet; 10-inch, 1,314 feet; 8 1/4-inch, 2,077 feet; 6 5/8-inch, 2,363 feet; 5 3/16-inch, 2,619 feet. Log furnished by Theta Oil Company. | |||
| Drillers' record | Thickness in feet |
Depth in feet |
Geological correlations |
| Mud formation | 60 | 60 | |
| Lime, white | 15 | 75 | |
| Slate, blue | 30 | 105 | |
| Lime, white | 20 | 125 | |
| Rock, red | 10 | 135 | |
| Lime, white | 45 | 180 | Wreford limestone. |
| Rock, red | 10 | 190 | |
| Lime, gray | 10 | 200 | |
| Slate, gray | 50 | 250 | |
| Lime, blue | 50 | 300 | |
| Slate, blue | 50 | 350 | |
| Slate, gray | 25 | 375 | |
| Sandy lime | 10 | 385 | |
| Slate, brown | 50 | 435 | |
| Slate, white | 15 | 450 | |
| Lime, gray | 25 | 475 | |
| Slate, black | 65 | 540 | |
| Slate, white | 60 | 600 | |
| Lime, gray | 60 | 660 | |
| Sandy lime; hole full of water at 670 feet | 10 | 670 | |
| Broken lime | 30 | 700 | |
| Slate, black | 50 | 750 | |
| Hard lime | 20 | 770 | |
| Slate, blue | 30 | 800 | |
| Lime, gray | 20 | 820 | |
| Slate, blue | 70 | 890 | |
| Slate, brown | 10 | 900 | |
| Lime, white; 1 bailer of water per hour at 920 feet | 20 | 920 | |
| Lime, gray | 80 | 1,000 | |
| Sand | 25 | 1,025 | |
| Slate, gray | 25 | 1,050 | |
| Sand; 4 bailers of water per hour at 1,075 feet | 25 | 1,075 | |
| Slate, blue | 25 | 1,100 | |
| Lime, white | 25 | 1,125 | |
| Slate, black | 75 | 1,200 | |
| Slate, gray | 35 | 1,235 | |
| Lime, black | 15 | 1,250 | |
| Slate, white | 25 | 1,275 | |
| Sand; hole full of water | 35 | 1,310 | |
| Lime, broken | 30 | 1,340 | |
| Shale, black | 190 | 1,530 | |
| Lime, gray | 30 | 1,560 | |
| Slate, black | 30 | 1,590 | |
| Lime, white | 20 | 1,610 | |
| Slate, white | 40 | 1,650 | |
| Big lime | 280 | 1,930 | Lansing formation. |
| Slate, blue | 50 | 1,980 | |
| Lime, white | 30 | 2,010 | |
| Slate, white | 50 | 2,060 | |
| Slate, white | 40 | 2,100 | |
| Lime, gray | 30 | 2,130 | Kansas City formation. |
| Sandy lime; 6 bailers of water at 2,160 feet | 30 | 2,160 | |
| Slate, black | 30 | 2,190 | Marmaton formation, with possibly some Cherokee shale at bottom. |
| Slate, white | 35 | 2,225 | |
| Lime, blue | 25 | 2,250 | |
| Shale, blue | 60 | 2,310 | |
| Sand, white; hole full of water | 50 | 2,360 | |
| Lime, broken | 55 | 2,415 | |
| Slate, white | 30 | 2,445 | |
| Sandy shale | 20 | 2,465 | |
| Slate, black | 25 | 2,490 | |
| Lime, white | 35 | 2,525 | |
| Slate, blue | 25 | 2,550 | |
| Slate, white | 30 | 2,580 | |
| Slate, black | 39 | 2,619 | |
| Top of oil sand | 2,619 | Stapleton oil zone. | |
| First show of oil | 2,619 | ||
| Filled up 400 feet with oil | 2,629 | ||
| Filled up 1,500 feet with oil | 2,639 | ||
| Total depth | 2,639 | ||
| Log of Leonard Petroleum Company's Kinney Farm Well No. 1. | |||
|---|---|---|---|
| Location, center of west line of SE, sec. 29, T. 26 S., R. 5 E. Drilling completed January 2, 1918. Elevation of well mouth, 1,314 feet, which is about the same as the top of the Fort Riley limestone. Initial production, 300 barrels. Casing record: 15 1/2-inch, 20 feet; 12 1/2-inch, 750 feet; 10-inch, 1,450 feet; 8 1/4-inch, 2,152 feet; 6 5/8-inch, 2,376 feet; 5 3/16-inch, 2,585 feet. Log furnished by Leonard Petroleum Company. | |||
| Drillers' record | Thickness in feet |
Depth in feet |
Geological correlations |
| Unrecorded | 6 | 6 | |
| Lime, white | 80 | 86 | Fort Riley limestone and Florence flint. |
| Slate, black | 20 | 106 | Matfield shale. |
| Lime, white | 10 | 116 | |
| Red rock | 12 | 128 | |
| Slate, black | 20 | 148 | |
| Sand, white | 25 | 173 | Wreford limestone |
| Slate, black | 25 | 198 | |
| Lime, white | 10 | 208 | |
| Slate, black | 40 | 248 | |
| Lime, white | 12 | 260 | |
| Slate, white | 25 | 285 | |
| Lime, white; 8 bailers of water at 300 feet | 25 | 310 | |
| Slate, white | 40 | 350 | |
| Lime, white | 30 | 380 | |
| Slate, white | 45 | 425 | |
| Lime, white; 20 bailers of water at 440 feet | 25 | 450 | |
| Slate, white | 50 | 500 | |
| Lime, white | 60 | 560 | |
| Slate, black | 35 | 595 | |
| Red rock | 10 | 605 | |
| Slate, white | 10 | 615 | |
| Lime, white | 6 | 621 | |
| Slate, white | 85 | 706 | |
| Lime, white | 5 | 711 | |
| Slate, white | 65 | 776 | |
| Lime, white | 35 | 811 | |
| Slate, white | 25 | 836 | |
| Lime, white | 50 | 886 | |
| Slate, white | 5 | 891 | |
| Lime, white | 20 | 911 | |
| Shale, brown | 204 | 1,115 | |
| Lime, gray | 85 | 1,200 | |
| Shale, brown | 20 | 1,220 | |
| Lime, white | 175 | 1,395 | |
| Slate | 40 | 1,435 | |
| Lime | 5 | 1,440 | |
| Shale, brown | 10 | 1,450 | |
| Sand, gray; puff of gas and dose of water at 1,455 to 1,460 feet | 10 | 1,460 | |
| Lime | 70 | 1,530 | |
| Sand | 20 | 1,550 | |
| Slate | 10 | 1,560 | |
| Shale, brown | 40 | 1,600 | |
| —— | 15 | 1,615 | |
| Shale, brown | 35 | 1,650 | |
| Lime, white | 15 | 1,665 | |
| Shale | 10 | 1,675 | |
| Lime; 3 bailers of water at 1,850 feet | 225 | 1,900 | Lansing formation. |
| Slate | 10 | 1,910 | |
| Shell | 15 | 1,925 | |
| Slate | 140 | 2,065 | |
| Lime, white; 10 bailers of water at 2,070 feet | 140 | 2,205 | Kansas City formation |
| Shale, brown | 10 | 2,215 | |
| Lime, white | 25 | 2,240 | |
| Slate, black | 40 | 2,280 | |
| Slate, white; water at 2,310 feet | 30 | 2,310 | |
| Lime, soft | 35 | 2,345 | |
| Slate, white | 120 | 2,465 | |
| Lime | 30 | 2,495 | |
| Slate, white | 35 | 2,530 | |
| Sand | 59 | 2,589 | |
| Sand, brown | 46 | 2,635 | |
| Slate, black | 45 | 2,680 | |
| Lime | 10 | 2,690 | |
| Shale, brown | 17 | 2,707 | |
| Oil sand | 12 | 2,719 | |
| Log of Central West Petroleum Company's Sargent Farm Well No. 2. | |||
|---|---|---|---|
| Location, center of north line of SE NW, sec. 24, T. 26 S., R. 4 E. Drilled January 2 to April 12, 1918. Elevation of well mouth, 1,349 feet, which is about 65 feet above top of Fort Riley limestone. Casing record: 15 1/2-inch, 86 feet; 12 1/2-inch, 755 feet; 10-inch, 1,206 feet; 8 1/4-inch, 1,783 feet; 6-inch, 2,630 feet. Log furnished by Central West Petroleum Company. | |||
| Drillers' record | Thickness in feet |
Depth in feet |
Geological correlations |
| Surface soil | 10 | 10 | |
| Slate, soft | 25 | 35 | Doyle shale. |
| Lime, soft | 15 | 50 | |
| Lime, hard, white | 30 | 80 | Fort Riley limestone. |
| Shale, soft, gray | 15 | 95 | |
| Lime, sandy; 1 bailer of water per hour at 125 feet | 30 | 125 | Florence flint. |
| Shale, soft, gray | 63 | 188 | Matfield shale. |
| Lime, hard, white; 1 bailer of water per hour at 225 feet | 42 | 230 | Wreford limestone. |
| Shale, soft, red | 15 | 245 | |
| Lime, hard, gray | 25 | 270 | |
| Shale, soft, gray | 5 | 275 | |
| Lime, gray, hard | 65 | 340 | |
| Shale, dark | 10 | 350 | |
| Slate, soft, white | 10 | 360 | |
| Lime, hard, white | 5 | 365 | |
| Shale, soft, red | 30 | 395 | |
| Lime, hard, white | 15 | 410 | |
| Shale, soft, gray | 15 | 425 | |
| Lime, hard, gray | 25 | 450 | |
| Shale, gray | 10 | 460 | |
| Lime, hard, gray | 30 | 490 | |
| Lime shell; 7 bailers of water per hour at 545 feet | 55 | 560 | |
| Lime, hard, gray | 15 | 560 | |
| Shale, soft, gray | 30 | 590 | |
| Lime, hard, gray | 10 | 600 | |
| Slate, soft, gray | 15 | 675 | |
| Shale, gray | 15 | 690 | |
| Water sand; hole full of water | 30 | 720 | |
| Broken lime and sand | 35 | 755 | |
| Lime, hard, white | 10 | 765 | |
| Shale, soft, gray | 20 | 785 | |
| Lime, sandy | 15 | 800 | |
| Limestone, broken | 35 | 835 | |
| Lime, hard, gray | 45 | 880 | |
| Shale, soft, gray | 10 | 890 | |
| Lime, hard, gray | 35 | 925 | |
| Shale, soft, red | 5 | 930 | |
| Lime, hard, gray | 10 | 940 | |
| Slate, soft, blue | 15 | 955 | |
| Shale, soft, gray | 35 | 990 | |
| Water sand; hole full of water | 15 | 1,005 | |
| Shale, soft | 10 | 1,015 | |
| Slate, soft, gray | 45 | 1,060 | |
| Lime, hard, white | 12 | 1,072 | |
| Shale, gray; considerable water between 1,100 and 1,185 feet | 113 | 1,185 | |
| Lime, hard, gray | 40 | 1,225 | |
| Slate, soft, gray | 10 | 1,235 | |
| Lime, hard, white | 15 | 1,250 | |
| Slate, soft, gray | 20 | 1,270 | |
| Lime, hard, gray | 45 | 1,315 | |
| Shale, soft, gray | 75 | 1,390 | |
| Lime, hard, gray | 20 | 1,410 | |
| Shale, dark | 5 | 1,415 | |
| Lime, hard, gray | 60 | 1,475 | |
| Shale, soft, gray; 2 bailers of water per hour at 1,480 feet, | 20 | 1,495 | |
| Lime, hard, gray | 50 | 1,545 | |
| Shale, soft, gray | 65 | 1,610 | |
| Lime, hard, gray | 18 | 1,628 | |
| Water sand; hole full of, water, | 17 | 1,645 | |
| Slate, gray | 30 | 1,675 | |
| Shale, gray | 20 | 1,695 | |
| Lime, hard, gray | 35 | 1,730 | Lansing formation. |
| Slate, gray | 35 | 1,765 | |
| Water sand; hole full of water, | 10 | 1,775 | |
| Lime, hard, white | 25 | 1,800 | |
| Shale, gray | 30 | 1,830 | |
| Shale, dark | 75 | 1,905 | |
| Slate, gray | 20 | 1,925 | |
| Lime, hard, gray | 89 | 2,014 | Kansas City formation. |
| Shale, gray | 26 | 2,040 | Marmaton formation, with possibly some Cherokee shale at bottom. |
| Lime, hard, white | 303 | 2,343 | |
| Shale, gray | 27 | 2,370 | |
| Lime, sandy; considerable water at 2,330 feet | 20 | 2,390 | |
| Shale, gray | 25 | 2,415 | |
| Lime, hard, gray; oil showing at 2,445 feet | 55 | 2,470 | |
| Shale, brown | 25 | 2,495 | |
| Lime, sandy | 10 | 2,505 | |
| Shale, black | 20 | 2,525 | |
| Lime, sandy | 50 | 2,575 | |
| Shale, sandy | 55 | 2,630 | |
| Oil sand | 12 | 2,642 | Stapleton oil zone. |
Bancroft Syncline. The presence of this minor syncline in the Stapleton oil zone in sec. 32, T. 25 S., R. 5 E., immediately beneath its counterparts in the 660-foot sand and the outcropping rocks, follows the apparently general rule, in that it is more strongly developed. The southeastward continuation of this down-fold in very close conformity to, the configuration of the surface rocks, but more intensely developed, is quite noteworthy. The dip of the Stapleton zone relative to that of the surface strata in this locality will be touched upon in the description of the Oil Hill dome.
This minor syncline appears to have had little or no effect in the productivity of the wells drilled in its vicinity. One well with a reported production of more than 1,000 barrels is located in the center of the north line of the SW NE, sec. 4, T. 25 S., R. 4 E., and the well immediately to the northwest came in at 500 barrels. Other wells in this depression averaged about 200 barrels.
Oil Hill Dome. The similarity in structure-but not, however, the similarity in intensity of folding-between the Stapleton zone, the 660-foot sand and the surface rocks on this dome is more than usually striking. The area covered by the domes in each of these horizons is very nearly the same, and their apexes are located at points almost identical. Following the general rule, the intensity of flexing increases with depth. In the area between the apex of the structure in each horizon and the saddle on the north and the saddle to the southwest, the increase of dip on the three horizons is as follows:
| Apex to saddle in sec. 28, T. 25 S., R. 5 E. |
Apex to saddle in sec. 32, T. 25 S., R. 5 E. |
|
|---|---|---|
| Surface rocks | 30 | 50 |
| 660-foot "sand" | 40 | 50 |
| Stapleton oil zone | 50 | 80 |
This increased dip in the Stapleton zone is even more marked on the east and southeast flanks, as between the apexes and the east quarter corner of sec. 4, T. 26 S., R. 5 E., where the difference in elevation of the Stapleton zone is 500 feet and that of the surface rocks but 110 feet.
The east flank of the structure in the central part of sec. 34, T. 25 S., R. 5 E., is not sufficiently defined by drilling to indicate its general configuration. Along the north side of this section, however, and in the southeast quarter of section 27, to the north, the Stapleton dips very steeply. So steep is the dip in these two localities that in each place it appears to slope off to a fault in these deep-lying strata, forming the apparent terrace at the north side of section 34 and separating the production in the southwest quarter of section 27 from that in the east half. The dry holes in the area intervening between these last two localities and the few wells immediately south of the center of the section, which have odd depths, join in indicating the possible presence of a fault.
Production on the Oil Hill dome, as on others, is not symmetrically distributed on the structure. To the southeast producing wells are located as low as the -1,440-foot contour and in the Bancroft minor syncline as low as the -1,520-foot contour. Directly up the dip on the southeast nose of the dome are two dry holes, one located as high as the -1,180-foot contour. On the northwest flank, also, in sec. 30, T. 25 S., R. 5 E., is a dry hole as high as the -1,140-foot contour, and in sec. 29, T. 25 S., R. 5 E., is a dry hole as high as the -1,120-foot contour.
The discovery well of the field, as well as the first well to penetrate the Stapleton oil zone, is located on the northwest flank of this dome, in the center of the NE SE, sec. 29. Although the first well to tap the Stapleton zone, its initial production was comparatively small, but 175 barrels. Later wells in this vicinity ranged as high as 700 barrels daily, and but one found the Stapleton zone unproductive. The extent of the barren area discovered by this well had not been demonstrated by drilling at the time this report was written. The principal development has taken place on the east and south flanks of the structure, where medium-sized wells—100 to 200 barrels—were the general rule prior to 1919. Exception to this rule is found in a few wells; e. g., a 650-barrel well located near the center of the west line of the SW of sec. 34, T. 25 S., R. 5 E., and several 500-barrel wells, one of which is located in the northwest corner of section 3. Another is the well immediately adjacent toward the east, and a third is in the northwest corner, NE NE NW of the same section. The last three are far down on the flanks of the structure.
On the crest of the dome, where large wells might be expected, only normal-sized wells of 200 to 300 barrels daily production were obtained.
The logs of two Stapleton zone wells follow. The Stokes well is near the apex of the dome and the Kessler well is in the town-lot development and near the edge of production on the southeast side.
| Log of Empire Gas and Fuel Company's Stokes Farm Well No. 3. | |||
|---|---|---|---|
| Location, center of NW NE, sec. 33, T. 25 S., R. 5 E. Drilled May 5 to September 25, 1916. Elevation of well mouth, 1,386 feet, which is 50 or more feet below top of Fort Riley limestone. Initial production, 300 barrels. Casing record: 15 1/2-inch, 18 feet; 12 1/2-inch, 648 feet; 10-inch, 1,040 feet; 8 1/4-inch, 2,042 feet; 6 1/2-inch, 2,420 feet; 3-inch tubing, 2,425 feet. Log furnished by Empire Gas and Fuel Company. | |||
| Drillers' record | Thickness in feet |
Depth in feet |
Geological correlations |
| Clay, yellow, soft | 5 | 5 | |
| Lime, white, hard | 35 | 40 | Florence flint. |
| Shale, black, soft | 15 | 55 | |
| Lime, white, hard | 25 | 80 | |
| Shale, white, soft | 5 | 85 | |
| Lime, white, hard | 40 | 125 | |
| Shale, white, soft | 5 | 130 | |
| Shale, pink, soft | 5 | 135 | |
| Lime, white, hard | 30 | 165 | |
| Shale, white, soft | 25 | 190 | |
| Lime, white, hard | 15 | 205 | |
| Shale, black, soft | 10 | 215 | |
| Lime, white, hard | 5 | 220 | |
| Shale, white, soft | 40 | 260 | |
| Shale, black, soft | 5 | 265 | |
| Lime, white, hard | 8 | 273 | |
| Shale, pink, soft; little gas | 10 | 283 | |
| Lime, white, hard; little water at 295 feet | 27 | 310 | |
| Shale, white, so~'t | 85 | 395 | |
| Shale, black, soft | 20 | 415 | |
| Lime, white, hard | 5 | 420 | |
| Shale, black, soft | 15 | 435 | |
| Lime, white, hard | 4 | 439 | |
| Shale, white, soft; little gas at 490 feet | 106 | 545 | |
| Shale, pink, soft | 4 | 549 | |
| Shale, white, soft | 16 | 565 | |
| Lime, white, soft | 4 | 569 | |
| Shale, white, soft | 46 | 615 | |
| Oil sand, white, soft; 2 bailers oil per hour | 20 | 635 | 660 foot "sand." |
| Shale, white, soft | 13 | 648 | |
| Lime, white, hard | 5 | 653 | |
| Shale, white, soft | 25 | 678 | |
| Lime, white, hard | 5 | 683 | |
| Shale, black, soft | 37 | 720 | |
| Shale, white, soft | 5 | 725 | |
| Lime, white, hard; little water at 805 feet | 85 | 810 | |
| Shale, black, soft | 20 | 830 | |
| Shale, white, soft | 20 | 850 | |
| Lime, white, hard; 8,000,000 cu. ft. of gas | 15 | 865 | 900 foot gas "sand" |
| Sand, gray, soft | 15 | 880 | |
| Shale, white, soft; 4,000,000 cu. ft. of gas | 3 | 883 | |
| Sand, gray, soft; 5 bailers of water per hour | 17 | 900 | |
| Shale, black, soft | 21 | 921 | |
| Lime, white, hard | 4 | 925 | |
| Shale, white, soft | 5 | 930 | |
| Lime, white, hard | 15 | 945 | |
| Shale, white, soft | 10 | 955 | |
| Shale, black, soft | 85 | 1,040 | |
| Shale, black, soft | 10 | 1,050 | |
| Lime, white, hard | 10 | 1,050 | |
| Lime, white, hard | 20 | 1,080 | |
| Shale, dark, soft | 10 | 1,090 | |
| Sandy lime, dark, hard | 25 | 1,115 | |
| Sandy shale, dark, soft | 15 | 1$130 | |
| Lime, dark, hard | 5 | 1,135 | |
| Slate, white, hard | 10 | 1,145 | |
| Lime, white, soft | 35 | 1,180 | |
| Shale, dark, soft | 10 | 1,190 | |
| Lime, white, hard | 20 | 1,210 | |
| Slate, blue, hard | 15 | 1,225 | |
| Lime, white, hard | 10 | 1,235 | |
| Sandy lime, dark, soft; 1,000,000 cu. ft. of gas | 5 | 1,240 | |
| Lime, white, hard | 35 | 1,275 | |
| Lime, white, hard | 15 | 1,290 | |
| Slate, blue, hard | 10 | 1,300 | |
| Lime, dark, hard | 5 | 1,305 | |
| Shale, dark, soft | 50 | 1,355 | |
| Lime, sandy, dark, soft; 500,000 cu. ft. of gas | 10 | 1,365 | |
| Lime, white, medium | 35 | 1,400 | |
| Shale, dark, soft | 5 | 1,405 | |
| Lime, white, soft | 35 | 1,440 | |
| Sand, dark, soft | 10 | 1,450 | |
| Shale, dark, soft | 35 | 1,485 | |
| Shell, dark, hard | 3 | 1,488 | |
| Sand, white, soft | 7 | 1,495 | |
| Shale, dark, soft | 20 | 1,515 | |
| Lime, broken, dark, soft | 25 | 1,540 | |
| Lime, broken, dark, soft | 10 | 1,550 | |
| Shale, dark, soft | 15 | 1,565 | |
| Sandy lime, white, medium | 10 | 1,575 | |
| Slate, white, soft | 20 | 1,595 | |
| Sand, shale, red, soft | 5 | 1,600 | |
| Sand, white, soft; enough water for drilling | 20 | 1,620 | |
| Slate, dark, soft | 15 | 1,635 | |
| Shell, dark, hard | 3 | 1,638 | |
| Slate, white, soft | 27 | 1,665 | |
| Lime, white, hard | 22 | 1,687 | |
| Sand lime, white, hard; showing of oil | 3 | 1,690 | |
| Sandy lime, white, soft | 15 | 1,705 | |
| Lime, dark, hard | 6 | 1,711 | |
| Lime, light, soft | 4 | 1,715 | |
| Lime, white, soft | 10 | 1,725 | |
| Lime, white, soft | 15 | 1,740 | |
| Lime, white, hard | 10 | 1,750 | Lansing formation. |
| Lime, white, hard | 20 | 1,770 | |
| Lime, white, hard | 10 | 1,780 | |
| Sandy lime, white, hard | 20 | 1,800 | |
| Sandy lime, white, soft | 10 | 1,810 | |
| Broken lime, white, soft | 27 | 1,837 | |
| Slate, white, hard | 53 | 1,890 | |
| Slate, white, hard | 60 | 1,950 | |
| Slate, white, hard | 10 | 1,960 | |
| Lime, white, hard | 10 | 1,970 | Kansas City formation |
| Lime, white, soft; little gas | 5 | 1,975 | |
| Lime, white, hard | 15 | 1,990 | |
| Sandy lime, white, hard | 25 | 2,01 | |
| Lime, white, hard | 51 | 2,06 | |
| Shale, black, soft | 3 | 2,069 | Marmaton formation, possibly some Cherokee shale at bottom. |
| Sand, white, hard | 12 | 2,081 | |
| Broken lime, soft, black | 11 | 2,092 | |
| Lime, dark, hard | 15 | 2,107 | |
| Sandy lime, light, soft | 8 | 2,115 | |
| Lime, light, hard | 10 | 2,125 | |
| Slate, black, hard | 35 | 2,160 | |
| Sandy shale, blue, soft | 10 | 2,170 | |
| Slate, white, soft | 20 | 2,190 | |
| Slate, white, soft | 10 | 2,200 | |
| Lime, dark, hard | 4 | 2,204 | |
| Slate, white, soft | 36 | 2,240 | |
| Lime, white, hard | 8 | 2,248 | |
| Slate, black, hard | 7 | 2,255 | |
| Red rock, red, soft | 2 | 2,257 | |
| Lime, white, hard | 8 | 2,265 | |
| Slate, white, soft | 13 | 2,278 | |
| Lime, white, hard | 12 | 2,290 | |
| Slate, black, hard | 8 | 2,298 | |
| Lime, white, hard | 15 | 2,313 | |
| Shale, red, soft | 8 | 2,321 | |
| Slate, white, soft | 15 | 2,336 | |
| Lime, white, hard | 3 | 2,339 | |
| Sandy shale, dark, soft | 7 | 2,346 | |
| Shale, light, soft | 24 | 2,370 | |
| Lime, dark, hard | 15 | 2,385 | |
| Sandy shale, light, hard | 10 | 2,395 | |
| Sand, light, soft, carrying particles of iron | 5 | 2,400 | |
| Lime, white, hard | 19 | 2,419 | |
| Sand, white, hard | 15 | 2,434 | Stapleton oil zone. |
| Sand, brown, soft | 6 | 2,440 | |
| Sand, white, hard | 25 | 2,465 | |
| Sand, dark, hard | 3 | 2,468 | |
| Log of Hickory Oil and Gas Company's Kessler Lot Well No. 1. | |||
|---|---|---|---|
| Location, near center of SE NE NW, sec. 3, T. 26 S., R. 5 E. Elevation of well mouth, 1,328 feet, which is about the same elevation as the top of the Fort Riley limestone. Drilling record: 15 1/2-inch, 89 feet; 12 1/2-inch, 983 feet; 10-inch, 1,606 feet; 8 1/4-inch, 2,316 feet; 6 5/8-inch, 2,572 feet; 5 3/16-inch liner, 243 feet. Log furnished by Hickory Oil and Gas Company. | |||
| Drillers' record | Thickness in feet |
Depth in feet |
Geological correlations |
| Soil, soft | 4 | 4 | |
| Lime, white, hard | 56 | 60 | Fort Riley limestone and Florence flint. |
| Shale, blue, soft | 23 | 83 | |
| Lime, white, hard | 2 | 85 | |
| Shale, blue, soft | 2 | 87 | |
| Red rock, red, soft | 25 | 112 | |
| Lime, white, hard | 14 | 126 | |
| Lime, shells, white, hard | 4 | 130 | |
| Red rock, red, soft | 16 | 146 | |
| Shale, blue, soft | 90 | 236 | |
| Lime, white, hard | 4 | 240 | |
| Shale, blue, soft | 136 | 376 | |
| Lime, white, hard | 16 | 392 | |
| Red rock, red, soft | 18 | 410 | |
| Clay, blue, soft | 30 | 440 | |
| Lime, white, hard | 25 | 465 | |
| Red rock, red, soft | 8 | 473 | |
| Shale, blue, soft | 20 | 493 | |
| Red rock, red, soft | 27 | 520 | |
| Lime, white, hard | 20 | 540 | |
| Shale, gray, soft | 45 | 585 | |
| Slate, gray, hard | 25 | 610 | |
| Lime, white, hard | 20 | 640 | |
| Shale, blue, soft | 40 | 680 | |
| Lime, white, soft | 10 | 690 | |
| Sand, gray, soft | 20 | 710 | |
| Slate, gray, soft | 10 | 720 | |
| Lime, white, hard | 15 | 735 | |
| Slate, blue, soft | 10 | 745 | |
| Shale, black, soft | 25 | 770 | |
| Shale, blue, soft | 13 | 783 | |
| Shale, blue, soft | 27 | 810 | |
| Lime, white, hard | 5 | 815 | |
| Shale, black, soft | 35 | 850 | |
| Lime, white, hard | 10 | 860 | |
| Sand, gray, soft; 5 bailers of water per hour | 15 | 875 | |
| Lime, white, hard | 11 | 886 | |
| Shale, blue, soft | 4 | 890 | |
| Red rock, red, soft | 2 | 892 | |
| Shale, gray, soft | 3 | 895 | |
| Shale, black, soft | 15 | 910 | |
| Shale, gray, hard | 35 | 945 | |
| Lime, white, hard | 15 | 960 | |
| Sand, gray, soft | 19 | 979 | |
| Shale, blue, soft | 4 | 983 | |
| Lime, white, hard | 57 | 1,040 | |
| Shale, blue, soft | 20 | 1,060 | |
| Lime, white, hard | 55 | 1,115 | |
| Shale, gray, soft | 125 | 1,240 | |
| Lime, white, hard | 3 | 1,243 | |
| Sand, gray, soft; 3 1/2 bailers of water per hour | 22 | 1,265 | |
| Lime, white, hard | 5 | 1,270 | |
| Slate, gray, soft | 45 | 1,315 | |
| Lime, white, hard; 3 bailers of water per hour | 2 | 1,317 | |
| Sand, gray, soft | 20 | 1,337 | |
| Lime, white, hard | 13 | 1,350 | |
| Lime, white, soft | 10 | 1,360 | |
| Slate, blue, soft | 45 | 1,405 | |
| Lime, white, hard | 50 | 1,455 | |
| Shale, black, soft | 32 | 1,487 | |
| Slate, gray, hard | 3 | 1,490 | |
| Lime, white, hard | 20 | 1,510 | |
| Slate, blue, soft | 5 | 1,515 | |
| Lime, white, hard | 25 | 1,540 | |
| Shale, gray, soft | 30 | 1,570 | |
| Sand, gray, soft | 35 | 1,605 | |
| Lime, blue, hard | 2 | 1,607 | |
| Shale, gray, soft | 63 | 1,670 | |
| Lime, white, hard | 5 | 1,675 | |
| Slate, blue, hard | 40 | 1,715 | |
| Sand, gray, soft; showing of water | 8 | 1,723 | |
| Lime, white, hard | 97 | 1,820 | Lansing formation. |
| Lime, blue, very hard | 5 | 1,825 | |
| Sand, gray, soft; 4 bailers of water per hour | 5 | 1,830 | |
| Lime, white, hard | 105 | 1,935 | |
| Shale, blue, soft | 5 | 1,940 | |
| Lime, white, hard | 10 | 1,950 | |
| Shale, blue, soft | 125 | 2,075 | |
| Lime, white, hard | 115 | 2,190 | Kansas City formation. |
| Slate, gray, soft | 15 | 2,205 | Marmaton formation above and Cherokee shale below. |
| Lime, white, hard | 30 | 2,235 | |
| Shale, blue, soft | 8 | 2,243 | |
| Lime, white, hard | 7 | 2,250 | |
| Shale, black, soft | 65 | 2,315 | |
| Lime, white, hard | 5 | 2,320 | |
| Shale, gray, soft | 40 | 2,360 | |
| Lime, white, hard | 10 | 2,370 | |
| Shale, black, soft | 20 | 2,390 | |
| Lime, white, hard | 10 | 2,400 | |
| Shale, black, soft | 25 | 2,425 | |
| Shale, blue, soft | 5 | 2,430 | |
| Lime, white, hard | 130 | 2,560 | |
| Lime shells, white, soft | 5 | 2,565 | |
| Shale, black, soft | 5 | 2,570 | |
| Sand, gray, hard | 113 | 2,683 | |
| Shale, blue, soft | 15 | 2,698 | |
| Red rock, red, soft | 10 | 2,708 | |
| Green shale, green, soft | 11 | 2,719 | |
| Shale, black, soft | 44 | 2,763 | |
| Shale, brown, soft | 9 | 2,772 | |
| Sand, brown, hard; pay sand | 15 | 2,787 | Stapleton oil zone |
Hegberg Syncline. This low minor fold in the surface rocks has its counterpart in the Stapleton zone, and, like other features of this field, is more intensely developed in the deep-lying strata. The flexing in the 660-foot sand is stronger than in the surface rocks and is still more strongly developed in the Stapleton zone. Production apparently continues uninterruptedly across this structural feature, which forms a saddle between the Oil Hill and Chesney domes.
Chesney Dome. The drilling of Stapleton zone wells on this structure has not progressed sufficiently to indicate the general configuration of the dome in this deep-lying pay. The deep drilling is confined principally to the east side of the structure, where, as on the other domes, the production extends far down on the flank. Production is obtained to the southeast in section 27 as low as the -1,410-foot contour, whereas a well to the north in the southeast corner of section 16, situated as high as the -1,080-foot contour, failed to find oil. The dip of the Stapleton along the south line of section 22 is two and one-half times as steep as the dip of the 660-foot sand and three and one-third to four times as steep as the dip of the surface rocks, bearing out the general condition that the deeper rocks are more sharply flexed than those at the surface.
In considering the productivity of the wells on this dome, those lying northeast of the possible fault in section 27 will be considered as belonging to the Chesney dome group. The wells in this group reflect an unusual sand condition. The first well, which is located in the southeast corner, NW NE, sec. 27, was reported variously to yield from 800 to 1,500 barrels daily, and the second well in the northeast corner of this same 40-acre tract from 750 to 1,000 barrels. Other wells in this vicinity ranged from 30 to 500 barrels. The feature to be noted is that these comparatively large wells are very far down the dip, whereas those to the northwest, which are higher on the flanks of the dome and therefore theoretically more favorably located, but which were drilled considerably later, are much smaller producers, none of them being reported larger than 250 barrels. The log of one such well is given below:
| Log of Empire Gas and Fuel Company's Chesney Farm Well No. 35. | |||
|---|---|---|---|
| Location, southeast corner of sec. 21, T. 25 S., R. 5 E. Drilled April 17 to June 21, 1917. Elevation of well mouth, 1,373 feet, which is 45 or more feet below the top of the Fort Riley limestone. Initial production, 250 barrels. Log furnished by Empire Gas and Fuel Company. | |||
| Drillers' record | Thickness in feet |
Depth in feet |
Geological correlations |
| Surface, brown, soft | 3 | 3 | |
| Lime, white, hard | 15 | 18 | Fort Riley limestone and Florence flint. |
| Shale, dark, soft | 12 | 30 | |
| Lime, white, hard | 40 | 70 | |
| Red Rock, red, soft | 10 | 80 | |
| Shale, dark, soft | 20 | 100 | |
| Sand, white, soft | 20 | 120 | |
| Shale, black, soft | 60 | 180 | |
| Lime, white, hard | 5 | 185 | |
| Slate, blue, soft | 55 | 240 | |
| Sand, white, soft | 15 | 255 | |
| Shale, blue, soft | 10 | 265 | |
| Sand, white, soft; 3 bailers of water at 270 feet | 10 | 275 | |
| Lime, white, hard | 40 | 315 | |
| Red rock, red, soft | 5 | 320 | |
| Lime, white, hard | 55 | 375 | |
| Shale, gray, soft | 15 | 390 | |
| Sand, white, hard | 8 | 398 | |
| Shale, dark, soft | 50 | 448 | |
| Lime, white, hard | 40 | 488 | |
| Shale, dark, soft | 2 | 490 | |
| Sand, white, soft; oil at 498 feet | 10 | 500 | 550-foot oil sand. |
| Shale, blue, soft | 60 | 560 | |
| Lime, white, hard | 30 | 590 | |
| Slate, light, soft | 20 | 610 | |
| Sand, white, soft; oil at 630 feet | 30 | 640 | 660-foot oil sand. |
| Slate, dark, soft | 20 | 660 | |
| Lime, white, hard | 5 | 665 | |
| Shale, blue, soft | 35 | 700 | |
| Lime, white, hard | 60 | 760 | |
| Shale, dark, soft | 15 | 775 | |
| Lime, white, hard | 10 | 785 | |
| Slate, light, soft | 35 | 820 | |
| Lime, white, hard | 15 | 835 | |
| Shale, blue, soft | 10 | 845 | |
| Lime, white, hard | 45 | 890 | |
| Shale, blue, soft | 40 | 930 | |
| Sand, white, hard | 20 | 950 | |
| Lin-ic, white, hard | 40 | 990 | |
| Shale, dark, soft | 45 | 1,035 | |
| Lime, white, hard | 91 | 1,126 | |
| Slate, light, soft | 6 | 1,132 | |
| Sand, white, soft; 2,000,000 cu. ft. of gas at 1,134 feet | 13 | 1,145 | |
| Slate, dark, soft | 40 | 1,185 | |
| Lime, white, hard | 5 | 1,190 | |
| Sand, white, soft; 2,000,000 cu. ft. of gas at 1,208 feet | 60 | 1,250 | |
| Lime, white, hard | 30 | 1,280 | |
| Slate, dark, soft; 1,000,000 cu. ft. of gas at 1,325 feet | 50 | 1,330 | |
| Lime, white, hard | 40 | 1,370 | |
| Shale, black, soft | 5 | 1,375 | |
| Lime, white, hard | 25 | 1,400 | |
| Shale, blue, soft | 125 | 1,525 | |
| Lime, white, hard | 10 | 1,535 | |
| Shale, blue, soft | 95 | 1,630 | |
| Lime, white, hard; oil at 1,674 feet | 140 | 1,770 | Lansing formation. |
| Shale, dark, soft | 90 | 1,860 | |
| Lime, white, hard | 15 | 1,875 | |
| Slate and shells, light, soft | 25 | 1,900 | |
| Slate, light, soft | 10 | 1,910 | |
| Slate and shells, light, soft | 18 | 1,928 | |
| Lime, white, hard | 160 | 2,088 | Kansas City formation. |
| Slate, black, soft | 7 | 2,095 | Marmaton formation, with possibly some Cherokee shale at bottom. |
| Lime, white, hard | 5 | 2,100 | |
| Slate, dark, soft | 85 | 2,185 | |
| Slate, dark, soft | 15 | 2,206 | |
| Sand, white, soft; show of oil at 2,210 feet | 15 | 2,215 | |
| Slate, dark, soft | 45 | 2,260 | |
| Lime, white, hard, show of oil 2,270 feet | 15 | 2,275 | |
| Shale, blue, soft | 95 | 2,360 | |
| Lime, white, hard | 15 | 2,375 | |
| Shale, dark, soft | 15 | 2,390 | |
| Sand, light, hard; steel line measurement | 88 | 2,481 | Stapleton oil zone. |
Theta Syncline. This feature in the Stapleton zone has been but very slightly defined by drilling, it being indicated principally by the steep southeastward dip on the Wilson dome. From this dip it would appear that the Theta syncline is a strongly developed depression separating the Chesney and Wilson domes. Several dry holes have been drilled within it, indicating that in general no production may be obtained in its lower portions.
Sec. 15, T. 25 S., R. 5 E. Near the center of sec. 15, T. 25 S., R. 5 E., are a group of wells which, so far as available information indicates, are located on a strongly southeastward tilted portion of the Stapleton zone. It is possible that a small local dome is present immediately to the northwest and that they are situated on its southeast flanks, but this at present is merely an inference. The distribution of the three dry holes in the northeast quarter of the section is opposed to this interpretation, but instead suggests some unknown feature., not domal structure, which controls the oil in this locality.
The productivity of the wells also points to some peculiar sand condition. The initial well located in the southwest corner of the northeast quarter was reported as a 1,200-barrel producer, and this is offset to the north by a dry hole. The initial well is offset to the west by a 2,000-barrel producer. Four other wells were reported at 500 barrels or better, and the remainder below this. The log of the first well in this locality is given below:
| Log of Derby Oil Company's Nuttle Farm Well No. 1. | |||
|---|---|---|---|
| Location, southwest corner of NE, sec. 15, T. 25 S., R. 5 E. Elevation of well mouth, 1,317 feet, which is about the same elevation as the top of the Fort Riley limestone. Casing record: 10-inch, 830 feet; 8-inch, 1,462 feet; 6 5/8-inch, 2.050 feet; 5 3/16-inch, 2,532 feet. Log furnished by the Empire Gas and Fuel Company. | |||
| Drillers' record | Thickness in feet |
Depth in feet |
Geological correlations |
| Soil, dark, soft | 10 | 10 | |
| Gravel, dark, soft | 10 | 20 | |
| Lime, light, hard; 12 bailers water at 80 feet | 70 | 90 | Fort Riley limestone and Florence flint. |
| Shale, light, soft | 10 | 100 | |
| Lime, light, hard | 7 | 107 | |
| Shale, light, soft | 3 | 110 | |
| Lime, light, hard | 5 | 115 | |
| Slate, dark, soft | 10 | 125 | |
| Red rock, red, soft | 10 | 135 | |
| Lime, hard, light | 5 | 140 | |
| Slate, dark, soft | 20 | 160 | |
| Lime, light, hard | 15 | 175 | |
| Red rock, red, soft | 10 | 185 | |
| Shale, light, soft | 3 | 188 | |
| Lime, light, hard | 7 | 195 | |
| Shale, light, soft | 5 | 200 | |
| Lime, light, hard | 8 | 208 | |
| Shale, light, soft | 15 | 223 | |
| Lime, light, hard | 25 | 248 | |
| Shale, light, soft | 7 | 255 | |
| Lime, light, hard | 5 | 260 | |
| Shale, light, soft | 10 | 270 | |
| Lime, light, hard | 8 | 278 | |
| Slate, dark, soft | 10 | 288 | |
| Lime, light, hard | 8 | 296 | |
| Slate and shells, dark, hard | 24 | 320 | |
| Slate, light, soft | 10 | 330 | |
| Lime, light, hard | 7 | 337 | |
| Sand, light, soft | 18 | 355 | |
| Slate, light, soft | 5 | 360 | |
| Lime, light, hard | 10 | 370 | |
| Shale, light, soft | 8 | 378 | |
| Lime, light, hard | 12 | 390 | |
| Slate, dark, soft | 5 | 395 | |
| Lime, light, hard | 5 | 400 | |
| Slate, dark, soft | 10 | 410 | |
| Sandy shale, light, soft | 10 | 420 | |
| Lime, light, hard | 5 | 425 | |
| Shale, light, soft | 30 | 455 | |
| Lime, light, hard | 10 | 465 | |
| Slate, light, soft | 10 | 475 | |
| Lime, dark, hard | 5 | 480 | |
| Shale, blue, soft | 45 | 525 | |
| Shale, light, soft | 45 | 570 | |
| Lime, light, hard | 5 | 575 | |
| Shale, light, soft | 5 | 580 | |
| Lime, light, hard | 6 | 586 | |
| Shale, light, soft | 10 | 596 | |
| Red rock, red, soft | 5 | 601 | |
| Shale, light, soft | 4 | 605 | |
| Lime, light, hard | 3 | 608 | |
| Shale, light, soft | 12 | 620 | |
| Lime, light, hard | 5 | 625 | |
| Slate, dark, soft | 40 | 665 | |
| Shale, brown, soft | 5 | 670 | |
| Sand, light, soft; hole full of water at 675 feet | 20 | 690 | |
| Slate, dark, soft | 15 | 705 | |
| Sand, light, soft | 5 | 710 | |
| Slate, dark, soft | 8 | 718 | |
| Lime, light, hard | 3 | 721 | |
| Sand, light, soft | 4 | 725 | |
| Shale, light, soft | 55 | 780 | |
| Sand, light, soft; hole full water at 795 feet | 25 | 805 | |
| Sand, light, hard | 10 | 815 | |
| Slate, light, soft | 10 | 825 | |
| Lime, light, hard | 30 | 855 | |
| Shale, dark, soft | 10 | 865 | |
| Lime, light, hard | 5 | 870 | |
| Shale, light, soft | 95 | 965 | |
| Lime, light, hard | 5 | 970 | |
| Shale, dark, soft | 10 | 980 | |
| Lime, light, hard | 10 | 990 | |
| Shale, dark, soft | 15 | 1,005 | |
| Lime, light, hard | 20 | 1,025 | |
| Shale, light, soft | 75 | 1,100 | |
| Lime, light, hard | 20 | 1,120 | |
| Shale, dark, soft | 12 | 1,132 | |
| Lime, light, hard | 20 | 1,152 | |
| Shale, light, soft | 15 | 1,167 | |
| Lime, shells, hard | 13 | 1,180 | |
| Lime, light, hard | 20 | 1,200 | |
| Shale, light, soft | 1,200 | 1,220 | |
| Lime, light, hard | 2 | 1,225 | |
| Slate, dark, soft | 10 | 1,235 | |
| Sand, light, soft; 3 bailers of water per hour at 1,235 feet, | 3 | 1,238 | |
| Lime, light, hard | 12 | 1,250 | |
| Shale, dark, soft | 5 | 1,255 | |
| Lime, light, hard | 5 | 1,260 | |
| Shale, dark, soft | 3 | 1,263 | |
| Lime, light, hard | 8 | 1,271 | |
| Shale, dark, soft | 6 | 1,277 | |
| Lime, light, hard | 10 | 1,287 | |
| Shale, dark, soft | 5 | 1,292 | |
| Lime, light, hard | 28 | 1,320 | |
| Sand, light, soft; hole full of water at 1,325 feet | 25 | 1,345 | |
| Shale, light, soft | 58 | 1,403 | |
| Lime, light, hard | 37 | 1,440 | |
| Shale, dark, soft | 10 | 1,450 | |
| Lime, light, hard | 15 | 1,465 | |
| Slate, light, soft | 85 | 1,550 | |
| Sand, light, soft; little water at 1,558 feet | 8 | 1,558 | |
| Shale, dark, soft | 67 | 1,625 | |
| Lime, light, hard | 25 | 1,650 | |
| Slate, light, soft | 25 | 1,675 | |
| Slate, dark, soft | 25 | 1,700 | |
| Lime, light, hard | 135 | 1,835 | Lansing formation. |
| Shale, blue, soft | 155 | 1,990 | |
| Lime, light, hard | 10 | 2,000 | Kansas City formation. |
| Sand, light, soft; hole full of water at 2,005 feet | 5 | 2,005 | |
| Lime, light, hard | 10 | 2,015 | |
| Sand, light, soft | 5 | 2,020 | |
| Lime, light, hard; hole full of water | 105 | 2,125 | |
| Sand, light, soft | 8 | 2,133 | |
| Lime, light, hard | 17 | 2,150 | |
| Slate, light, soft | 90 | 2,240 | Marmaton formation, with possibly some Cherokee shale at bottom. |
| Lime, light, hard | 5 | 2,245 | |
| Shale, light, soft | 20 | 2,265 | |
| Lime, light, hard | 10 | 2,275 | |
| Slate, dark, soft | 30 | 2,305 | |
| Lime, dark, hard; bad cave at 2,315 feet | 33 | 2,338 | |
| Slate, dark, soft | 7 | 2,345 | |
| Lime, dark, hard | 5 | 2,350 | |
| Slate, light, soft | 80 | 2,430 | |
| Lime, light, hard | 5 | 2,435 | |
| Slate | 28 | 2,463 | |
| Sand, dark, hard; steel line measurement at 2,470 feet | 8 | 2,471 | |
| Slate, white, soft | 24 | 2,495 | |
| Slate, dark, soft | 31 | 2,526 | |
| Oil sand | 51 | 2,677 | Stapleton oil zone |
Wilson Dome. The Wilson dome in the Stapleton covers essentially, so far as available drilling information is at hand, the same territory as that of the 660-foot sand and that of the surface rocks. Its configuration at its southeast end is more like that of the 660-foot sand than that of the still younger surface rocks, as is to be expected. The most pronounced difference between the flexing of the Stapleton and that of the higher rocks is found to the east and southeast, where the Stapleton dips relatively much stronger toward the Dunkle and Theta minor synclines than the outcropping rocks. Its slope here is between three and five times as steep. No comparison can be made with the 660-foot sand because of the lack of reliable depth measurements to this sand this far down on the flanks.
The dome in the Stapleton has a double crest caused by a small down-fold, one of the minor details which is not represented in the surface rocks, but is reflected in the 660-foot sand by a flattening. The configuration of the flanks of the dome to the northwest and south and into the troughs of the Dunkle and Theta synclines has not been sufficiently determined by drilling to permit comparisons with the structure of the surface formations.
The noteworthy feature to be observed here is the structural location of the wells. The wells in the east half of section 9 are far down on the east flank, as low as the -1,240foot contour, whereas dry holes have been drilled on the south, west and northwest sides which are located respectively as high as the -1,060- and -1,080-foot contours. The wells on this dome have been rather uniform producers. The highest initial daily production reported for any well on this dome was 600 barrels, and this distinction was enjoyed by but two wells. Two others were reported as 500-barrel producers, and the others averaged about 200 to 300 barrels. The log of the initial Wilson dome well is given below:
| Log of Empire Gas and Fuel Company's Wilson Farm Well No. 1. | |||
|---|---|---|---|
| Location, center of NW SE, sec. 8, T. 25 S., R. 5 E. Drilled February 8 to March 23, 1917. Elevation of well mouth, 1,385 feet, which is about the same elevation as the top of the Fort Riley limestone. Initial production, 350 barrels. Casing record: 15 1/2-inch, 193 feet; 12 1/2-inch, 695 feet; 10-inch, 1,580 feet; 8 1/4-inch, 2,008 feet; 6 5/8-inch, 2,440 feet; 3-inch, 2,462 feet. Log furnished by the Empire Gas and Fuel Company. | |||
| Drillers' record | Thickness in feet |
Depth in feet |
Geological correlations |
| Lime, white, hard; enough water to drill with at 75 feet | 75 | 75 | Fort Riley limestone and Florence flint. |
| Sand, white, soft | 10 | 85 | |
| Lime, white, hard | 45 | 130 | |
| Shale, white, soft | 10 | 140 | |
| Lime, white, hard | 10 | 150 | |
| Shale, white, soft | 5 | 155 | |
| Lime, white, hard | 45 | 200 | |
| Shale, white, soft | 10 | 210 | |
| Lime, white, hard | 25 | 235 | |
| Shale, white, soft | 5 | 240 | |
| Lime, white, hard | 30 | 270 | |
| Shale, white, soft | 5 | 275 | |
| Lime, white, hard | 25 | 300 | |
| Shale, dark, soft | 40 | 340 | |
| Lime, white, hard | 20 | 360 | |
| Shale, dark, soft | 5 | 365 | |
| Lime, white, hard; enough water to drill with at 370 feet | 15 | 380 | |
| Shale, dark, soft | 5 | 385 | |
| Lime, white, hard | 15 | 400 | |
| Shale, dark, soft | 45 | 445 | |
| Lime, white, hard | 10 | 455 | |
| Shale, dark, soft | 20 | 475 | |
| Lime, white, hard | 10 | 485 | |
| Shale, white, soft | 10 | 495 | |
| Lime, white, hard | 5 | 500 | |
| Shale, white, soft | 62 | 562 | |
| Sand, gray, soft; small showing of oil at 562 to 567 feet | 5 | 567 | 550 foot oil sand. |
| Shale, white, soft | 53 | 620 | |
| Sand, gray, soft | 35 | 655 | |
| Shale, white, soft | 7 | 662 | |
| Sand, gray, soft; 10 bbls. of oil; very good-looking sand and oil | 23 | 685 | 660-foot oil sand. |
| Shale, gray, soft | 17 | 702 | |
| Lime, white, hard | 3 | 705 | |
| Shale, dark, soft | 10 | 715 | |
| Shale, white, soft | 60 | 775 | |
| Lime, white, hard | 25 | 800 | |
| Broken lime and shale, white, hard | 35 | 835 | |
| Lime, white, soft | 30 | 865 | |
| Shale, white, soft | 80 | 945 | |
| Lime, white, hard | 25 | 970 | |
| Shale, dark, soft | 20 | 990 | |
| Lime, white, hard | 10 | 1,000 | |
| Shale, dark, soft | 30 | 1,030 | |
| Lime, white, hard | 5 | 1,035 | |
| Shale, white, soft | 35 | 1,070 | |
| Lime, white, hard | 40 | 1,110 | |
| Shale, white, soft | 10 | 1,120 | |
| Lime, white, hard; about one-half million cu. ft. of gas at 1,120 feet in lime | 25 | 1,145 | |
| Shale, brown, soft | 10 | 1,155 | |
| Lime, white, hard | 20 | 1,175 | |
| Shale, white, soft | 10 | 1,185 | |
| Lime, white, hard | 12 | 1,197 | |
| Shale, brown, soft | 10 | 1,207 | |
| Lime, white, hard | 23 | 1,230 | |
| Shale, black, soft | 5 | 1,235, | |
| Lime, white, hard | 5 | 1,240 | |
| Shale, white, soft | 7 | 1,247 | |
| Lime, soft, white; small showing of oil at 1,250 feet in lime | 6 | 1,253 | |
| Shale, white, soft | 12 | 1,265 | |
| Lime, white, hard | 10 | 1,275 | |
| Lime, gray, hard | 25 | 1,300 | |
| Lime, gray, soft; 2 bailers of water at 1,317 feet in soft lime | 17 | 1,317 | |
| Shale, dark, soft; good showing of oil at 1,390 feet in lime | 39 | 1,356 | |
| Lime, white, hard; about one-half million cu. ft. of gas at 1,400 feet | 44 | 1,400 | |
| Shale, dark, soft | 5 | 1,425 | |
| Shale, dark, soft | 25 | 1,450 | |
| Lime, white, hard | 9 | 1,459 | |
| Shale, dark, soft | 31 | 1,490 | |
| Sand, brown, soft; 5 bailers of water per hour at 1,490 to 1,500 feet; 3 bailers of water per hour at 1,520 feet | 45 | 1,535 | |
| Shale, dark, soft | 40 | 1,575 | |
| Lime, white, hard | 10 | 1,585 | |
| Shale, white, soft | 35 | 1,620 | |
| Lime, white, hard | 5 | 1,625 | |
| Shale, white, soft | 55 | 1,680 | |
| Lime, white, hard | 155 | 1,835 | Lansing formation. |
| Shale, white, soft | 145 | 1,980 | |
| Lime, white, hard | 15 | 1,995 | Kansas City formation, containing Stokes "sand." |
| Lime, white, hard; good show of oil at 1,995 to 2,010 feet in soft lime; hole filled over 300 feet first hour | 15 | 2,010 | |
| Lime, white, hard | 40 | 2,050 | |
| Sandy, lime, white, hard; 12 bailers of water at 2,050 feet to 2,085 feet; small show of oil at 2,085 feet in sandy lime | 35 | 2,085 | |
| Lime, white, hard | 15 | 2,100 | |
| Shale, dark, soft | 110 | 2,210 | Marmaton formation, with possibly some Cherokee shale at bottom. |
| Lime, gray, hard | 3 | 2,213 | |
| Shale, blue, soft | 37 | 2,250 | |
| Shale, blue, soft | 45 | 2,295 | |
| Lime, white, hard | 33 | 2,328 | |
| Shale, soft | 47 | 2,375 | |
| Shale, dark, soft | 5 | 2,380 | |
| Lime, white, hard | 23 | 2,403 | |
| Sand, white, hard | 7 | 2,410 | |
| Shale, blue, soft | 28 | 2,438 | |
| Lime, red, hard; top of sand 2,438 feet (steel line measured) | 3 | 2438 | Stapleton oil zone. |
| Sand, brown, soft | 5 | 2,443 | |
| Sand, brown, hard | 5 | 2,448 | |
| Sand, brown, soft | 3 | 2,451 | |
| Sand, brown, hard | 10 | 2,461 | |
| Sand, white, hard | 4 | 2,465 | |
| Sand, white, soft | 2 | 2,467 | |
Robinson Dome. This flexure in the Stapleton zone is essentially similar, except in strength of development, to that in the outcropping Fort Riley limestone and Doyle shale. The flanks of the structure in the Stapleton are five or more times as steep. The principal difference between the Stapleton and surface rocks of this locality is a suggested second dome centered in section 2 to the east, with a southward plunging syncline between the two. This possible second dome has no similar fold in the surface rocks so far as was ascertained, but is represented by the broad and very shallow Ramsey syncline. The developments on this suggested second dome took place principally after the completion- of the field work on which this report was based, and hence accurate well locations and drilling information are not at hand for further discussion.
If this suggested second dome in reality exists in the Stapleton zone, the presence of good oil wells in the trough separating it from the main dome in section 3 is at least worthy of attention. Oil wells in this trough are situated as low as the -1,160-foot contour, while to the west is a dry hole located as high as the -1,030-foot contour. This situation is similar to the distribution of the producing wells on the Wilson, Chesney and Oil Hill domes, and the situation suggests that structure alone is not the sole controlling feature in the distribution of the oil.
The productivity of the wells on the Robinson dome points to a rather open condition in the pay rock. The first well drilled here, located in the middle of the south line of SW NE, sec. 3, and practically on the apex, came in with an initial daily production of about 1,900 barrels. The wells immediately adjacent came in at 750 to 1,000 barrels daily. These large wells rapidly lessened the pressure in the sand, and until late in 1918 the later wells averaged 100 to 300 barrels.
The wells located on the possible second dome to the east were all good producers, and up to the end of 1918 averaged about 400 barrels each in initial daily production, according to trade journal reports.
The logs of two wells on this dome are given below. The Robinson farm well is located high on the structure and its log is representative of most of the producing wells. The log of the Hewitt farm well, although a dry hole, is given because of its deep penetration into the rocks underlying the Stapleton zone.
| Log of Theta Oil Company's Frank Robinson Farm Well No. 4. | |||
|---|---|---|---|
| Location, southeast corner, SW NE, sec. 3, T. 25 S., R. 5 E. Drilled September 4 to October 25, 1917. Elevation of well mouth, 1,348 feet, which is about 7 feet below top of Fort Riley limestone. Initial production about 300 barrels. Log furnished by Theta Oil Company. | |||
| Drillers' record | Thickness in feet |
Depth in feet |
Geological correlations |
| Lime, white, hard; 8 bailers of water per hour | 65 | 65 | Fort Riley limestone and Florence flint. |
| Slate | 50 | 115 | Matfield shale. |
| Lime, white, hard | 10 | 125 | |
| Red rock, soft | 5 | 130 | |
| Lime shell, hard | 4 | 134 | |
| Slate | 10 | 144 | |
| Lime, hard | 30 | 174 | Wreford limestone. |
| Slate | 6 | 180 | Garrison limestone and shale. |
| Lime, hard | 12 | 192 | |
| Slate | 6 | 198 | |
| Lime | 15 | 213 | |
| Slate | 40 | 253 | |
| Lime | 5 | 258 | |
| Slate | 54 | 312 | |
| Lime and sand, hard; 2 bailers of water per hour | 18 | 330 | |
| Slate | 8 | 338 | |
| Lime | 15 | 353 | |
| Slate | 5 | 358 | |
| Lime | 12 | 370 | |
| Slate | 55 | 425 | |
| Lime | 15 | 440 | |
| Slate | 17 | 457 | |
| Lime shell, hard | 3 | 460 | |
| Slate | 165 | 625 | |
| Lime | 10 | 635 | |
| Slate | 85 | 720 | |
| Lime | 5 | 725 | |
| Slate | 10 | 735 | |
| Lime | 15 | 750 | |
| Slate | 30 | 780 | |
| Lime | 5 | 785 | |
| Slate | 12 | 797 | |
| Lime | 30 | 827 | |
| Slate | 48 | 875 | |
| Lime | 15 | 890 | |
| Slate | 70 | 960 | |
| Lime | 10 | 970 | |
| Slate | 30 | 1,000 | |
| Lime | 25 | 1,025 | |
| Slate | 75 | 1,100 | |
| Lime, hard | 25 | 1,125 | |
| Slate | 15 | 1,140 | |
| Lime shell, hard | 5 | 1,145 | |
| Slate | 35 | 1,180 | |
| Lime, hard | 30 | 1,210 | |
| Slate | 5 | 1,215 | |
| Lime | 30 | 1,245 | |
| Slate | 20 | 1,265 | |
| Lime, broken, soft; 1 bailer of water per hour | 20 | 1,285 | |
| Slate | 75 | 1,360 | |
| Lime, hard | 70 | 1,430 | |
| Slate | 45 | 1,475 | |
| Lime | 15 | 1,490 | |
| Slate, soft, caving | 15 | 1,505 | |
| Lime shell | 2 | 1,507 | |
| Slate | 93 | 1,600 | |
| Lime | 5 | 1,605 | |
| Slate | 65 | 1,670 | |
| Lime, hard; 1 bailer of water per hour | 130 | 1,800 | Lansing formation. |
| Slate | 5 | 1,805 | |
| Lime | 5 | 1,810 | |
| Slate | 134 | 1,944 | |
| Lime, hard; oil showing at 1,955 feet; 4 bailers water per hour | 176 | 2,120 | Kansas City formation containing Stokes "sand." |
| Slate | 63 | 2,183 | Marmaton formation, with possibly some Cherokee shale at bottom. |
| Lime shell, hard | 2 | 2,185 | |
| Slate, bad cave, white, soft | 40 | 2,225 | |
| Lime, white, hard | 12 | 2,237 | |
| Slate, cave, white, soft | 18 | 2,255 | |
| Lime, white, hard | 45 | 2,300 | |
| Slate, soft | 65 | 2,365 | |
| Lime, white, soft | 5 | 2,370 | |
| Slate, soft | 58 | 2,428 | |
| Oil sand, brown | 25 | 2,453 | Stapleton oil zone. |
| Log of Gypsy Oil Company's Hewitt Farm Well No. 1. | |||
|---|---|---|---|
| Location, northeast corner of the SE SW, sec. 3, T. 25 S., R. 5 E. Elevation of well mouth, 1,363 feet, which is about 8 feet above top of Fort Riley limestone. Dry hole. The log is complete for the drilling up to February 12, 1918. Drilled deeper later on. Casing record: 12 1/2-inch, 819 feet; 10-inch, 1,528 feet; 8-inch, 2,345 feet; 8-inch, 2,595 feet; 6 5/8- inch, 3,345 feet. Log furnished by Gypsy Oil Company. | |||
| Drillers' record | Thickness in feet |
Depth in feet |
Geological correlations |
| Soil | 15 | 15 | |
| Lime; 1 1/2 bailers of water per hour | 110 | 125 | |
| Blue shale | 10 | 135 | |
| Red rock | 8 | 143 | |
| White lime | 7 | 150 | Wreford limestone. |
| White lime | 15 | 165 | |
| White lime | 20 | 185 | |
| Blue shale | 40 | 225 | |
| Blue shale | 20 | 245 | |
| White lime | 15 | 260 | |
| Gray slate | 15 | 275 | |
| Gritty lime | 65 | 340 | |
| Lime | 10 | 350 | |
| Red rock | 10 | 360 | |
| Lime | 40 | 400 | |
| Lime | 20 | 420 | |
| Sandy lime; water | 35 | 455 | |
| Lime | 10 | 465 | |
| Blue lime | 15 | 480 | |
| Blue shale | 20 | 500 | |
| Blue shale | 30 | 530 | |
| Yellow lime | 15 | 545 | |
| Blue shale | 25 | 570 | |
| Blue shale | 50 | 620 | |
| Pink shale | 8 | 628 | |
| Brown shale | 12 | 640 | |
| Brown shale | 30 | 670 | |
| Gray shale | 20 | 690 | |
| White sand; water | 8 | 698 | |
| Gray shale | 32 | 730 | |
| Brown shale | 20 | 750 | |
| Brown shale | 20 | 770 | |
| Gray shale | 35 | 805 | |
| Dark lime; 2 bailers of water per hour | 7 | 812 | |
| Brown shale | 7 | 819 | |
| Gray shale | 21 | 840 | |
| Brown shale | 10 | 850 | |
| Light lime; water | 35 | 885 | |
| Gray shale | 15 | 900 | |
| Yellow lime; 2 bailers of water per hour | 15 | 915 | |
| Brown shale | 15 | 930 | |
| Blue shale | 50 | 980 | |
| Blue shale | 25 | 1,005 | |
| Gray lime | 15 | 1,020 | |
| Blue shale | 10 | 1,030 | |
| Yellow lime | 10 | 1,040 | |
| Shelly shale | 40 | 1,080 | |
| Brown shale | 20 | 1,100 | |
| Gray lime | 15 | 1,115 | |
| Gray shale | 15 | 1,130 | |
| Yellow lime | 15 | 1,145 | |
| Brown shale | 10 | 1,155 | |
| Dark lime | 15 | 1,170 | |
| Brown shale | 5 | 1,175 | |
| Unrecorded | 25 | 1,200 | |
| Blue lime | 12 | 1,212 | |
| Brown shale | 18 | 1,230 | |
| Brown lime | 8 | 1,238 | |
| Brown shale | 7 | 1245 | |
| Yellow lime | 25 | 1:270 | |
| Soft shale | 35 | 1,305 | |
| Blue lime | 15 | 1,320 | |
| Blue lime; 2 bailers of water per hour | 25 | 1,345 | |
| White, sandy lime | 15 | 1,360 | |
| Brown shale | 15 | 1,375 | |
| Unrecorded | 40 | 1,415 | |
| White lime, | 50 | 1,465 | |
| Brown shale | 5 | 1,470 | |
| Hard lime | 5 | 1,475 | |
| White shale, soft | 37 | 1,512 | |
| Lime | 8 | 1,520 | |
| Blue gumbo | 10 | 1,530 | |
| White lime | 10 | 1,540 | |
| Brown shale | 35 | 1,575 | |
| Brown shale | 60 | 1,635 | |
| Light, hard lime | 5 | 1,640 | |
| Gray shale | 25 | 1,665 | |
| Gray lime | 15 | 1,680 | |
| Brown shale | 30 | 1,710 | |
| Gray shale | 10 | 1,720 | |
| Blue lime | 30 | 1,750 | |
| Yellow lime; 4 bailers of water per hour | 10 | 1,760 | |
| Yellow sand | 25 | 1,785 | |
| Brown shale | 5 | 1,790 | Lansing formation. |
| Sandy, yellow lime | 80 | 1,870 | |
| Blue shale | 70 | 1,940 | |
| Gray shale | 50 | 1,990 | Kansas City formation. |
| Hard, gray lime | 100 | 2,090 | |
| White lime; 2 bailers of water per hour | 20 | 2,110 | Marmaton formation, with possibly some Cherokee shale at bottom. |
| Dark, soft shale | 7 | 2,117 | |
| White lime | 23 | 2,140 | |
| Dark lime | 15 | 2,155 | |
| Broken sandy lime | 15 | 2,170 | |
| White lime | 15 | 2,185 | |
| Sandy brown shale; one-half bailer of oil per hour | 75 | 2,260 | |
| White sand | 15 | 2,275 | |
| Broken white sand | 15 | 2,290 | |
| White sand; water | 15 | 2,305 | |
| Broken blue shale | 40 | 2,345 | |
| Yellow lime | 15 | 2,360 | |
| Blue shale | 10 | 2,370 | |
| Broken slate and lime | 20 | 2,390 | |
| Blue shale | 50 | 2,445 | |
| Broken dark lime | 20 | 2,465 | Stapleton oil zone. |
| Dark sand and lime | 25 | 2,490 | |
| Brown shale | 10 | 2,500 | |
| Dark, sandy lime | 20 | 2,520 | |
| Brown shale | 15 | 2,535 | |
| Shell lime | 3 | 2,538 | |
| Soft, brown shale; salt water | 55 | 2,593 | |
| White sand; water | 81 | 2,674 | |
| Blue shale | 10 | 2,684 | |
| Light sand | 10 | 2,694 | |
| Water sand | 6 | 2,700 | |
| Water | 45 | 2,745 | |
| Light lime; water | 5 | 2,750 | |
| Gritty sand | 40 | 2,790 | |
| Blue sand | 30 | 2,820 | |
| White, water sand | 20 | 2,840 | |
| White, gritty lime; water. | 100 | 2,940 | |
| Gritty lime | 100 | 3,040 | |
| Sandy lime; water | 60 | 3,100 | |
| Shelly lime; water | 50 | 3,150 | |
| Shelly lime; water | 50 | 3,200 | |
| Lime, very sharp and hard | 40 | 3,240 | |
| Hard, shelly lime | 25 | 3,265 | |
| White water sand | 40 | 3,305 | |
| Gritty lime | 30 | 3,335 | |
| Blue shale | 8 | 3,343 | |
| Soft, gray sand | 2 | 3,345 | |
| Limestone | 5 | 3,350 | |
| Sandstone | 5 | 3,355 | |
| Limestone | 40 | 3,395 | |
| (Record incomplete.) | |||
Prev Page--Structure || Next Page--Sluss-Smock Pool
Kansas Geological Survey, Geology
Placed on web July 28, 2017; originally published 1921.
Comments to webadmin@kgs.ku.edu
The URL for this page is http://www.kgs.ku.edu/Publications/Bulletins/7/07_sand.html