![]()
Prev Page--History of Mining, Geography || Next Page--Production, Reserves
Coals of the Wabaunsee Group
Stratigraphy
The Wabaunsee group of coal-bearing rocks constitutes the youngest or uppermost group of Pennsylvanian strata in Kansas. As classified by the State Geological Survey of Kansas (Moore, Frye, and Jewett, 1944, pp. 170-176), it belongs to the Virgilian series and includes 14 limestone and 14 shale formations (Fig. 2). The limits of the group are defined at the base by the Severy shale overlying the Topeka limestone formation of the Shawnee group and above by the Brownville limestone which lies immediately below the disconformity that separates Permian and Pennsylvanian rocks in Kansas. The Wabaunsee group is about 500 feet thick except in places where the overlying unconformity eliminates some of the uppermost Wabaunsee formations, as, for example, in Pottawatomie County where beds as low as the Auburn shale formation have been cut out by the Indian Cave sandstone of Permian age (Harned and Chelikowsky, 1945).
Figure 2--Generalized section of the Wabaunsee group of rocks in Kansas.
There are at least 12 coal beds in the Wabaunsee group of rocks, of which the lowermost or Nodaway coal is at present the only one of commercial importance. At least six coals, the Nodaway, Elmo, Cedar Creek in the Willard shale, an unnamed coal in the Wamego shale, the Nyman, and Lorton coals, are definitely known to have been mined at one time or another 40 to 60 years ago. The other coals are thin and unminable. The Wabaunsee coals and the formations in which they occur, in ascending order (Fig. 2), are: Nodaway in the Howard limestone; Elmo in the Cedar Vale shale; unnamed coals in the Silver Lake, Soldier Creek, Auburn, and Harveyville shale formations; Cedar Creek in the Willard shale; Nyman in the Langdon (formerly called Table Creek) shale; unnamed coals in the Dry and Friedrich shale formations; Lorton in the French Creek shale; and an unnamed coal in the Pony Creek shale. No attempt will be made in this report to describe all Wabaunsee coals. Only those coals which have been mined or are sufficiently thick to be mined will be discussed.
Nodaway Coal
Geographic distribution
Nodaway coal, as tracing shows, occurs almost continuously across the entire north-south width of Kansas along the strike of the Howard limestone formation from Doniphan and Nemaha counties to the Kansas-Oklahoma state line in Chautauqua County (Fig. 1). It has been mined in Atchison, Doniphan, Nemaha, Jefferson, Shawnee, Osage, Coffey, Elk, and Greenwood counties. At present this coal is mined in Osage County and to a limited extent in Jefferson County. All the places where the Nodaway coal has been observed by me or is known to occur are listed by counties in Tables 12, 22, 25, 28, 30, 31, and 35 and shown on Figures 9, 17, 20-23, 25-29 and Plate 1.
Stratigraphic position
The Nodaway coal occurs in the basal part of the Howard limestone formation. As classified by the State Geological Survey (Moore, 1936, pp. 204-208) the Howard limestone formation, where fully developed, is made up of the Bachelor Creek limestone, Aarde shale, Church limestone, Winzeler shale, and Utopia limestone. The Nodaway coal occurs below the Church limestone in the Aarde shale. The Bachelor Creek limestone is missing north of Scranton in Osage County. Where the Bachelor Creek limestone is absent, Moore (1936, p. 206) classed the Nodaway coal and other beds that are stratigraphically equivalent to the Aarde shale as belonging at the top of the Severy shale, for it was thought impractical to draw a boundary between two shale bodies. Because the Nodaway coal, as well as the shale between it and the overlying Church limestone, can be identified and traced without break along the strike of the Howard limestone throughout its extent, the boundary line between the Severy shale and Howard limestone formations is here placed at the base of the Nodaway coal, thus avoiding classification of the coal as part of the Severy shale in the northern half of eastern Kansas and as a unit of the Howard limestone in the southern half. Throughout the territory where the Nodaway coal is defined as the lowermost subdivision of the Howard limestone, the shaly beds lying between the Nodaway and the base of the Church limestone are called Shunganunga shale, in accordance with nomenclature introduced by Beede (1898, p. 29) from southern Shawnee County, Kansas. Studies by Moore and other Survey members subsequent to 1936 have demonstrated the presence in south-central Greenwood County and localities farther south of a dense limestone and black fissile shale in the upper part of the Aarde shale. as previously defined, between the Nodaway coal and Church limestone.
Additional observations made in preparing this report follow. (1) The Bachelor Creek limestone can be traced northward into Osage County approximately as far as Scranton, and at several places north of Osage County, as at the abandoned coal mines in .Shawnee County along Muddy Creek in sec. 10, T. 10 S., R. 16 E. about 2 miles west of Meriden in Jefferson County, the Bachelor Creek limestone may be represented by the occurrence of dense limestone nodules 20 inches below the coal. (2). The Utopia limestone locally contains abundant fusulinids in the upper part. (3) The Utopia limestone in Osage County and as far north as Jefferson and Atchison counties is divisible into several limestone beds, lithologically and texturally unlike, separated by shales, some of which are black, fissile, and full of ostracodes. (4) The Utopia limestone is absent at places in Atchison County where it has seemingly been cut out by a channel sandstone and conglomerate. (5) The black fissile shale in the Aarde shale member is persistent northward from south-central Greenwood County into Nebraska, Missouri, and Iowa (Moore, personal communication).
The Aarde shale is from 3 to 15 feet thick, averaging 8 feet in Chautauqua County, 3.6 feet in Elk County, 5.5 feet in Greenwood County, and 13 feet in Osage County. The true thickness of the Aarde shale north of Osage County is indeterminate because the basal Bachelor Creek limestone member is missing. The Aarde shale is typically gray to bluish gray and yellowish gray and clayey to sandy. In Osage County and southward a thin dense fine-grained bluish limestone is commonly present between the Nodaway coal and the base of the Church limestone (Pl. 4A). This limestone ranges from 2 to 22 inches in thickness and is from 9 inches to 3 feet 4 inches below the Church limestone. At places this dense limestone lies immediately above the coal, as at the outcrop in the NW NE sec. 11, T. 29 S., R. 10 E., Elk County, and in sec. 17, T. 32 S., R. 10 E., Chautauqua County. At most other outcrops, however, a grayish shale separates it from the coal. The greatest interval between the limestone and the coal is in Osage County where as much as 9 feet (sec. 3,4, T. 17 S., R. 14 E.) of shale intervenes. The black fissile shale, which is persistent in the upper part of the Aarde shale even though the thin dense limestone previously discussed is absent, is from 3 to 18 inches thick. A structureless sticky ash-colored underclay, averaging 1 foot in thickness, lies immediately beneath the coal.
The Church limestone, because of its massive, well-jointed character, serves as an excellent horizon marker in searching for Nodaway coal (Pl. 1) but the position of the coal varies from 2 to 126 inches below the limestone. The coal lies closest to the Church limestone in Greenwood County and farthest away in Osage County. The interval between the coal and the Bachelor Creek limestone ranges from 6 to 60 inches. The coal lies closest to the Bachelor Creek limestone in Elk County. The position of the coal relative to the Church and Bachelor Creek limestones in the various counties is presented in Table 1 and is shown graphically by Figures 3 and 4.
Figure 3--Stratigraphic sections showing position and thickness of Nodaway coal and its relation to adjacent rocks in Kansas. [A larger Acrobat PDF version of this figure is available.]
Table 1--Thickness, in inches, of beds between Nodaway coal and Church and Bachelor Creek limestones
| County | From base of Church limestone to top of Nodaway coal |
From base of Nodaway coal to top of Bachelor Creek limestone |
||
|---|---|---|---|---|
| Range | Average | Range | Average | |
| Nemaha | 21-30 | 25.5 | ||
| Doniphan | 14-30 | 23.2 | ||
| Atchison | 8-23.5 | 15.4 | ||
| Jefferson | 15-37 | 26.3 | ||
| Shawnee | 20-82 | 48.6 | ||
| Osage | 54-126 | 74.2 | 12-60 | 40.5 |
| Coffey | 24 | |||
| Lyon | 60 | 48 | 48 | |
| Greenwood | 2-30 | 10.9 | 7-54 | 18.6 |
| Elk | 24-36 | 33 | 6-24 | 12 |
| Chautauqua | 24-60 | 50.4 | 15-48 | 30.3 |
Figure 4--Stratigraphic sections showing position and thickness of Nodaway coal and its relation to adjacent rocks in Kansas. [A larger Acrobat PDF version of this figure is available.]
Thickness
Where seen in outcrops Nodaway coal ranges in thickness from a streak to 18 inches. Greater thicknesses, however, have been reported by various state coal mine inspectors and by operators and mine superintendents. In the active mines at Burlingame and Osage City, Osage County, the coal ranges from 16 to 20 inches in thickness and averages 18 inches, according to the mine operators and superintendents. These men report local thicknesses of as much as 36 inches. The coal is thinnest in Chautauqua, Greenwood, and Elk counties and thickest in Osage County. The minimum thickness, one-fourth to 1 inch, was observed in a road ditch on the south side of the road, 0.25 mile west of the school on the Chautauqua-Elk County line, in sec. 4, T. 32 S., R. 10 E. A similar thickness of coal occurs in a road cut on highway US 166, 0.1 mile west of the SE cor. sec. 1, T. 34 S., R. 9 E. The coal at this locality is an outlier of the Howard limestone and is 0.9 mile east of Wauneta. In most places in Greenwood County the coal is not more than 3 inches thick. A maximum thickness of 18 inches was measured in Osage County in the SE cor. sec. 12, T. 16 S., R. 14 E., in the Ira Rogers strip mine northeast of Osage City in the NW sec. 17, T. 16 S., R. 15 E. and in the recently opened Bell mine No. 4 in the SW cor. NW sec. 23, T. 15 S., R. 14 E., about 1 1/2 miles south of the junction of highways US 50 N and K 31 in Burlingame. The Nodaway coal at this mine is 120 feet beneath the surface. The Nodaway coal occurs as a single bed with one exception--in sec. 28, T. 3 S., R. 19 E., 1 1/2 miles south and 1 mile east of Leona in Doniphan County where the coal consists of a 2-inch vein separated from a lower 4-inch bed by 6 inches of shale. The thicknesses of the coal are summarized by counties in Table 2.
Table 2--Summary of thicknesses of Nodaway coal, in inches
| County | At outcrops | In underground mines | ||
|---|---|---|---|---|
| Range | Average | Range | Average | |
| Nemaha | 10-12 | |||
| Doniphan | 5-12 | 8.1 | ||
| Atchison | 9-14 | 11.5 | ||
| Jefferson | 9-15 | 11.1 | 12-17 | |
| Shawnee | 3-13 | 10.4 | 10-16 | 12 |
| Osage | 11-18 | 15.1 | 12-36 | 18 |
| Coffey | 12 | |||
| Lyon | 12 | |||
| Greenwood | 2-7 | 3.1 | ||
| Elk | 2-7 | 5 | ||
| Chautauqua | .025-2 | 1 | ||
Contact rock
With very few exceptions, the contact rock above and below the coal is gray to dark-gray shale. An ash-colored to light-bluish structureless and very sticky underclay which averages less than 1 foot in thickness immediately underlies the coal at numerous places. Typical laminated shale is present beneath the underclay. In the NW NE sec. 11, T. 29 S., R. 10 E., Elk County, and in sec. 17, T. 32 S., R. 10 E., Chautauqua County, a thin hard bluish limestone forms the upper contact rock, whereas in sec. 4, T. 5 S., R. 19 E,. Atchison County, the Church limestone rests on the coal.
Physical and chemical characteristics
Nodaway coal is classified as bituminous coal. It occurs practically everywhere as a single bed without any clay seams or partings. Where mined, it commonly splits in the middle of the bed into two distinct units, although no visible dirt or impure matter is present along the parting planes. The coal separates readily from the contact rock above and below with a clean-cut parting. Although the coal splits readily into two distinct layers, close examination reveals that it is composed of many thin layers from one-sixteenth to one-half inch thick which give the coal a laminated appearance. The uppermost one-quarter inch or less contains extremely matted highly carbonized coaly material showing the impression and structure of the woody material from which the coal was derived. On mining, the coal breaks into more or less rectangular slabs measuring approximately 30 by 36 by 8 inches and weighing between 300 and 400 pounds each. These large slabs remain fairly well intact even when slid down the steeply inclined loading chute and dumped and bumped vigorously on the bed and sides of trucks or against other slabs of coal. The coal also rides well without breaking while being hauled. Because of its slab-like shape, the coal can be packed nicely in trucks and later stacked well in cellars or elsewhere. Even though the coal has a tendency to remain in large slabs, it can be broken up easily with little pulverization into smaller lumps.
Normally the coal is bright, shiny, black, brittle, and moderately hard. Where exposed to weathering processes, the coal is duller in appearance and has a reddish to brownish cast, especially along the joint cracks and smaller fractures. Such coal is commonly termed "red coal" by the miners. The coal is generally free of clay, shale, or dirt impurities. In general, it is also free of visible pyrite grains, although pyrite may be seen in scattered clumps of small crystals along joint or fracture surfaces in some of the coal. Calcite in the form of white to semitransparent film-like sheets or veins commonly occurs along the joint and fracture surfaces.
The Nodaway coal is fairly uniform in thickness in any given area. Localized thickening of the coal, however, is reported by the miners. Where the coal is abnormally thick it is also much harder than usual. These thicker and harder coals are termed "rolls" by the miners who do not like to mine them. In places, small faults have caused several inches of displacement in the coal beds. The faults, however, are of no special significance to the miner. The coal dips gently toward the west and northwest.
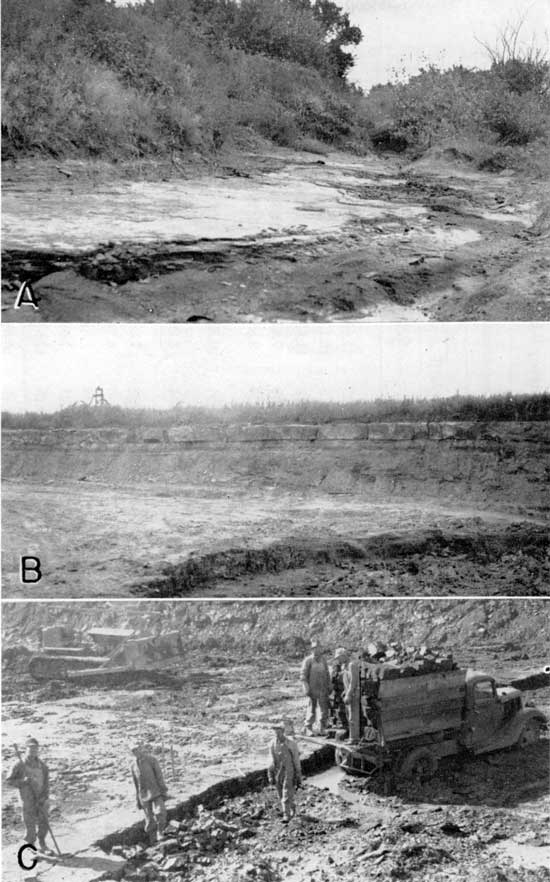
The Nodaway coal is exposed at numerous places along the steep face of the Howard limestone escarpment and in the beds of streams (Pl. 2A) that cut into the escarpment face. In these places the coal is usually mined by strip mining methods (Pl. 2B). Away from the escarpment edge, however, the coal is progressively farther beneath the surface as one travels westward. In the shaft mines, now mainly abandoned, the depth to the coal ranges from 27 feet nearest the escarpment edge to 120 feet 2 or 3 miles distant in the direction of dip.
Plate 2--A, Nodaway coal forming creek bed in the SW sec. 20, T. 18 S., R. 14 E., Osage County. B, Nodaway coal face in the H. Rogers & Sons strip mine in the SW sec. 20, T. 18 S., R. 14 E., Osage County, immediately west of view shown in A. Cap rock is the Church limestone. C, Superior Coal Co. strip mine in NW sec. 17, T. 16 S., R. 14 E., Osage County, showing coal face in fall of 1944, equipment used in removing overburden, and method of mining and loading coal.
Samples of Nodaway coal were collected at the eight mines operating in the fall of 1944. All of these except sample No. 12, which was collected in a recently opened small slope mine in the NW sec. 10, T. 9 S., R. 18 E., Jefferson County, were taken from mines in Osage County. Samples 1 to 5 are strip mine coals, and the other samples were obtained from shaft mines. Samples 4 and 5 are from the same strip mine, operated by Ira Rogers northeast of Osage City in the NW. sec. 17, T. 16 S., R. 15 E. Samples 1 and 2 are from a strip mine in the SW sec. 20, T. 18 S., R. 14 E., operated by H. Rogers. Samples 1 and 5 were collected along the coal face early in the fall of 1944 before mining activities were started. This coal had been exposed to weathering for approximately a year and represents what the miners call "red coal" rather than true or fresh coal. Samples 2 and 4 were secured after the "red coal" had been removed and the coal face had been extended to a point where the overburden was sufficiently thick to protect the coal from the ordinary processes of weathering. Sample 9 was taken in the newly opened Bell No. 4 shaft mine operated by William Isaacs in the NW sec. 23, T. 17 S., R. 14 E., 1 mile south of Burlingame. The coal was secured approximately 35 feet east of the shaft opening at a depth of 120 feet. All other deep mine samples were taken from the coal bed at distances of several hundred feet from the shaft openings. The Jefferson County slope mine sample was collected at the farthest extremity of the slope, which at the time of collection was about 25 feet from the portal of the mine. All samples represent the entire. thickness of the coal bed. They were obtained either in unbroken pieces or in two or more pieces which were then arranged in proper sequence so as to restore the total thickness of the coal. In the laboratories of the State Geological Survey all coal samples were channeled and analyzed by August Fleming. In addition, samples 2, 4, 5, 6, and 7 were zoned vertically into 2-inch bands, each of which was then analyzed separately from top to bottom. The proximate analyses of the Nodaway coal samples are given in Tables 3 and 4.
The analyses show that Nodaway coal has a high moisture and sulfur content as compared with other Kansas coals (Table 5). The ash content, on the other hand, is not unusually high. The B.T.U. value per pound compares favorably with the Bevier coal of Leavenworth County. Chemically, the coal is not uniform from top to bottom, as the zonal analyses of samples 2, 4, 5, 6, and 7 (Table 4) show, but seemingly there is no definite order in which the chemical variation occurs.
Table 3--Proximate analyses, sulfur content, and heating value of the Nodaway coal of eastern Kansas. Analyses by August Fleming in the State Geological Survey laboratories
| Sample No. |
County | Mine | Location | Moisture (percent) |
Volatile matter (percent) |
Fixed carbon (percent) |
Ash (percent) |
Sulfur (percent) |
B. T. U. per pound | ||
|---|---|---|---|---|---|---|---|---|---|---|---|
| As received |
Moisture free |
Moisture and ash free |
|||||||||
| 1 | Osage | H. Rogers strip | SW 20-18-14 | 9.21 | 27.41 | 47.69 | 15.69 | 9.90 | 10,671 | 11,753 | 14,209 |
| 2 | Osage | H. Rogers strip | SW 20-18-14 | 9.75 | 36.98 | 43.15 | 10.13 | 7.96 | 11,150 | 12,689 | 13,914 |
| 3 | Osage | Box car strip | NE 34-17-14 | 15.34 | 39.35 | 33.78 | 11.52 | 5.09 | 8,728 | 10,309 | 11,935 |
| 4 | Osage | Ira Rogers strip | NW 17-16-15 | 8.77 | 31.50 | 46.09 | 7.47 | 8.10 | 11,603 | 12,726 | 13,845 |
| 5 | Osage | Ira Rogers strip | NW 17-16-15 | 9.00 | 36.86 | 45.29 | 8.85 | 7.26 | 11,363 | 12,493 | 13,827 |
| 6 | Osage | Didier & Parre No. 1 |
NE 22-16-14 | 9.68 | 35.89 | 44.04 | 10.32 | 7.70 | 11,054 | 12,527 | 13,904 |
| 7 | Osage | Central Fuel Co. No. 2 |
SE 22-15-14 | 10.24 | 37.43 | 44.04 | 8.29 | 8.90 | 12,170 | 13,558 | 14,938 |
| 8 | Osage | Central Fuel Co. No. 3 |
SW 23-15-14 | 12.23 | 35.90 | 43.93 | 7.88 | 7.80 | 11,335 | 12,928 | 14,196 |
| 9 | Osage | Bell No. 4 | NW 23-17-14 | 8.16 | 39.09 | 46.00 | 6.74 | 6.30 | 11,953 | 13,015 | 14,047 |
| 10 | Osage | J. C. | NE 14-15-14 | 7.37 | 39.82 | 43.95 | 8.87 | 8.00 | 11,778, | 12,715 | 14,060 |
| 11 | Osage | Elliott Coal | NW 13-15-14 | 11.31 | 37.02 | 44-61 | 7.00 | 7.00 | 11,479 | 12,943 | 14,052 |
| 12 | Jefferson | Gaston Rolins | NW 10-9-18 | 11.52 | 31.72 | 39.18 | 17.57 | 6.80 | 9,826 | 11,105 | 13,590 |
| Average | 10.22 | 35.74 | 43.48 | 10.03 | 7.57 | 11,093 | 12,230 | 13,843 | |||
Table 4--Proximate analyses, sulfur content, and heating value of zoned Nodaway coal samples, Osage County, Kansas. (Table 3 mine and location) Analyses by August Fleming in the State Geological Survey laboratories
| Sample No. |
Zone | Thickness, inches |
Moisture (percent) |
Volatile matter (percent) |
Fixed carbon (percent) |
Ash (percent) |
Sulfur (percent) |
B. T. U. per pound | ||
|---|---|---|---|---|---|---|---|---|---|---|
| As received |
Moisture free |
Moisture and ash free |
||||||||
| 2 | a | 2.5 | 8.67 | 32.60 | 41.76 | 16.97 | 14.0 | 10,230 | 11,201 | 13,757 |
| b | 1.25 | 7.77 | 39.67 | 42.67 | 9.89 | 10.9 | 11,657 | 12,639 | 14,157 | |
| c | 2 | 9.69 | 39.41 | 44.60 | 6.29 | 6.4 | 11,781 | 13,045 | 14,023 | |
| d | 2.25 | 10.38 | 38.10 | 42.71 | 8.91 | 6.0 | 11,357 | 12,672 | 14,053 | |
| e | 2.5 | 11.11 | 35.37 | 43.49 | 10.08 | 6.1 | 11,241 | 12,646 | 14,271 | |
| f | 2 | 10.88 | 36.74 | 43.69 | 8.67 | 4.4 | 10,634 | 11,932 | 13,221 | |
| Average | 9.75 | 36.98 | 43.15 | 10.13 | 7.96 | 11,150 | 12,689 | 13,914 | ||
| 4 | a | 2 | 9.37 | 40.07 | 46.20 | 4.36 | 7.1 | 12,055 | 13,361 | 13,973 |
| b | 2 | 9.73 | 39.05 | 46.50 | 4.73 | 7.1 | 12,203 | 13,518 | 14,264 | |
| c | 1.75 | 9.42 | 39.18 | 46.05 | 5.35 | 7.1 | 12,019 | 13,268 | 14,102 | |
| d | 1.75 | 8.50 | 37.00 | 44.24 | 10.26 | 7.6 | 11,102 | 12,133 | 13,666 | |
| e | 2.5 | 7.83 | 34.55 | 46.27 | 11.35 | 10.8 | 10,859 | 11,781 | 13,436 | |
| f | 2 | 7.74 | 36.19 | 47.29 | 8.78 | 6.9 | 11,379 | 12,333 | 13,631 | |
| Average | 8.77 | 31.50 | 46.09 | 7.47 | 7.75 | 11,603 | 12,726 | 13,845 | ||
| 5 | a | 2 | 8.34 | 32.67 | 42.05 | 16.94 | 7.6 | 10,035 | 10,948 | 13,430 |
| b | 2 | 7.63 | 37.52 | 46.30 | 8.53 | 6.2 | 11,643 | 12,605 | 13,890 | |
| c | 2 | 8.39 | 34.58 | 45.30 | 11.73 | 6.45 | 10,999 | 13.006 | 13,769 | |
| d | 2 | 9.82 | 38.92 | 45.42 | 5.84 | 8.6 | 12,802 | 14,196 | 15,179 | |
| e | 1.5 | 9.44 | 39.88 | 45.76 | 4.92 | 7.7 | 10,940 | 12,080 | 12,774 | |
| f | 1.5 | 10.38 | 37.57 | 46.90 | 5.15 | 6.5 | 11,758 | 13,120 | 13,919 | |
| Average | 9.00 | 36.86 | 45.29 | 3.85 | 7.26 | 11,363 | 12,493 | 13,827 | ||
| 6 | a | 1.75 | 6.30 | 34.50 | 43.45 | 15.74 | 6.6 | 1.0,885 | 11,617 | 13,964 |
| b | 2 | 8.92 | 37.61 | 46.08 | 7.39 | 7.1 | 11,193 | 13,895 | 13,374 | |
| c | 2 | 10.11 | 36.83 | 43.97 | 9.15 | 6.6 | 11,489 | 12,781 | 14,220 | |
| d | 2 | 11.22 | 35.67 | 43.42 | 9.69 | 5.5 | 10,999 | 12,389 | 13,907 | |
| e | 2 | 10.64 | 36.09 | 44.66 | 8.61 | 6.5 | 11,312 | 12,659 | 14,009 | |
| f | 2.50 | 11.01 | 36.54 | 44.98 | 7.52 | 7.8 | 11,522 | 12,948 | 147134 | |
| g | 3.25 | 9.57 | 33.98 | 41.61 | 14.73 | 14.1 | 10,376 | 11,487 | 13,722 | |
| Average | 9.68 | 35.89 | 44.04 | 10.32 | 7.70 | 11,054 | 12,527 | 13,904 | ||
| 7 | a | 2 | 8.76 | 31.07 | 45.34 | 14.81 | 12.0 | 10,626 | 11,646 | 13,906 |
| b | 2 | 11.79 | 34.56 | 42.83 | 10.89 | 7.4 | 10,937 | 12,399 | 14,141 | |
| c | 2 | 15.35 | 36.07 | 42.52 | 6.05 | 6.75 | 11,470 | 13,550 | 14,594 | |
| d | 2 | 12.27 | 36.58 | 45.02 | 5.84 | 6.9 | 11,721 | 13,406 | 14,363 | |
| e | 2 | 13.13 | 38.57 | 44.25 | 4.05 | 6.8 | 11,314 | 13,024 | 13,661 | |
| f | 2 | 12.43 | 39.72 | 43.84 | 3.90 | 4.8 | 11,809 | 13,485 | 14,122 | |
| g | 2 | 11.60 | 38.38 | 44.59 | 5.42 | 6.3 | 11,699 | 13,234 | 14,100 | |
| h | 2 | 12.42 | 32.30 | 43.34 | 12.04 | 12.4 | 11,104 | 12,679 | 14,680 | |
| Average | 12.26 | 35.90 | 43.98 | 7.88 | 7.80 | 11,335 | 12,928 | 14,196 | ||
Table 5--Average proximate analyses, sulfur content, and heating value of Kansas coals. (Schoewe, 1944, Tables 4 and 5)
| County | No. of analyses |
Name of coal |
Moisture (percent) |
Volatile matter (percent) |
Fixed carbon (percent) |
Ash (percent) |
Sulfur (percent) |
B. T. U. per pound | ||
|---|---|---|---|---|---|---|---|---|---|---|
| As received |
Moisture free |
Moisture and ash free |
||||||||
| Crawford | 3 | Fort Scott1 | 2.80 | 40.3 | 47.4 | 9.3 | 3.9 | 13,286 | 13,670 | 15,130 |
| Crawford and Labette | 6 | Bevier1 | 3.80 | 37.8 | 48.6 | 9.8 | 2.6 | 13,026 | 13,545 | 15,077 |
| Cherokee | 1 | Fleming1 | 2.80 | 39.3 | 47.3 | 10.6 | 2.3 | 13,090 | 13,473 | 15,120 |
| Cherokee and Crawford | 9 | Mineral1 | 4.30 | 34.3 | 48.7 | 12.6 | 3.8 | 12,488 | 13,048 | 15,029 |
| Barton (Mo.), Crawford, and Cherokee |
21 | Weir-Pittsburg1 | 6.10 | 33.3 | 50.7 | 9.9 | 3.7 | 12,622 | 13,367 | 15,007 |
| Cherokee | 3 | "Local"1 | 5.0 | 30.7 | 48.1 | 16.1 | 6.8 | 11,576 | 12,193 | 14,696 |
| Cherokee | 6 | Weir-Pittsburg2 | 5.05 | 33.98 | 52.33 | 8.63 | 3.8 | 13,045 | 13,738 | |
| Crawford | Weir-Pittsburg2 | 5.95 | 33.0 | 51.1 | 8.3 | 4.2 | 12,590 | 13,385 | 14965 | |
| Leavenworth | 12 | Bevier2 | 11.85 | 35.35 | 39.9 | 12.9 | 4.1 | 11,145 | 12,335 | 14:433 |
| Linn | 11 | Mulberry2 | 9.26 | 31.66 | 45.44 | 13.43 | 2.94 | 11,386 | 12,552 | 14,733 |
| Linn-Miami | 3 | Thayer3 | 4.27 | 36.27 | 44.81 | 14.66 | 2.39 | 12,341 | 12,863 | 15,064 |
| Neosho | 3 | Thayer3 | 5.94 | 33.33 | 53.15 | 7.56 | 0.97 | 12,878 | 13,676 | 14,796 |
| Montgomery | 5 | Thayer3 | 7.08 | 34.62 | 45.50 | 11.20 | 1.74 | 11,967 | 12,820 | 14,456 |
| Wilson | 2 | Thayer3 | 2.96 | 32.50 | 51.10 | 13.45 | 2.02 | 12,789 | 13,187 | 15,269 |
| 1From Pierce and Courtier (1937, p. 81). 2Average computed from U.S. Bureau of Mines analyses (1929, Table 7). 3Averages computed from Table 4, Schoewe, 1944. |
||||||||||
Mining methods
Nodaway coal is at present mined by stripping and deep shaft mining methods, and at one place, in the SW sec. 3, T. 9 S., R. 18 E. in Jefferson County, by drifting or slope mining methods. In former years, drift or slope mining was prevalent along the line of coal outcrops throughout the entire Wabaunsee coal-mining area. Some coal was, and undoubtedly still is, mined directly from the face of the outcrop. Such outcrop mines are commonly in the beds of creeks or along their banks. They are of extremely local extent and yield only a small amount of coal.
Strip mines
Much of the coal has been mined by the stripping method, especially around Carbondale, Scranton, Osage City, and Arvonia in Osage County, at Lebo in Coffey County, and a short distance east of Neosho Rapids near the Lyons-Coffey County line. In the fall of 1944 only two strip mines were in operation, both in Osage County. One of the mines is northeast of Osage City in the NW sec. 17, T. 16 S., R. 15 E., and is operated by Ira Rogers (Pl. 2C). The other mine is operated by H. Rogers and Sons and is in the SW sec. 20, T. 18 S., R. 14 E., about 1 mile south and 1 mile west of Arvonia (Pl. 2B). On August 7, 1945, Perry Jones and R. A. Linville of Carbondale began preparations for stripping about 5 acres of coal land in the NE sec. 19, T. 14 S., R. 16 E., about 1 mile east of Carbondale. Coal had been stripped here last in 1942. Stripping of coal is usually done during the fall and winter months. During the other months both Ira and H. Rogers build dams and farm ponds. The overburden at the mines, which ranges from 9 to 20 feet, is removed by huge bulldozers, and the coal, which is 13 to 20 inches thick, is broken into large slabs along the coal face with wedges and crowbars (Pl. 2C). The coal sells for $4.25 a ton at the mine. According to Ira Rogers, operator of the strip mine northeast of Osage City, the coal is trucked from his mine to Burlington, Council Grove, Dunlap, Emporia, Eureka, Harveyville, Lawrence, MeLouth, Melvern, Osage City, Ottawa, Overbrook, Pomona, Quenemo, Reading, Richmond, Soldier, Topeka, Vermillion, and Waverly (Fig. 5). In the strip mine country the royalty paid to the lessor is 1 to 3.5 cents per bushel or 25 to 75 cents per ton of coal mined. Stripping of coal was formerly much more extensive than now. Old strip pits are numerous in the vicinity of Carbondale, east and south of Scranton, northeast and southeast of Osage City, and in a more or less continuous strip along the Howard limestone escarpment between Arvonia (Osage County) and Lebo (Coffey County) (Fig. 17). Other Nodaway coal strip pits are the Capital mines in the SW sec. 13, T. 12 S., R. 15 E., about 2 miles south of Topeka, the strip pits near the Coffeyville-Lyon County line in secs. 23, 24, and 26, T. 13 S., R. 19 E., and the strip mines in Nemaha County in the NW sec. 12 and SW sec. 24, T. 1 S., R. 12 E.Figure 5--Map showing the distribution of coal from the Nodaway coal strip mines of Osage County, Kansas.
Shaft mines
All the commercial mines producing Nodaway coal, except the three strip mines just referred to, are shaft mines. In the fall of 1944 only six shaft mines were in operation in the Wabaunsee coal-bearing area. Two of the mines are east and three are south of Burlingame; the sixth mine is northwest of Osage City. The mines are 109 to 120 feet deep. The coal is mined by the longwall method (Fig. 6; for description of method see Bowsher and Jewett, 1943, pp. 24-26) and is hoisted to the surface electrically after being cut by machine. The shafts are of standard size, 12 by 6 feet. All the coal mined is trucked away as none of the mines have railroad connections. The selling price of the coal at the mines is $5.00 per ton. A royalty of 8 cents per ton of mined coal is paid the lessor.
Figure 6--Plat of an Osage County shaft mine showing the longwall method of mining.
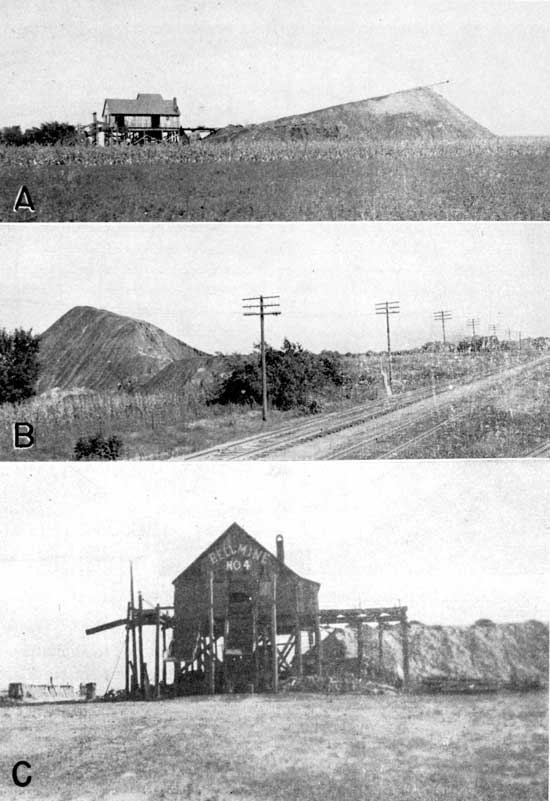
Because of the manpower shortage the mines are not operating with as large a force as normal. Before the war 30 to 40 men per mine were employed, but in the 1944-45 coal season less than half this number were employed. Before the war most of the miners were young to middle aged men, whereas at the time of my visit to the mines practically all the miners were men in their late sixties or early seventies who had returned to the mines from retirement in order to do their share in the war effort. During the years of greatest development, Osage County had 70 or more mines employing about 2,000 men operating at one time. Today only six shaft mines are being operated (Pl. 3A). In the vicinity of Osage City and Burlingame, however, several shaft buildings and tipples are still standing (Pl. 5A) at the mines, but at most Places the buildings have been removed, the only evidence of the old mines being the dump piles (Pl. 3B). Between Scranton and Burlingame, a distance of only 5 miles, traces of at least 50 mines may be found and a like number occur within a 1-mile radius from the center of Osage City. At some places the tell-tale dump piles of former mines have been removed and information regarding the former existence of mines must be obtained from coal operators and local citizens.
Plate 3--A, Surface view of the active shaft mine in the Osage coal field operated by Central Fuel Coal Company in the SW sec. 23, T. 15 S., R. 14 E. about 1 1/2 miles south of Burlingame, Osage County. B. Typical coal mine dump,of abandoned shaft mine adjacent to railroad right of way, south line sec. 22, T. 16 S., R. 14 E. immediately west of west limits of Osage City. C, Newest shaft mine in the Osage coal field, the Bell No. 4 mine, started in March 1944. Mine about 1 mile south of Burlingame in SW cor. NW sec. 23, T. 15 S., R. 14 E.
Drift mines
In the past, drift or slope mines were common along the entire edge of the Howard limestone escarpment. All such mines are now caved in, cannot be entered, and many cannot be located without detailed descriptions. Only one drift or slope mine was in operation in 1944 (Pl. 4B). Late in 1943 Gaston Rolins opened a drift mine in the SW sec. 3, T. 9 S., R. 18 E., Jefferson County. On September 26, 1945, the tunnel had been extended 25 feet into the hill. The tunnel opening was 7 feet high and 10 feet wide. The coal, 14 inches thick, lies 3 feet beneath the Church limestone. By September 1945, 15 tons of coal had been taken from the drift. A proximate analysis of the coal is found in Table 3.
Number of Nodaway coal mines
The number of Nodaway coal mines in the Wabaunsee coal-mining area is surprisingly large. I have located and plotted on maps a total of 408 Nodaway coal mines, of which 302 are in Osage County. This is the minimum number of mines once worked as undoubtedly there are some mines whose physical traces are entirely absent and knowledge of which is entirely forgotten. Furthermore, it is practically impossible to know how many mines there are in any given strip mining area. All strip mining areas are counted in.this report as representing a single mine unless it is definitely known that contiguous acreage has been mined by independent operators. A tabulation of the number of each type of mine operated in the 10 counties in which the Nodaway coal occurs is presented in Table 6.
Table 6--Mines in the Nodaway coal classified by county and type
| County | Number of mines | |||
|---|---|---|---|---|
| Shaft | Strip | Drift | Total | |
| Atchison | 1 | 3 | 4 | |
| Coffey | 3 | 26 | x | 29 |
| Doniphan | 1 | 1 | ||
| Elk | 5 | 1 | 6 | |
| Greenwood | x | x | ||
| Jefferson | 2 | 26 | 28 | |
| Lyon | 1 | 1 | ||
| Nemaha | 1 | 2 | 9 | 12 |
| Osage | 174 | 128 | x | 302 |
| Shawnee | 5 | 3 | 17 | 25 |
| Total | 186 | 164 | 58 | 408 |
| x Mines reported but number and location unknown. | ||||
Production
Complete statistics on Nodaway coal production are not available, primarily because much of the coal mined, especially in the earlier years, did not enter into regular commercial channels. Much of the coal, particularly in the counties north of the Osage City-Burlingame coal district, was removed and used by local individuals, chiefly farmers, who mined the coal as needed and were not concerned with keeping records of production. Although some early reports give data on the total amount of coal produced in some of the counties, no differentiation is made as to what horizon the coal came from. As far as is known, coal mining started with the coming of the first settlers and the establishment of the first towns. Commercial coal mining may be said to have had its inception in 1869. According to all available published data, a cumulative minimum of 11,783,464 tons of Nodaway coal of which 11,448,861 tons was produced in Osage County, had been mined at the close of the 1944-45 coal mining season. This total includes coal mined in Coffey, Jefferson, Nemaha, Osage, and Shawnee counties (Table 11) but does not represent the entire cumulative Nodaway production for the records do not show how much of the.coal mined in Atchison, Doniphan, Elk, Greenwood, Jackson, and Lyon counties came from the Nodaway coal bed.
Noncommercial coal mined
In addition to the commercial coal mined, some Nodaway coal has been mined from earliest times on by farmers and others for their own use. The tonnage of coal mined in this manner is not included in published statistical data on the state's coal production. During the course of field studies numerous individuals on whose farms coal occurs were contacted for production and other mine data, and all former but now abandoned mines that could be located were visited. Such mines, mainly drift or slope mines, are especially numerous in Atchison and Jefferson counties.
Present production
Production of Nodaway coal at the present time is far below that of former years. Annual production ranged from 372,000 to 452,751 tons between 1.885 and 1892 and from 120,000 to 296,000 tons in the next 16 years; however, annual production has been less than 90,000 tons in subsequent years except 1940. In that year Osage County, the only commercial producer since about 1900, mined 103,885 tons of Nodaway coal. Production dropped to 79,161 tons in 1941, 85..180 tons in 1942, 51,239 tons in 1943, and 48,861 tons in 1944. In 1931 only 45,984 tons of Nodaway coal were mined. In 1943, nine shaft and five strip mines, employing a total of 195 men, were in operation. During the first six months of 1944, 136 men worked in the eight shaft and four strip mines that were active. In the fall of 1944 coal was mined in only six shaft and two strip mines by about 100 men. In the summer of 1945 considerable acreage was being leased and core drilled for possible future stripping development.
Reserves
Practically all the coal that has been mined was removed either along the face of the Howard escarpment or from a narrow belt within 2 miles of the escarpment edge. This latter belt is in the shaft mining district between Scranton and Burlingame and between Burlingame and Osage City. Here most of the shaft mines either follow the tracks of the Santa Fe Railroad or line both sides of highway US 50N. The Osage County map (Pl. 1) showing the location of the coal mines, proved reserve lands, and potential coal yielding areas shows that the coal has been mined from a very limited area. Thus far only the most accessible and convenient coal has been exploited. According to Young (1925, p. 36), there is still a large amount of coal to be mined but the best portions of the Nodaway coal have already been mined. Many of the miners, however, are of the opinion that most of the Nodaway coal is still unmined. In the new Bell No. 4 mine in sec. 23, T. 15 S., R. 14 E. about 1 mile south of Burlingame, for example, there is no diminishing in the thickness of the coal down the dip or in a westerly direction. It is the miners' opinion that the present distribution of the shaft mines was determined mainly by the location of the railroad and the main highway, and that in the future shafts will be sunk at places farther and farther away from the highway.
Bases for computing reserves
In determining coal reserves, both proved and potential reserves are considered. Proved coal reserves are those coals which can be mined with profit under existing economic conditions. All proved coal reserves are limited to active mining districts or places where definite thicknesses of the coal are known from outcrops, drill records, or actual mined coal seams. Potential coal reserve lands are the areas believed to be underlain by coal of given thicknesses. As no procedure for calculating coal reserves has been generally accepted by the various operating companies and scientific agencies, a definite procedure for determining both proved and potential coal reserves of the state was established in 1946 by Abernathy, Jewett, and Schoewe of the State Geological Survey in connection with their studies of the coal reserves of the state. As used by the Survey the proved coal reserve refers to coal that lies within arbitrary limits of thickness and distance from a known occurrence. These limits are based on past experience of the industry and geological observations in Kansas. The potential reserve is arrived at by regional stratigraphic projection. The following methods of computing the coal reserves in the state are taken from the report by Abernathy, Jewett, and Schoewe (1947).
- Minimum thickness of coal bed considered for strippable coal and all potential coal is 10 inches.
- Reserve coal is considered to amount to 125 tons per acre-inch of coal.
- Preparation and mining losses were not considered; the calculated reserves are tons of coal in place.
- Maximum depth of coal included in these calculations is 60 feet or the ratio of overburden to be stripped to the coal is not more than 35 cubic yards to 1 ton of coal.
- Minimum thickness of reserve coal considered minable at various depths by underground methods are shown in Table 7 (Abernathy, Jewett, and Schoewe, 1947, Table 1.).
- The method of computing an area of proved coal reserves is based on the following. A known thickness of coal at an outcrop, a drill hole, deep well, or in a mine is regarded as proving the presence of coal having the same thickness under 1 square mile (Fig. 7A). Two or more known occurrences of the same coal bed 4 miles or less apart and lying in the general direction of the strike are regarded as proving the coal to be continuous between these points (Fig. 7B and C). In the calculation of potential reserves a known thickness of coal at an outcrop, a drill hole, or in a mine is regarded as indicating the presence of coal of the same thickness under 400 square miles (Fig. 7E). The areas of both proved and potential coal calculated by these methods were in most cases greatly reduced from their maximum size by the location of drill holes or outcrops which indicated poor coal, thin coal, or no coal; by areas where the coal has been removed by erosion (Fig. 7C and D); or areas that extend across the state line.
Table 7--Maximum depth to coal per minimum thickness of coal beds considered minable by underground methods in Kansas. (Abernathy, Jewett, and Schoewe, 1947, Table 1)
| Maximum depth to coal, feet |
Minimum thickness of coal, inches |
|---|---|
| 100 | 16 |
| 150 | 18 |
| 200 | 22 |
| 600 | 32 |
| 1,200 | 36 |
All reserve figures cited in this report are stated to the nearest ten thousand tons.
Figure 7--Diagram showing method of determining proved and potential coal reserves.
Total Nodaway coal reserves
The total proved Nodaway coal reserves are calculated at 128,050,000 tons and the potential reserves at 1,285,960,000 tons. A summary of the Nodaway coal reserves by counties is presented in Table 11. Detailed discussion of coal reserve lands and tonnage for each county is presented on subsequent pages.
Elmo Coal
Geographic distribution
The Elmo coal, like the Nodaway, is a persistent coal that can be traced from northeastern Brown County to the Kansas-Oklahoma state boundary in Chautauqua County (Fig. 1). The coal occurs in the upper part of the Cedar Vale shale which underlies the Burlingame limestone so that it can be traced in outcrops close to and following the escarpment of the Burlingame limestone.
Stratigraphic position
The Elmo coal occurs in the uppermost part of the Cedar Vale shale, whose thickness ranges from about 17 feet in Brown County to about 56 feet in Greenwood County. The formation has an average thickness of 25 feet. The Cedar Vale shale comprises bluish to yellowish-brown clayey and sandy shale and sandstone, which is overlain by the Rulo limestone and underlain by the Happy Hollow limestone. The Rulo limestone is an impure bluish-gray rock, commonly massive, well-jointed, and consisting either of a single bed or of two beds. The rock weathers shelly and breaks into large rectangular blocks. Not uncommonly the limestone is more shaly than calcareous and loses its identity as a distinct bed. The Rulo limestone is highly fossiliferous, containing abundant crinoid fragments, brachiopods, bryozoans, and, locally, mollusks and algae. Observed thicknesses range from 4 inches to 3.5 feet, averaging about 2 feet. The Happy Hollow limestone at the base of the Cedar Vale shale consists generally of a single massive bed or of two to three beds of pinkish-brown limestone containing large fusulines. The limestone becomes yellowish-brown and crumbly on weathering. In secs. 19 and 30, T. 22 S., R. 12 E., Greenwood County, the Happy Hollow limestone consists of a 9-inch whitish crumbly limestone separated from a 13-inch massive single bed by a 7-inch shale containing calcareous nodules. Beneath the massive limestone is 11 inches of thin-bedded fusuline-bearing limestone. The Happy Hollow limestone is 9 inches to 8 feet thick. At several localities, especially in Brown County, the Elmo coal underlies the Rulo limestone without any intervening shale, whereas at other places, as at the outcrop northwest of Kiro in Shawnee County in sec. 1, T. 11 S., R. 14 E., at least 15 feet of shale separates the coal from the limestone. The intervening shale is 8 feet thick 1 1/2 miles south of Madison in Greenwood County. In Atchison and Brown counties the Rulo limestone is not everywhere present. This fact may be explained on the basis that either the Rulo limestone has become so shaly that its identity as a resistant calcareous rock has been lost or it was eroded before the deposition of the overlying Silver Lake shale. In the latter case a disconformable contact between the Cedar Vale and Silver Lake shale formations exists. The Rulo limestone is missing on the east side of a road cut, 1 mile north of Larkinburg in sec. 31, T. 6 S., R. 17 E., Atchison County; on the north side of a road cut 0.8 mile east of Arrington in sec. 4, T. 7 S., R. 17 E., Atchison County; and in an abandoned quarry 1.75 miles east and. 1.5 miles south of Robinson in sec. 15, T. 3 S., R. 18 E., Brown County.
Locally at least, as at the outcrop in Chautauqua County in the SE sec. 26, T. 32 S., R. 9 E., a coal occurs a short distance below the Burlingame limestone in the Silver Lake shale. Where the Rulo limestone is absent and the Silver Lake and Cedar Vale shales are in contact, and the coal occurs at some distance below the Burlingame limestone, it is believed to be Elmo. Stratigraphic relationships of the Elmo coal are shown graphically in Figure 8.
Figure 8--Stratigraphic sections showing position and thickness of Elmo coal and its relation to adjacent rocks in Kansas. [A larger Acrobat PDF version of this figure is available.]
Thickness
Elmo coal where observed ranges from less than 1 inch to 16 inches in thickness. The maximum thickness was observed in Brown County, where the coal was mined extensively for local consumption 20 to 40 years ago. The great thickness of Elmo coal reported to me is 19 to 21 inches where it was mined by drifting about 2 miles south of Arrington in the NE cor. sec. 20, T. 7 S., R. 17 E., Atchison County. Nowhere south of Shawnee County have I seen Elmo coal thicker than 5 inches. Coal has been mined in the vicinity of the former town of Leeds in Chautauqua County. Whitla (1940, pp. 32-33) considered the coal to be Nodaway, from 16 to 18 inches thick. Field studies, however, show that the coal is Elmo and that the cap rock interpreted by Whitla to be Church limestone in reality is Rulo limestone, 50 feet below the base of the Burlingame limestone. The coal is not exposed in the vicinity of Leeds. Further detailed discussion of this coal is found under Chautauqua County. Unlike Nodaway coal, Elmo coal at some outcrops in Atchison and Brown counties is divided into two beds by a clay or shale parting 1 to 2 1/2 inches thick. Along the road 1 mile north of Larkinburg, in sec. 31, T. 6 S., R. 17 E., Atchison County, there are three seams of coal: coal 8 inches, clay 1 inch, coal 4 inches, black shale 4 inches, and coal 1 inch. Table 8 gives the observed thickness of Elmo coal.
Table 8--Summary of thicknesses of Elmo coal, in inches.
| County | At outcrops | In underground mines | ||
|---|---|---|---|---|
| Range | Average | Range | Average | |
| Atchison | 7-16 | 15 | 17-21 | 17 |
| Brown | 12-18 | 12-30 | 16 | |
| Pottawatomie | 3 | |||
| Shawnee | 3.6-16 | 3.6 | 16 | |
| Osage | 0.5-2 | 1 | ||
| Lyon | 2.4-4.8 | 3 | ||
| Greenwood | 2-4 | 2 | ||
| Chautauqua | 1.2-1.5 | 1.2 | 16-18 | 18 |
Contact rock
The contact rock of the Elmo coal is either limestone or shale. Where the Rulo limestone is present, the coal lies either directly beneath the limestone or is separated from it by a shale 1 1/2 inches to 15 feet thick. Where the Rulo limestone is missing, the upper contact rock is shale. The lower contact rock is everywhere shale or underclay. The bluish to ash-white sticky structureless underclay which is found at many outcrops beneath the Nodaway coal is missing beneath the Elmo coal except at two outcrops, in sec. 10, T. 15 S., R. 14 E., Osage County, and in sec. 34, T. 3 S., R. 18 E., Brown County. At the Osage County exposure the underclay is 6 inches thick; in Brown County it is 12 inches thick.
Physical and chemical characteristics
The Elmo coal is a bituminous coal. It does not everywhere occur as a single vein, but in all other respects it is similar to the Nodaway coal.
Mining methods
Elmo coal, as far as could be learned, has been mined only in Atchison, Brown, Chautauqua, Elk, and Shawnee counties. Strip, drift, shaft, and outcrop mining have been employed, but slope (or drift) mining has been the predominant method.
Elmo coal has been extracted from at least 81 mines, of which 61 may be classified as drift or slope mines, 9 as shaft mines, 9 as strip mines, and 2 as outcrop mines. Brown County, with 30 mines, leads in the number of Elmo coal mines followed by Atchison County with 26 mines (Table 9).
Table 9--Mines in the Elmo coal classified by county and type
| County | Number of mines | ||||
|---|---|---|---|---|---|
| Shaft | Strip | Drift | Outcrop | Total | |
| Atchison | 2 | 2 | 22 | 26 | |
| Brown | 3 | 2 | 23 | 2 | 30 |
| Chautauqua | 5 | 5 | |||
| Elk | 1 | 4 | 5 | ||
| Jackson | 3 | 3 | |||
| Shawnee | 3 | 1 | 8 | 12 | |
| Total | 9 | 9 | 61 | 2 | 81 |
The most recently operated Elmo coal mine is on the Clyde Royer farm 1 mile north and 0. 5 mile east of Arrington in the SE, sec. 33, T. 6 S., R. 17 E., Atchison County. The mine was operated in 1942 and the coal, at least 14 inches thick, was obtained by the stripping method. The coal also was stripped at other places, all of which are discussed under the counties in which the mines occur. The drift or slope mines have long been abandoned so that their entries or portals are now caved in. In most places the only evidence of their former existence is the grass and tree-covered dump heaps and traces of trenches leading to the former mine openings. Such mines can be located only with the help of detailed descriptions supplied by the older residents, followed by diligent search and by scratching suspected mounds for coal chips. Coal has been mined along the face of the outcrop in the SE sec. 35, T. 3 S., R. 18 E., Brown County, on the south bank of a small east-flowing stream. The coal here consists of an upper 10-inch bed separated from a 2-inch lower coal by a 2-inch underclay. A short distance upstream the coal crops out in the stream bed. Here also some of the coal has been mined by stripping. At present the Elmo coal is not being mined.
Production
Because much of the Elmo coal was mined for local consumption, production figures were not reported to the state coal mine inspectors and thus are incomplete. At a number of mines, as those near Leeds in Chautauqua County and along Roys Creek and the south fork of Wolf Creek in Brown County, much coal was extracted and sold for neighborhood use. From available information it is estimated that a cumulative minimum of 206,273 tons of Elmo coal have been mined. Of this total, 100,000 tons were mined in Brown County, 46,000 tons in Atchison County, 35,273 tons in Chautauqua County, 15,000 tons in Shawnee County, and 10,000 tons in Elk County (Table 11). More detailed information on production in specific counties is presented in the county sections.
Reserves
The proved Elmo coal reserves total 47,560,000 tons. Of this amount 23,160,000 tons or 48 percent are in Brown County. Atchison County has 9,910,000 tons or 20.8 percent of the proved coal reserve. Other counties containing proved Elmo coal reserves are Chautauqua with 5,720,000 tons; Shawnee, 3,950,000 tons; Jackson, 2,800,000 tons; and Elk, 2,020,000 tons. The potential Elmo coal reserves constitute the largest reserves of the entire Wabaunsee coals. It is calculated at 1,515,850,000 tons. Further discussion of proved and potential Elmo coal reserves is found on subsequent pages under the respective counties in which the coal occurs and tonnages of reserves are summarized in Table 11.
Other Wabaunsee Coals
Mined coals
The Nodaway and Elmo coals are the most important commercial coals of the Wabaunsee group. Several other Wabaunsee coals, however, have been mined in the past. These coals, mined principally for local use, include the Cowley County coal in the Willard shale; Blacksmith Creek coal in the Wamego shale, Shawnee County; Nyman coal in the Langdon shale in Lyon County; and Lorton coal in the French Creek shale in Lyon, Greenwood, Pottawatomie, and Wabaunsee counties. All the coals mentioned are of relatively minor importance commercially and each, with the exception of the Lorton coal, has been mined in no more than one county. They are therefore discussed under the county in which the coal has been mined. Table 10 shows the number of each type of mine at which these miscellaneous Wabaunsee coals have been mined.Table 10--Mines in coal beds of the Wabaunsee group, other than Nodaway and Elmo, classified by.county and type
| County | Number of mines | ||||
|---|---|---|---|---|---|
| Shaft | Strip | Drift | Outcrop | Total | |
| Cowley | 1 | 2 | 3 | 6 | |
| Greenwood | 1 | 1 | |||
| Lyon | 5 | 4 | 6 | 15 | |
| Pottawatomie | 1 | 1 | |||
| Shawnee | 1 | 1 | |||
| Wabaunsee | 1 | 1 | |||
| Total | 6 | 7 | 10 | 2 | 25 |
Unmined coals
In addition to the mined Wabaunsee coals, noncommercial coals, for the most part less than 6 inches thick, occur in each of the 14 Wabaunsee shale formations except the White Cloud shale. These coals, because of their noncommercial nature, are not discussed.
Prev Page--History of Mining, Geography || Next Page--Production, Reserves
Kansas Geological Survey, Geology
Placed on web Jan. 27, 2013; originally published December 1946.
Comments to webadmin@kgs.ku.edu
The URL for this page is http://www.kgs.ku.edu/Publications/Bulletins/63/04_coals.html