![]()
Prev Page—Geological Basis || Next Page—Evaluation, References
Geophysical Interpretations and Geological Correlations
Geological Correlations in Different Areas
Regional Survey
Surveys of regional character undertaken in the present investigation consist of magnetic and gravity measurements covering an area of approximately 75 square miles west and southwest of Baxter Springs, Kansas. In general, readings were taken at intervals of approximately 1 mile at, or adjacent to, section-corner road intersections. These regional data are presented as magnetic contours (fig. 9) and gravity contours (fig. 10). The gravity survey was conducted by the Mott-Smith Corporation of Houston, Texas. The magnetic work was conducted by us. A total of 69 gravity stations and 92 magnetic stations were occupied during the course of the regional surveys.
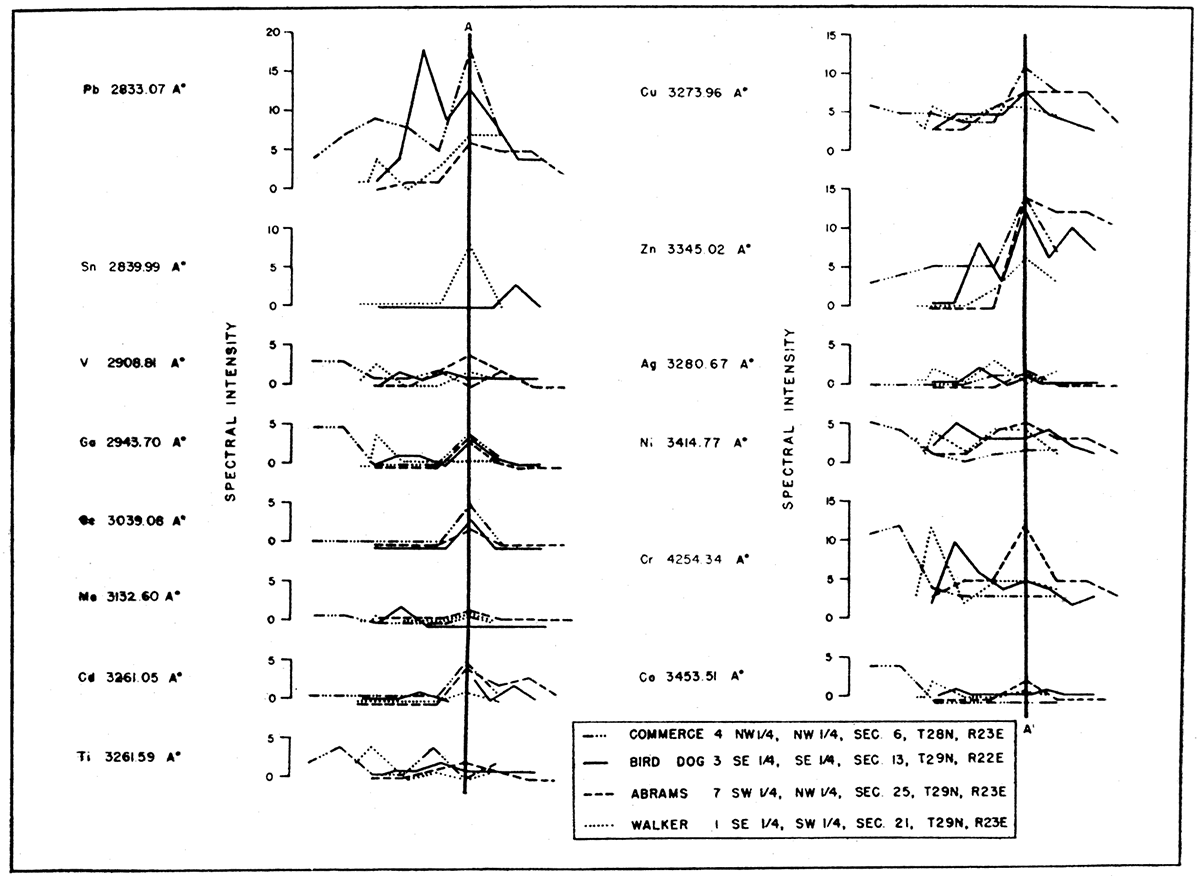
A portion of the geochemical investigations consisted of spectrographic analysis of shale and limestone samples secured from many widely separated exploratory churn drill holes. These studies, therefore, may be said to be of regional character. Results of this work are illustrated in figures 12 to 15.
Figure 12—Geochemical profiles for drill holes showing ore mineralization. A-A' indicates mineralized zone.
Magnetic Survey
It was noted, at several places in this area, that abnormally high or low magnetic readings were sometimes a result of near-surface effects. This was determined in the field by measuring the gradient of change over short horizontal distances at locations where abnormally high readings were obtained. Some parts of the area, such as the Picher mining district, Baxter Springs, and other populated centers, are crossed by intersecting net-works of pipe lines, railroads, and power lines. Parts of these areas also have various kinds of iron and steel structures as well as "tramp" iron left from prior construction. An effort was made to get beyond the range of the local magnetic attractions that would be exerted by these objects. Nevertheless, in view of these conditions and in view of the possible influence of near surface structural and lithologic effects, single-station anomalies are considered to be uncertain. In any event, such anomalies probably do not represent the effect of deep structures.
The magnetic map (fig. 9) reveals the following: (1) a variation of approximately 400 gammas in the area covered; (2) an area of higher magnetic intensities, approximately 100 gammas relief, extending westward from Baxter Springs and lying north, northwest, and northeast of the Picher district; (3) the Picher mining district covered, in part, by a magnetic low; and (4) a well-defined magnetic high of approximately 200 gammas relief, southwest of Baxter Springs, in the area between Quapaw and Hockerville.
The magnetic survey conducted over a much larger area by the Missouri Bureau of Geology and Mines (Grohskopf and Reinoehl, 1933) shows a considerable number of anomalies of greater intensity than the anomaly mapped in this regional work. Although tentative interpretations were suggested by the above authors, no definite geological significance has yet been assigned to the magnetic anomalies; and, accordingly, no program of ore exploration by magnetic methods has been postulated or devised for this district.
Gravity Survey
The gravity map (fig. 10) shows two significant features: (1) a regional gradient with gravity values increasing southward at a rate of approximately 1.0 milligal per mile and (2) a local gravity maximum in the area between Quapaw and Hockerville, east of the main Picher district. This gravity high is about a mile to the south of the location of the previously described magnetic high.
Comparison and Correlation of Magnetic and Gravity Results
Because of the limited area covered and the lack of stratigraphic and structural information at depths below the ore horizons, it is not possible to assign definite geological significance to the magnetic and gravity anomalies. However, the approximate coincidence in location of magnetic and gravity highs in the Quapaw-Hockerville area suggests that these anomalies are the result of a structural or lithologic variation in the basement rocks. Basement structural or lithologic conditions which might account for these anomalies are: (1) a topographic high in the pre-Cambrian surface; (2) an intrusive stock-cutting the Paleozoic sediments; and (3) a lithologic variation in the pre-Cambrian basement, localizing constituents of relatively high density and high magnetic susceptibility (e. g.; basic intrusives or differentiates in the pre-Cambrian granite).
Regional magnetic and gravimetric reconnaissance may be useful in practical exploration for ore districts in this territory if it can be demonstrated by further work that basement structural conditions, such as mentioned above, either constitute the sources of ore mineralization or are directly related to ore occurrence through indirect structural influence on the localization of the deposits. Such relationships cannot be demonstrated by the data now available. A solution of the problem, however, might be derived from a comparison of magnetic and gravity results over a larger area, combined with information secured from deep drilling in a few localities. Such a program would be relatively inexpensive as compared with the cost of "wild-cat" drilling extending outward from the present mining fields.
Geochemical Survey
Shale samples—Samples for geochemical analysis were collected at more or less regular intervals from a number of exploratory drill holes in the Oklahoma-Kansas portion of the district. Samples from 15 of these drill holes (table No. 12) were subjected to spectrographic analysis to determine the distributions and relative concentrations of the elements, vertically, in the formations traversed by the drill hole. The purpose of this investigation was to ascertain whether variations in the metallic content of the Cherokee shale might indicate the presence or absence of ore mineralization in the underlying Mississippian limestone.
Table 12—Drill holes from which shale and limestone samples were obtained. For location of drill holes see table No. 13.
| Name identification | Number identification |
|---|---|
| Walker | 1 |
| Black Eagle | 2 |
| Bird Dog | 3 |
| Commerce | 4 |
| Gordon | 5 |
| Davis | 6 |
| Abrams | 7 |
| Miami | 8 |
| Miami | 9 |
| Wessel | 10 |
| Wessel | 11 |
| Jarrett | 12 |
| Just | 13 |
| Ingram | 14 |
| Weber | 15 |
Samples for the investigation were obtained as follows: (1) from eight drill holes in which high grade zinc and lead mineralization was encountered in the limestone and (2) from seven holes in which no zinc or lead mineralization was encountered. The non-mineralized holes are all beyond the present producing areas.
For comparative purposes, analyses were made of 10 samples of Cherokee shale obtained from oil well drillings in Cherokee, Crawford, and Labette counties, Kansas.
The composition of the Cherokee shale, as determined by the spectrographic analysis, remains nearly constant except for a few elements. Manganese, lead, zinc, cobalt, titanium, potassium, and magnesium are the only elements for which the variations in readings exceed the possible analytical errors (see [previous], and table No. 11). Table No. 13 gives the location of the exploratory drill holes and the average spectral line intensities (relative concentrations) of the elements in the Cherokee shale. The values in this table are arbitrary line intensities and represent only relative quantities.
Table 13—Average spectral line intensities of elements in the Cherokee shale
| Location | No. of samples |
Well No. | Pb | Zn | Mg | Co | Ti | K | Mn |
|---|---|---|---|---|---|---|---|---|---|
| Holes in which ore mineralization is absent | |||||||||
| SE NE sec. 14, T. 28 N., R. 22 E. | 9 | 8 | 2.44 | .55 | 4.89 | 3.89 | 4.33 | 10.33 | 7.77 |
| SE NW sec. 14, T. 28 N., R. 22 E. | 4 | 9 | 2.25 | 1.75 | 4.75 | 4.00 | 4.00 | 10.25 | 7.50 |
| SW sec. 13, T. 28 N., R. 23 E. | No shale | 13 | |||||||
| SW SW sec. 3, T. 27 N., R. 23 E. | No shale | 14 | |||||||
| NE NW sec. 14, T. 28 N., R. 23 E. | 4 | 10 | 2.50 | 1.50 | 4.75 | 3.75 | 4.25 | 10.50 | 8.00 |
| NE NW sec. 14, T. 28 N., R. 23 E. | 4 | 11 | 2.75 | 1.25 | 7.00 | 3.25 | 4.75 | 10.25 | 7.75 |
| NE SW sec. 10, T. 35 S., R. 23 E. | 10 | 12 | 2.40 | .40 | 2.55 | 3.80 | 3.90 | 10.20 | 8.40 |
| Total: Nonmineralized | 31 | 2.45 | .87 | 4.52 | 3.77 | 4.26 | 10.29 | 7.97 | |
| Holes in which ore mineralization is present | |||||||||
| SE SW sec. 21, T. 29 N., R. 23 E. | 7 | 1 | 2.59 | 1.43 | 4.29 | 3.86 | 3.86 | 10.29 | 7.14 |
| NE NW sec. 11, T. 35 S., R. 23 E. | 9 | 2 | 2.89 | 1.22 | 4.22 | 3.20 | 4.00 | 9.44 | 7.33 |
| SE sec. 12, T. 35 S., R. 23 E. | 7 | 15 | 3.00 | .29 | 4.28 | 4.57 | 4.14 | 10.71 | 7.86 |
| SE SE sec. 13. T. 29 N., R. 23 E. | 9 | 3 | 2.44 | .11 | 5.33 | 4.00 | 4.44 | 10.22 | 8.00 |
| SW NW sec. 25, T. 29 N., R. 23 E. | No shale | 7 | |||||||
| NW NW sec. 6, T. 28 N., R. 23 E. | 7 | 4 | 3.28 | 1.71 | 4.28 | 4.00 | 4.14 | 11.29 | 7.71 |
| S SE sec. 18, T. 29 N.,R. 23 E. | 9 | 5 | 3.22 | .33 | 3.33 | 3.89 | 4.33 | 11.44 | 7.55 |
| NE sec. 13, T. 29 N., R. 21 E. | 10 | 6 | 2.60 | 1.00 | 2.70 | 3.82 | 3.60 | 11.20 | 8.40 |
| Total: Mineralized | 58 | 2.85 | .85 | 4.16 | 3.93 | 4.07 | 10.66 | 7.74 | |
| Oil well samples. | 10 | 2.20 | 1.10 | 2.70 | 3.20 | 3.60 | 7.10 | 8.10 | |
These data may be summarized as follows: (1) The total average lead, cobalt, and potassium readings are only slightly higher in the mineralized holes than in the non-mineralized holes. (2) The total average readings for magnesium, titanium, and manganese are slightly higher in the non-mineralized holes than in the mineralized ones. (3) The average zinc readings are practically the same in both cases. (4) The samples from the Tri-State district show a higher concentration of magnesium, cobalt, lead, potassium, and titanium than do the samples from the oil well drillings and lower concentrations of zinc and manganese. (5) The average indicated differences in concentrations are much less than the possible analytical errors.
A comparison of averages from individual drill holes shows that the relative concentrations of lead; zinc, magnesium, cobalt, titanium, potassium, or manganese in the Cherokee shale do not indicate the presence or absence of mineralization in the underlying limestone. For example, the indicated average lead content of the shale in mineralized. holes is 2.85 and in the non-mineralized holes it is 2.45, but the maximum for the non-mineralized holes is 2.44. Similar results are indicated by com.paring the maximum and minimum results for the other six elements.
Although the average readings do not show significant differences between the mineralized holes and the non-mineralized holes, it should be noted that the five samples which have valid concentrations of lead are from holes showing mineralization (fig. 14). This relationship is not true for any of the other elements.
Limestone samples—Figure 12 shows geochemical profiles for four drill holes which encountered ore mineralization. These profiles show the relative concentrations of the elements, vertically, in the formation traversed by these holes. The samples used in these studies were taken from the limestone at 30 to 40 feet intervals. In plotting these values the lead and zinc mineralized zone, as determined by assays (A-A', in fig. 12), was used as a reference datum. As shown by these profiles, the content of lead, zinc, copper, cadmium, and germanium is a maximum in the mineralized zone, indicating that these five elements were introduced by the mineralizing solutions. The presence of a relatively large amount of tin in the mineralized zone of the Walker hole (1, fig. 12) indicates that tin was present in some of the solutions. Gallium, molybdenum, nickel, and cobalt generally give maximum readings at the top of the limestone, drop off to a minimum, and then rise again slightly in the mineralized zone. The Abrams hole (7, fig. 12) does not show maximum readings at the top of the limestone. This hole, however, does not have a shale cover. The titanium content tends to be a minimum in the mineralized zone. Silver, chromium, and vanadium do not show any' correlation with the mineralized zone.
Figure 13 shows geochemical profiles for a group of drill holes where no ore mineralization was encountered. Tin, germanium, silver, and cadmium were not detected in samples from these holes. Molybdenum and cobalt were detected in only one sample, and that was from just below the shale in the Wessel hole (11, fig. 13). Zinc and lead are present in small concentrations in a few samples. Copper, nickel, and chromium show close correlation with one another in the holes which do not show ore mineralization, and are present in concentrations as large as in the mineralized holes.
Figure 13—Geochemical profiles for non-mineralized drill holes.
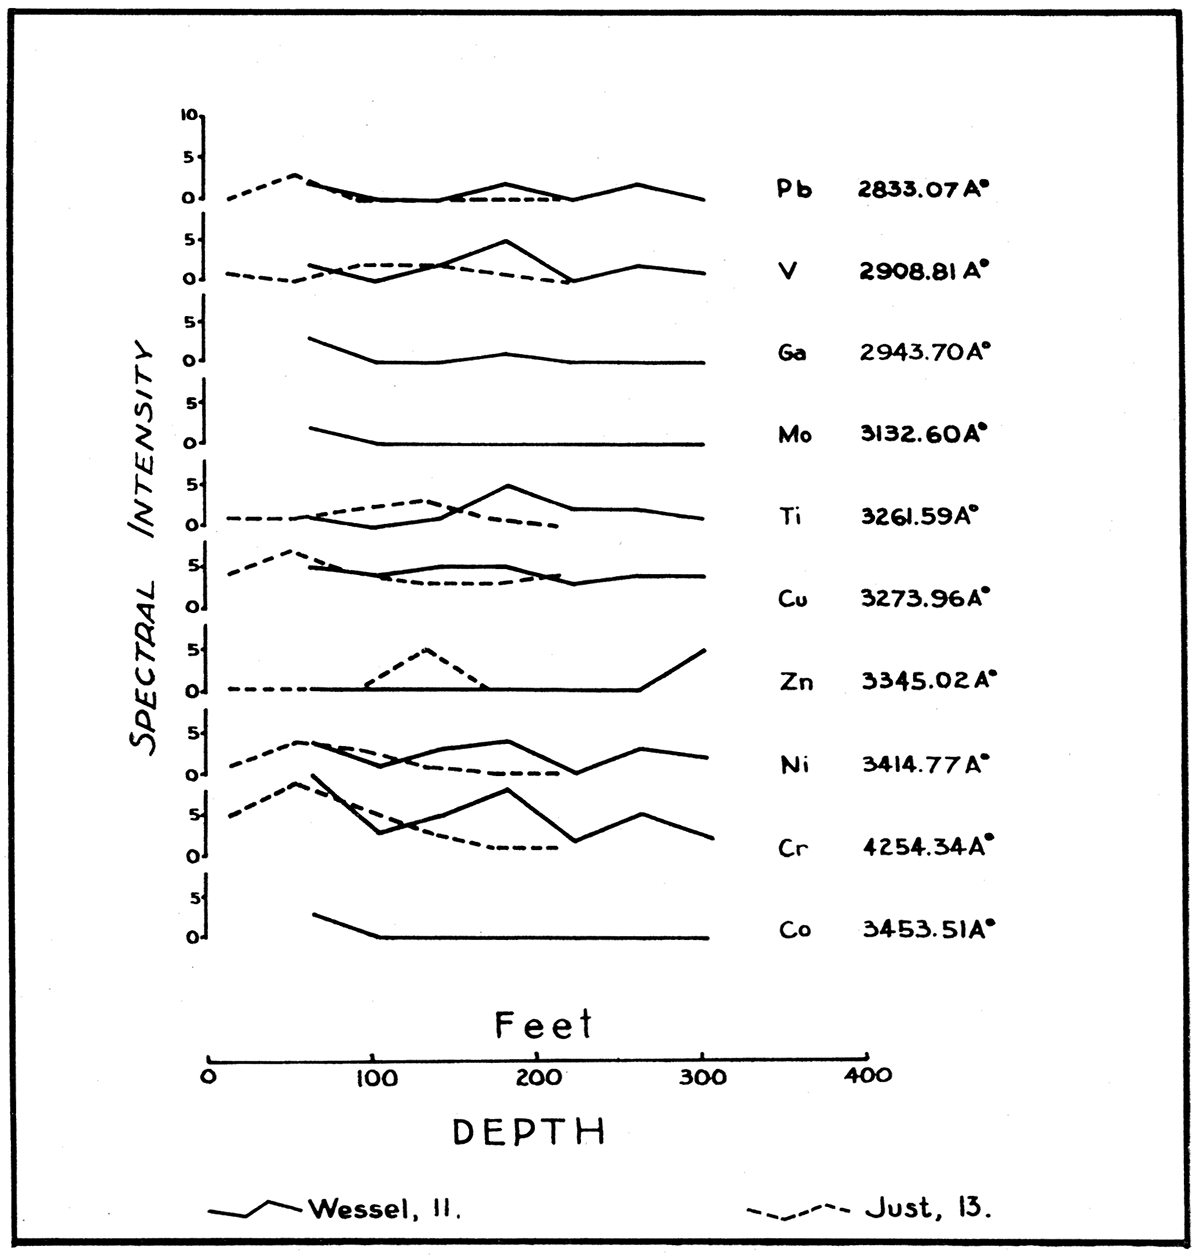
Lead, zinc, copper, cadmium, germanium, and tin are present in the mineralized zones in concentrations greater than in the shale or limestone and, therefore, must have been introduced by the mineralizing solutions. Some gallium, molybdenum, nickel, and cobalt may have been introduced, but the concentrations in the mineralized zones are lower than the maximum concentrations in the limestone.
A group of samples was taken from the Ingram well (14, table 13), which penetrated to the Cotter dolomite (Ordovician). The results of the analyses at this location may be stated as follows: Nearly all of the elements show increased concentrations in the Chattanooga shale. Vanadium, gallium, nickel, chromium, and cobalt generally give higher readings in shale than in limestone. The lead and molybdenum values are higher in the Chattanooga shale than in the Cherokee shale. The Ordovician dolomites show a slightly higher lead, zinc, tin, and molybdenum content than does the Mississippian limestone.
Shale and limestone samples—Figures 14 and 20 show profiles of the vertical distribution of lead and zinc concentrations respectively, in the shale and limestone. Figure 1 shows location of drill holes from which samples were taken. Two of the wells in Oklahoma (6 and 14) do not appear in the area shown in figure 1. The profiles plotted from the Cherokee shale samples give no indication as to the grade of mineralization which might be encountered in, the limestone, but in some cases the lead and zinc content of the first 50 feet of limestone is indicative of the presence or absence of ore mineralization near by.
Figure 14—Vertical distribution of lead in drill holes. For location of drill holes see table 13, p. 86
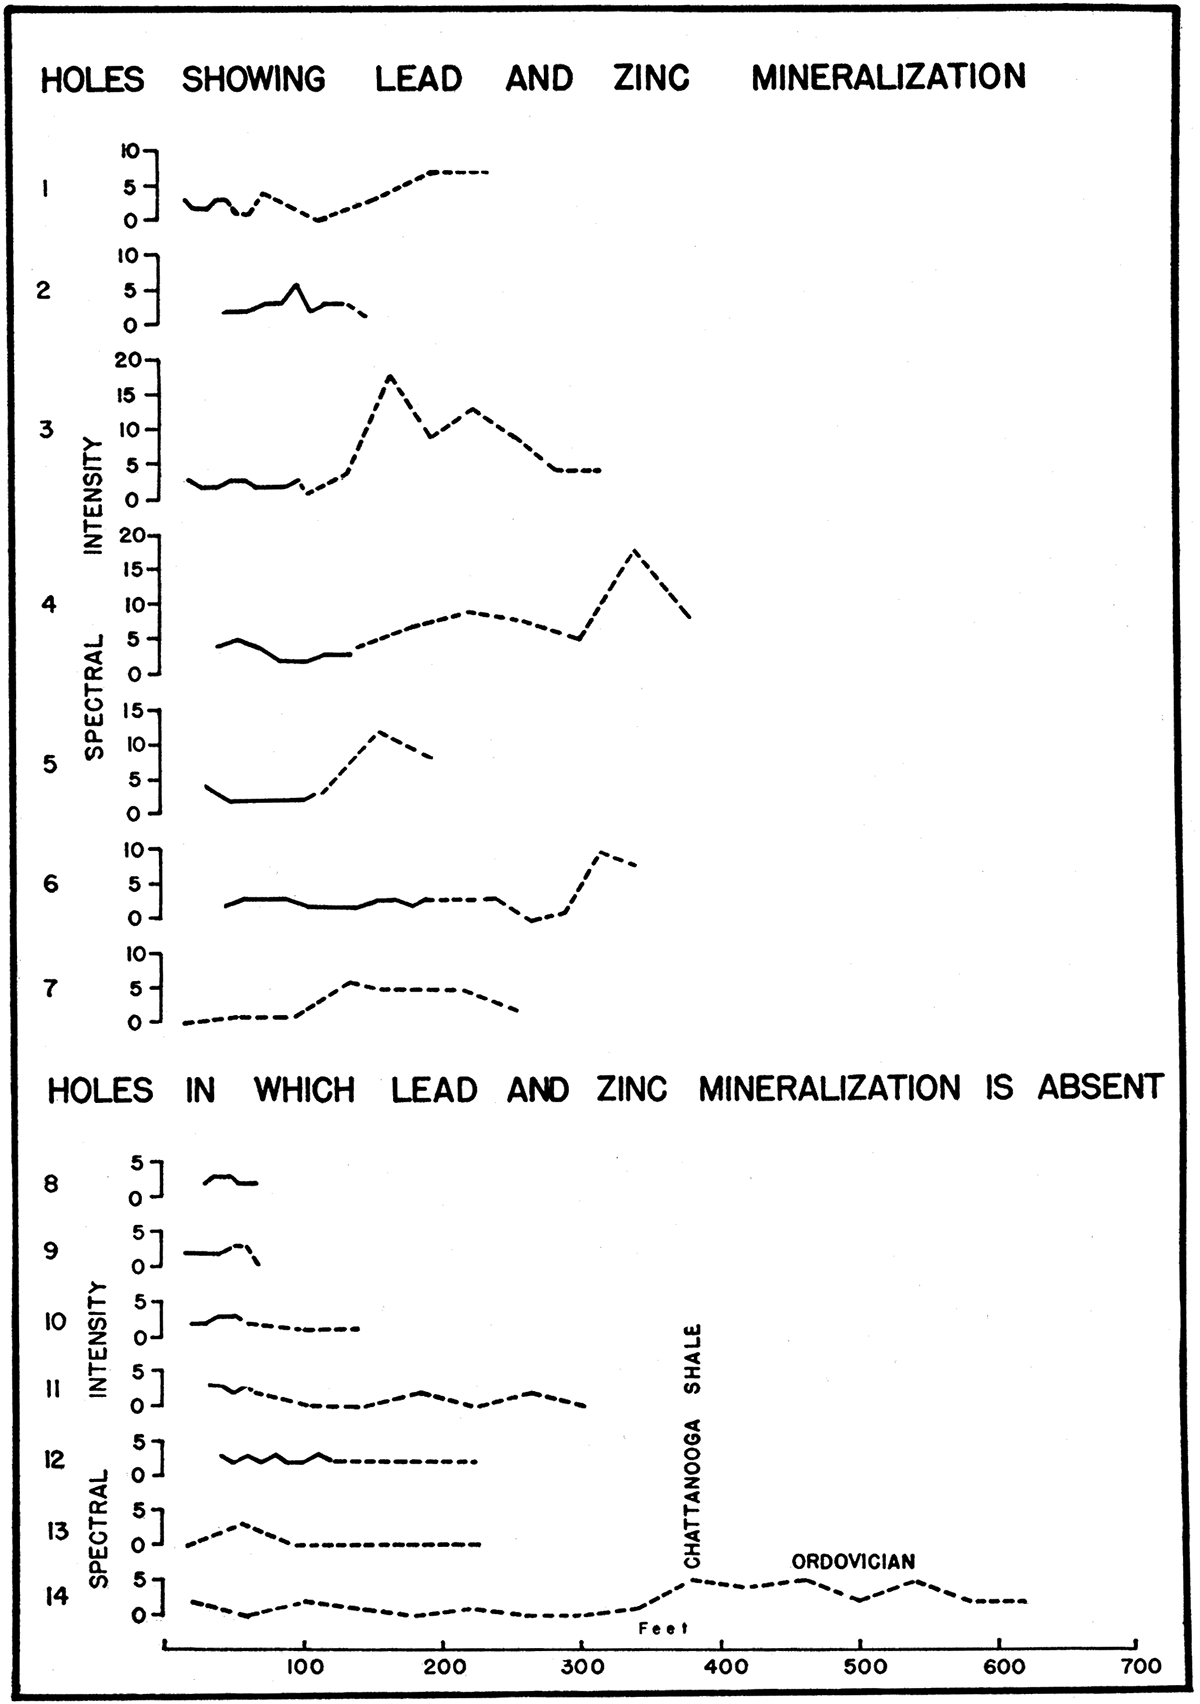
Profiles for magnesium were plotted also. These show the degree of dolomitization of the limestone but do not indicate that any correlation exists between magnesium content and ore mineralization. The highest values for magnesium were obtained from the Ordovician dolomites in the Ingram water well located in the SW SW sec. 3, T. 27 N., R. 23 E.
Neutral Area
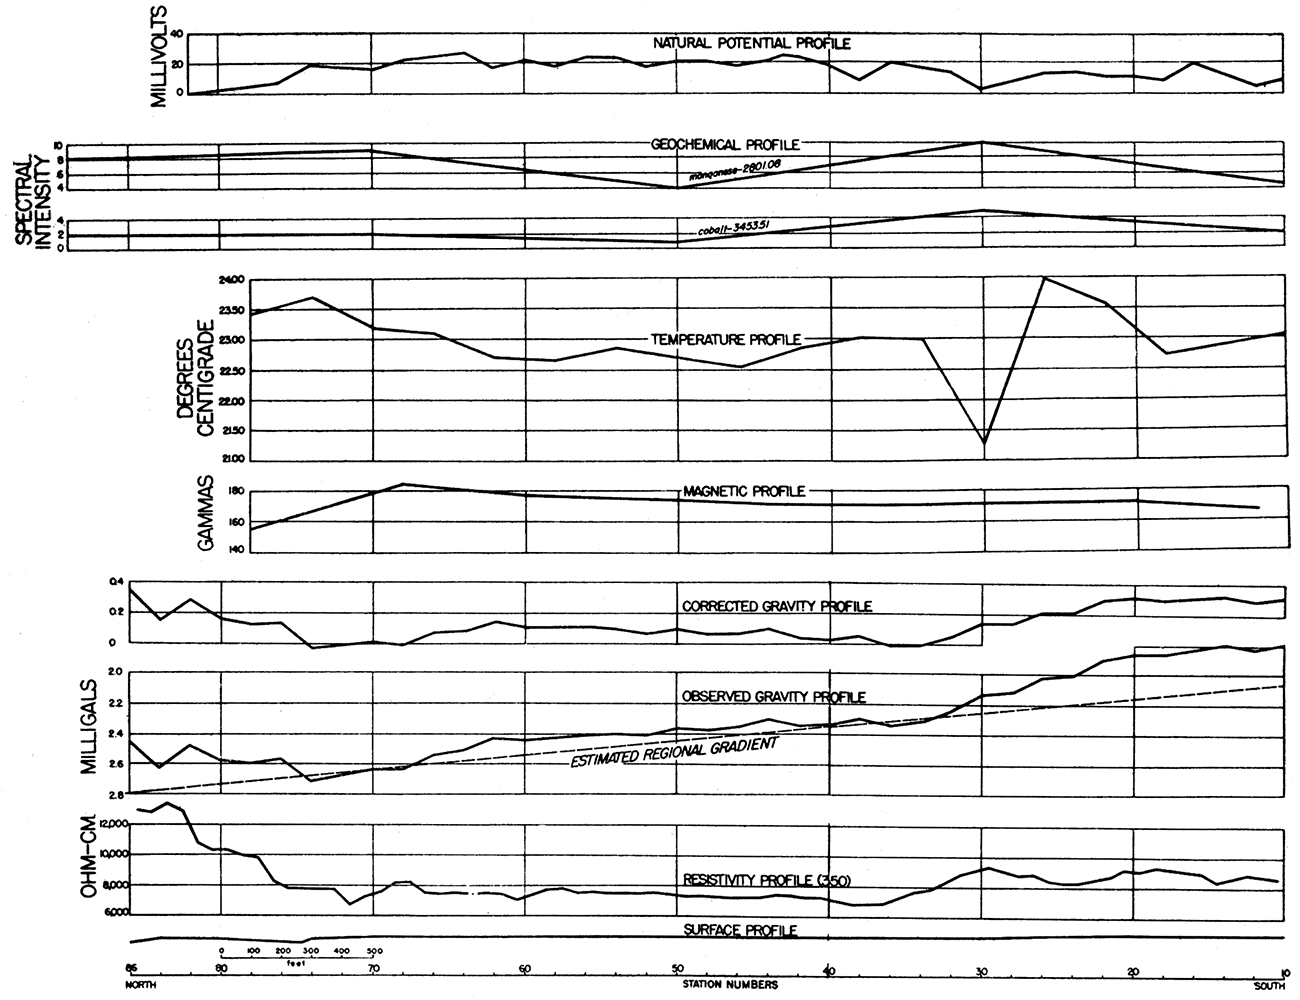
The geophysical data in the Neutral area were all obtained along a single traverse. The following geophysical measurements were made: magnetic, at 400 foot intervals; gravity, at 100 foot intervals; natural potential, at 500 foot intervals; resistivity longitudinal traverse, at 50 foot intervals; resistivity depth measurements, at stations 20 and 50; geothermal measurements, at 100 foot intervals; geochemical soil samples, at stations 10, 30, 50, 70, and 90. The geophysical data are plotted as profiles along the traverse (fig. 16). The resistivity depth curves are shown in figure 17.
Figure 16—Profiles along a traverse in the Neutral area, showing magnetic, gravity, natural potential, resistivity, geothermal, and geochemical anomalies.
Magnetic Survey
The magnetic gradient between stations 12 and 68 is exceptionally uniform, increasing northward at a rate of 30 gammas per mile. Between stations 68 and 78 the vertical magnetic intensity decreases 30 gammas in a distance of 500 feet, a much more rapid variation than on the southern portion of the traverse.
Gravity Survey
The gravity variation is more clearly observed after correcting for regional gradient. A zone of relatively low gravity values occurs between stations 34 and 74. South and north of these stations the gravity values increase at an average gradient, over and above regional gradient, of approximately 0.35 milligal in a distance of 600 feet. The small lateral range of these changes in gravity suggests that they primarily reflect the influence of shallow structure.
Natural Potential Survey
The total range of the natural potential readings is approximately 30 millivolts. It is estimated that the calculated values are subject to a probable error of ±2 millivolts, due, chiefly, to: (1) fluctuation in the natural potentials and (2) uncertainty of the diurnal correction. A zone of relatively high potential, i. e., +polarity relative to zones of relatively low potential, extends between stations 34 and 74. Lower potentials are present on both north and south ends of the traverse.
Resistivity Survey
Profile—A resistivity low (7,000 to 8,000 ohm-cms.) extends between stations 36 and 76. Higher values are present on the north (13,000 ohm-cms.) and south (9,000 ohm-cms.) ends of traverse.
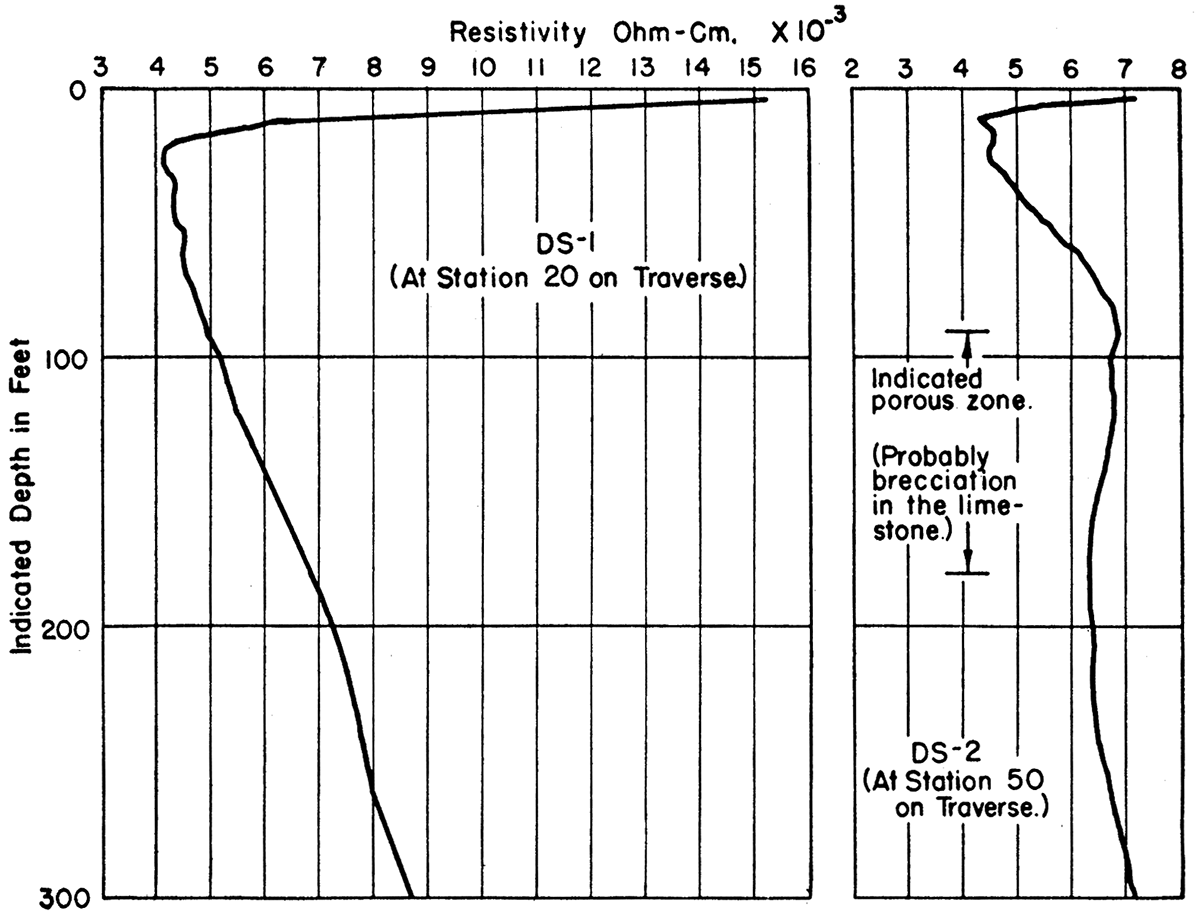
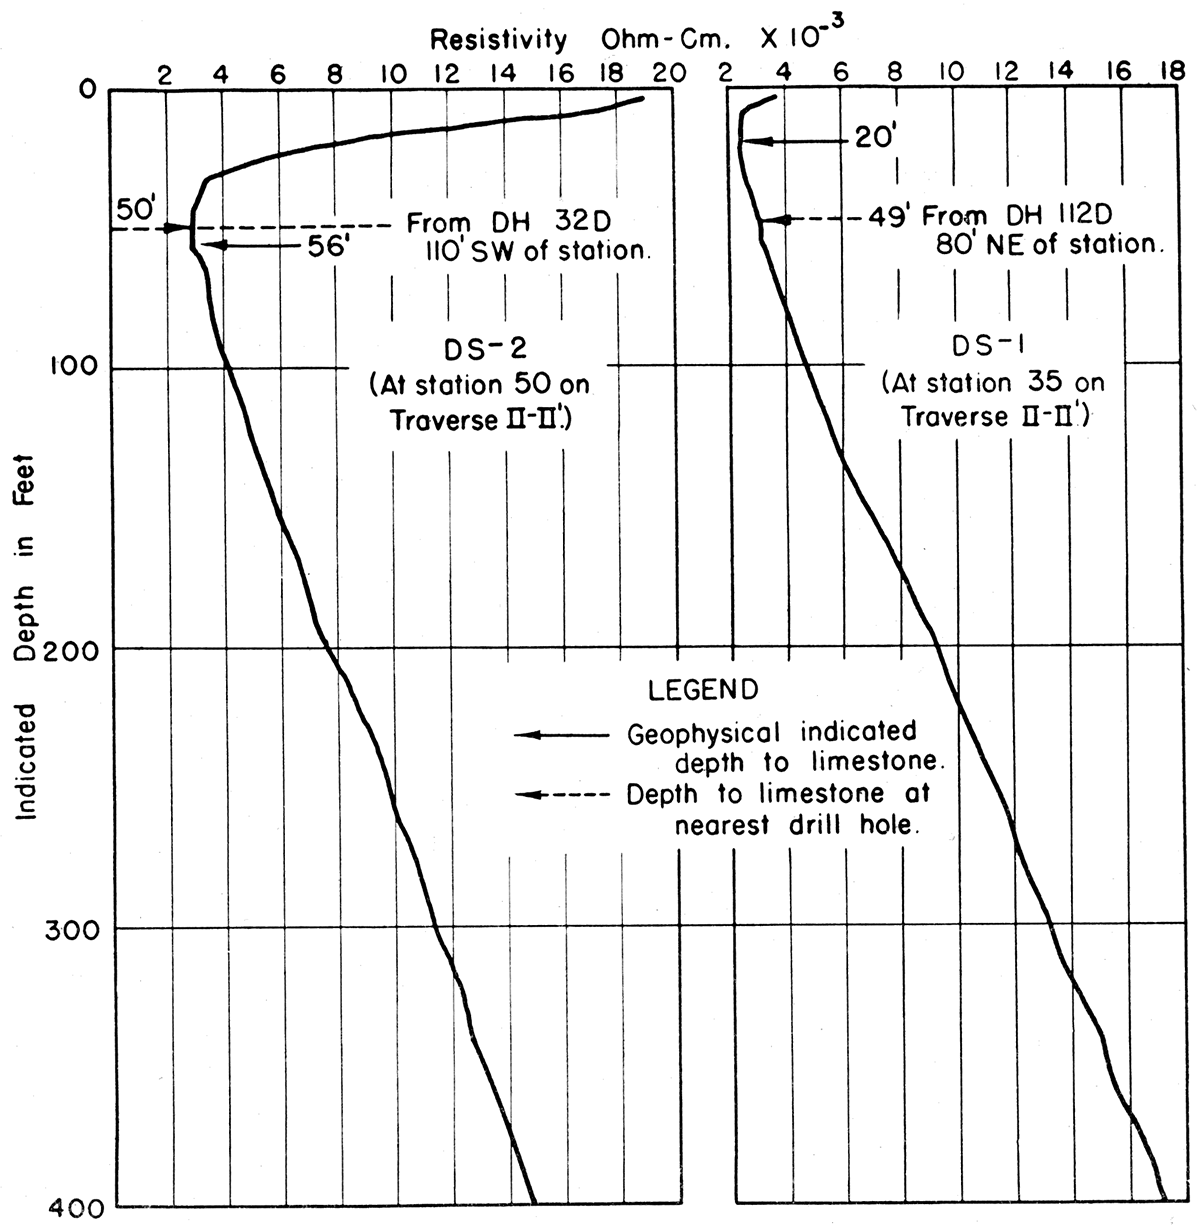
Depth stations—Depth readings were made to determine the variation of resistivity with depth below the above-mentioned zones of high and low resistivity shown by the resistivity profile. It was hoped that this work might contribute information as to the subsurface structure responsible for the profile anomalies. One station (DS-2) was placed in the center (station 50) of the low resistivity trend, and the other (DS-1) was placed over the high resistivity trend (station 20) at the southern end of the traverse. Comparison of the curves plotted from the depth readings shows a marked difference in electrical characteristics at the two locations below a depth of approximately 100 feet, a well-defined decrease in resistivity occurring below this depth, at station DS-2.
No subsurface geologic information is available along the line of these electrical measurements. For this reason, an interpretation of the structural implications of the effects observed on the resistivity depth curves can only be postulated on a basis of what is known of the general geology in this area (see [previous]). On this basis, it is believed that the decrease in resistivity below a depth of 100 feet at station DS-2 indicates a more porous zone, possibly associated with slumpage or cavernous conditions in the limestone under the central part of the traverse.
Figure 17—Resistivity depth profiles in the Neutral area.
Geothermal Survey
The temperature profile shows a zone of relatively low temperature along the central portion of the traverse between stations 46 and 62.
Geochemical Survey
Only five soil samples were taken along the traverse. Analysis, of these indicated relatively lower cobalt and manganese content in the soil station 50 in the center of the traverse.
Conclusions
The various geophysical data obtained in the area show a degree of mutual correlation that is notable, considering the difference in the methods and the physical parameters measured. The most prominent, and probably most significant, example is the close resemblance of the resistivity and gravity profiles over the entire length of the traverse, and, in particular, the coincidence of resistivity and gravity lows over the central part of the traverse. In lesser degree, however, the other data, with the exception of the magnetic, show somewhat comparable anomalies as shown in the following tabulation:
- Resistivity: "low" between stations 36 to 76
- Gravity: "low" between stations 34 to 74
- Natural potential: "high" between stations 34 to 74
- Geothermal: "low" between stations 46 to 62
- Geochemical: "low" at station 50
The resistivity measurements (profile and depth curves) were made to a maximum depth of approximately 350 feet. The resistivity anomalies, therefore, are due to comparatively shallow structural conditions, the most prominent of which are probably: (1) variations in depth to the shale-limestone boundary, (2) changes in the lithology and porosity of the shale and upper portions of the limestone, and (3) variations in amount, content, and distribution of ground water.
The similarity of the various profiles indicates that all of the geophysical anomalies in the Neutral area are due to the effects of shallow geologic factors. It is probable that a structural trough or slumped zone with probable brecciation in the shale and limestone beds lies under the central part of the traverse. Such a structure would account for the various geophysical anomalies observed in this area. This postulated trough or slumped zone is probably a tributary of the Miami trough.
The geophysical results in the Neutral area are significant, chiefly because: (1) They indicate the type and magnitude of anomalies that may be found in areas that are devoid of ore mineralization. (2) They provide a measure of control in evaluating the influence of structure in the anomalies found subsequently in the mineralized areas, and (3) they indicate that anomalies in several types of geophysical measurements may be caused by relatively shallow geologic conditions in this district.
Mullen Area
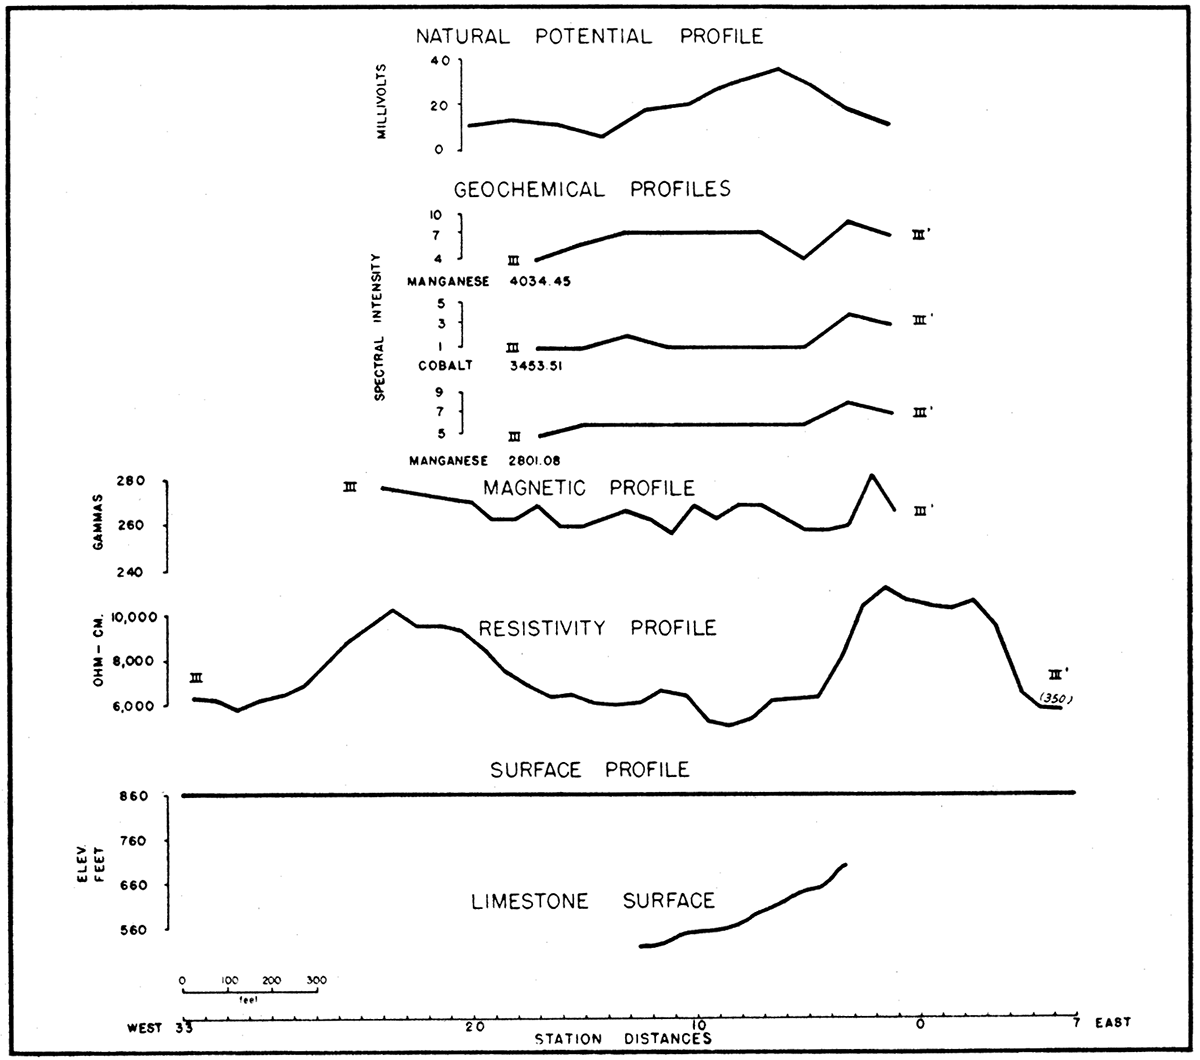
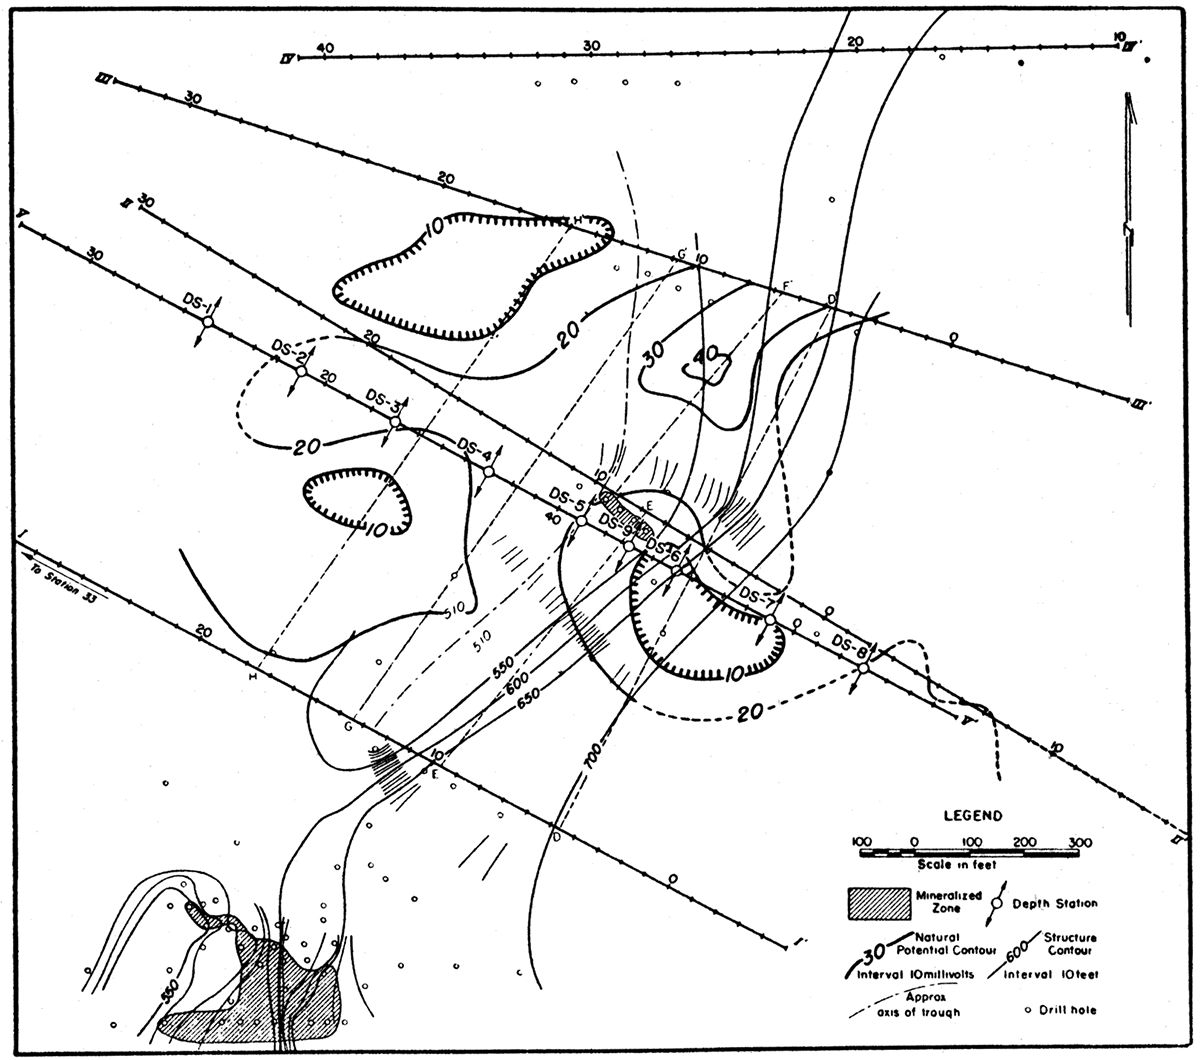
The locations of the various geophysical traverses and stations in the Mullen area are shown in figure 2. The following geophysical measurements were made: magnetic, at intervals of 50 to 100 feet along traverses I-I' and II-II'; natural potential, at approximately 100 foot intervals on a grid extending over the structural trough between traverses I-I' and III-III' and along traverse II-II', extending from the grid; resistivity longitudinal traverses, at intervals of 50 feet along traverses I-I', II-II', III-III', and IV-IV'; resistivity transverse traverse, with line of centers at 50-foot intervals along traverse V-V'; resistivity depth measurements, at stations DS-1 to DS-9, all located on traverse V-V' (fig. 2); geothermal, at 100- and 150-foot intervals along traverses I-I' and II-II'; geochemical, soil samples at intervals of 100 and 200 feet along traverses I-I', II-II', and III-III'.
Profiles and contour maps illustrating representative portions of the geophysical data and results for this area are shown in figures 18 to 22.
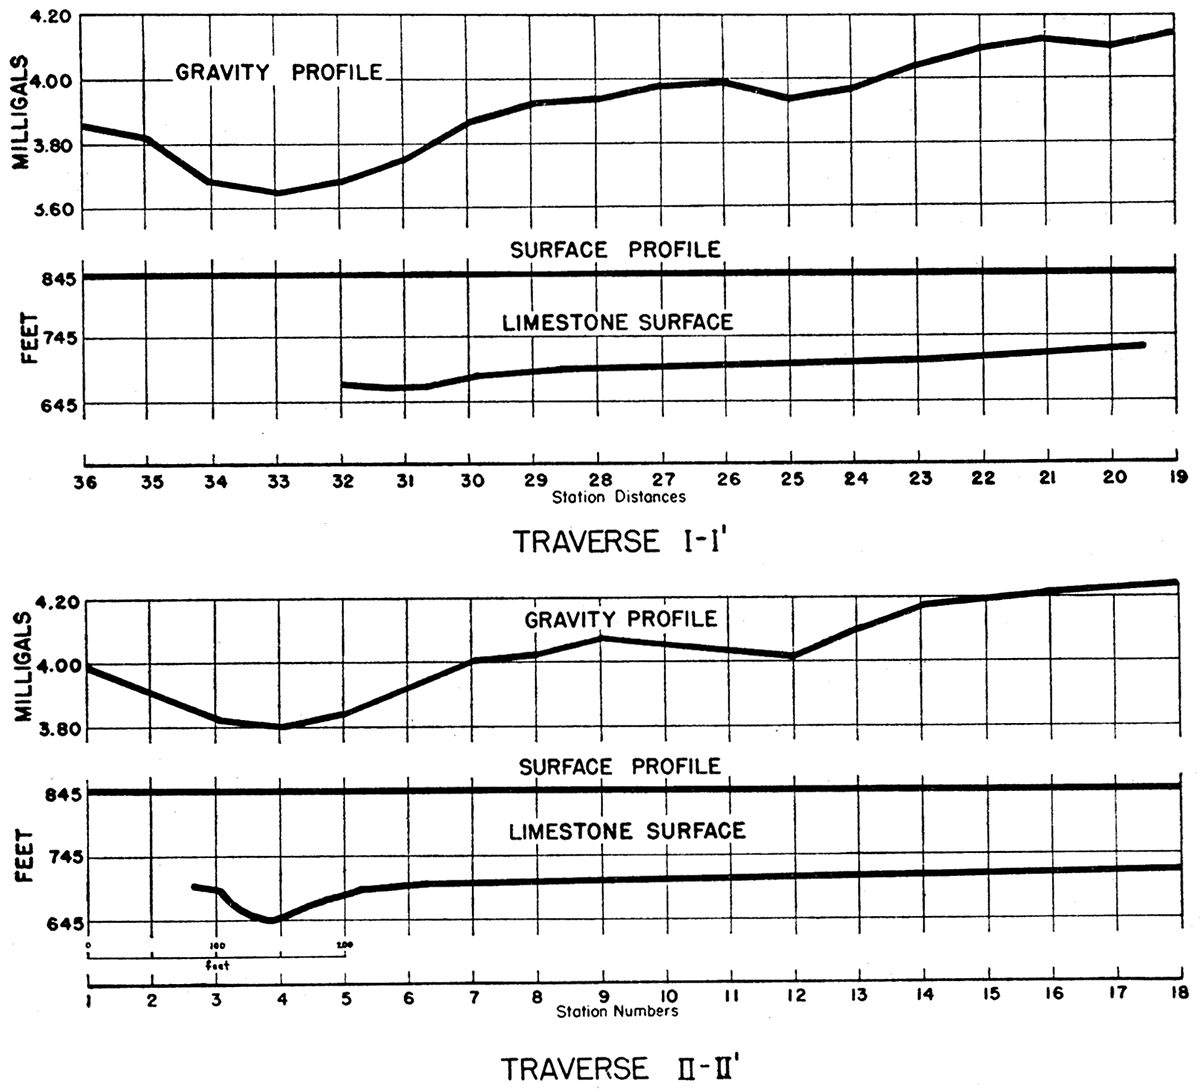
Figure 18—Profiles along traverse I-I' in the Mullen area, showing magnetic, gravity, natural potential, resistivity, geothermal, and geochemical anomalies, and configuration of the top of the limestone.
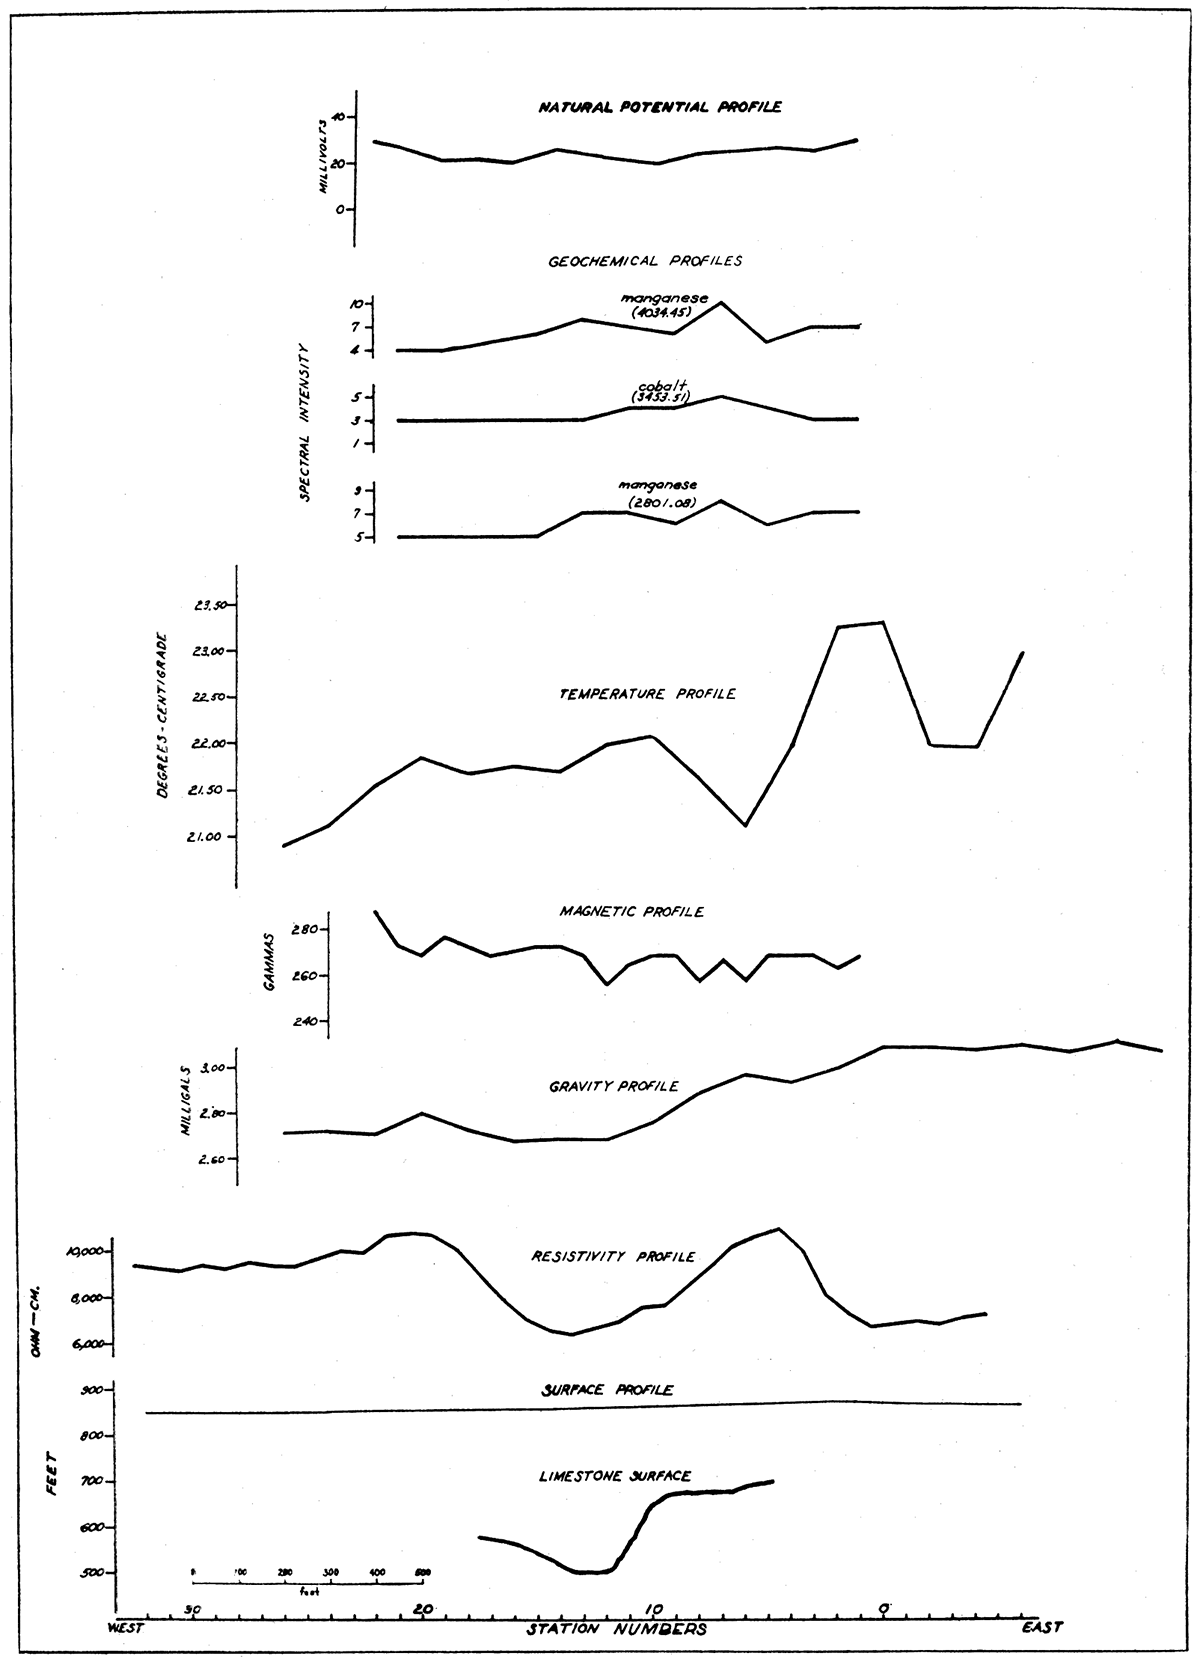
Figure 19—Profiles along traverse II-II' in the Mullen area, showing magnetic, gravity, natural potential, resistivity, geothermal, and geochemical anomalies, and configuration of the top of the limestone.
Figure 20—Profiles along traverse III-III' in the Mullen area, showing magnetic, natural potential, resistivity, and geochemical anomalies, and configuration of the top of the limestone.
Magnetic Survey
The magnetic readings in this area are erratic, in the sense that variations in values from station to station impart a "saw-tooth" character to the profiles (compare with uniform magnetic values in the Neutral area, fig. 16). These variations are probably due to near surface magnetic variations in the formations underlying this area.
All three magnetic profiles across this area show slightly lower magnetic values in the general vicinity of the Miami trough. The trends, however, are so uncertain and general and the profile values so erratic that the only conclusion that is warranted is that magnetic work is of doubtful value for determination of local structure in this area.
Gravity Survey
The gravity profiles along traverses I-I' and II-II' show very similar variations: (1) high values to the east, (2) central gravity minima in the vicinity of the Miami trough, and (3) slightly higher gravity values west of the trough. On traverse I-I' the gravity minimum extends from station 12 to 16 and closely coincides with the position of the bottom of the trough as indicated by drilling. On traverse II-II' the gravity minimum extends from station 10 to 16, indicating that the bottom of the trough at this location is probably broader and farther to the west than is indicated by drill hole information. The steeper, dipping eastern flank of the trough is well shown by the higher gravity gradients over this portion of the structure.
Natural Potential Survey
The three natural potential profiles (traverses I-I', II-II', and III-III') show markedly different trends, although all cross the Miami trough at similar orientations. Profile I-I' shows a slight potential low. However, this is not confined to the subsurface limits of the trough as defined by drill holes, nor is there any apparent influence of the known asymmetry of the trough. Profile II-II', on the other hand, shows a broad potential high over the portion of the area overlying the Miami trough. Profile III-III' shows low potentials between stations 14 and 20, somewhat west of the indicated bottom of the trough. The reversal in trend at station 6 does not conform to the trend of the limestone surface which continues to rise eastward from this location.
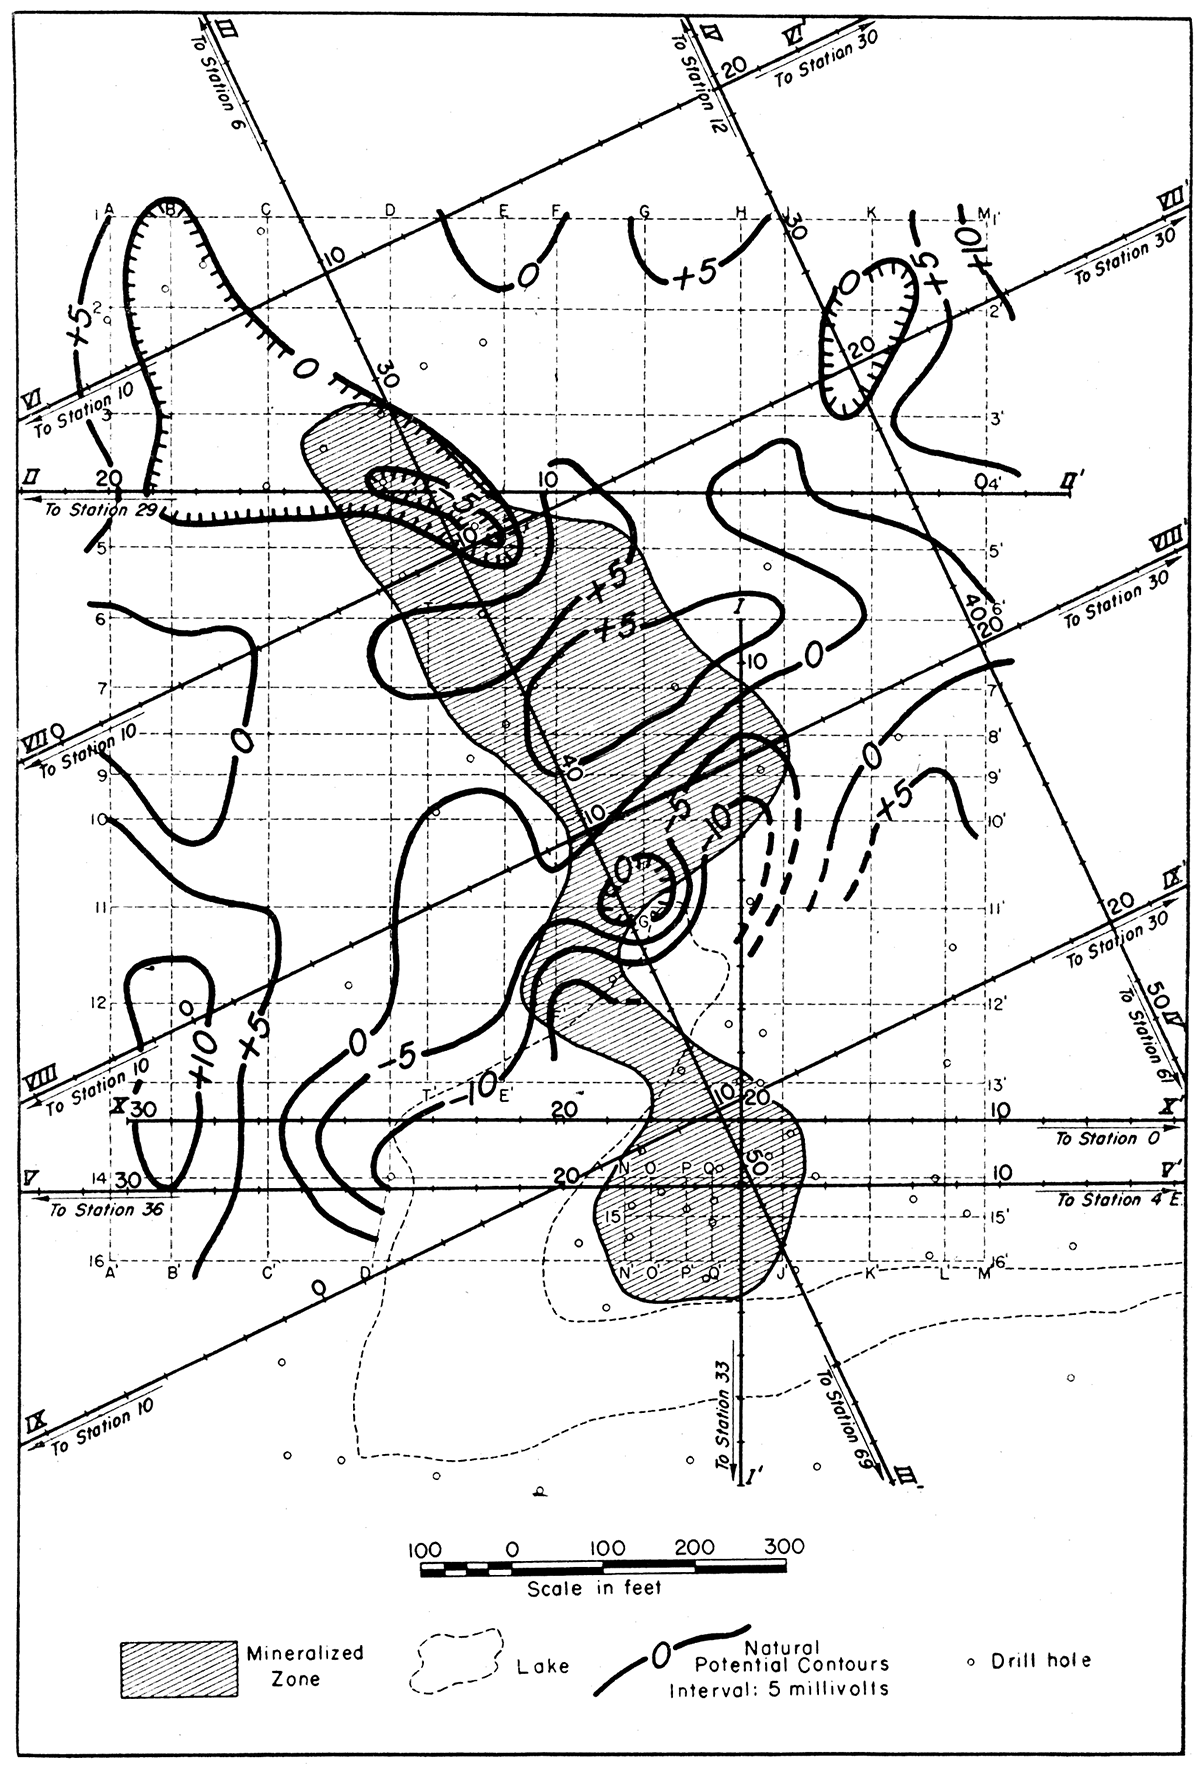
The distribution of the natural potential values, as outlined above, shows no relation to the profiles of the limestone surface, nor do they show a negative center over the small zone of zinc mineralization indicated at the center of the area (between traverses II and V). Negative centers are indicated at three locations (fig. 21), but available geologic information is insufficient to account for these anomalies. They may be due to near surface concentrations of oxidizing iron dissulphides or to a non-uniform distribution of electrolytic solutions. Any effects of the major structure of the trough or of the mineralized zone are clearly over-shadowed by these more shallow electrolytic or oxidation effects.
Figure 21—Map showing natural potential contours in the Mullen area.
Resistivity Survey
Profiles—The resistivity profiles (longitudinal type) along traverses I-I', II-II', III-III', and IV-IV' (figs. 18-20) are similar, with two significant features on all of them: (1) the well-defined resistivity low, occurring where the traverses cross the Miami trough and (2) the sharp maxima over the edges of the trough. These results indicate that the water-saturated, brecciated material within the trough is a better electrical conductor than the adjacent limestone. The sharp maxima over the edges of the trough are the result of a "short circuiting" of the electrical current between power and potential electrodes as the advancing line of electrodes extends over the conductive trough. (See "Factors Influencing Interpretation.")
The lowest value on profile I-I' falls between stations 13 and 14. This is in good agreement with the drill hole data. On profile II-II' the resistivity low extends between stations 11 to 14 with a gradual increase in values to the west. This indicates that the trough is broader and the bottom somewhat farther west than indicated by drill hole data. (Compare gravity profile II-II', fig. 19.) Profile III-III' (fig. 20) shows a resistivity low over the trough, but it is ambiguous, especially on the east side, where apparently a near-surface conductor (possibly pyrite) has caused the superimposition of a "W" effect on the profile (apparent resistivity peaks at Stations 2-3 west and 11-12 east). If this effect is discounted, the low, normally due to the trough structure, will fall at about station 13-14 which is in accord with drill hole data. On traverse IV-IV' a broad resistivity low is present with the lowest value at stations 26-27, indicating that this location marks the approximate position of the bottom of the trough.
The transverse type traverse (traverse V-V') produced results dificult to interpret. The resistivity variations found on this traverse cannot be correlated with the position of the trough under the central part of the traverse. If the trough were straight and extended in a known direction some distance beyond the electrode spread, and if it were uniform in width and depth, this type of traverse could be expected to produce a marked resistivity low over the center of the trough. In the present case the actual conditions do not sufficiently approximate the ideal to produce interpretable data. The resistivity variations along this traverse are probably the effect of lateral variations in structure or lithology spanned by different parts of the electrode configuration as it progressed across the area.
Depth stations—The depth curves at stations DS-1, DS-2, DS-3, DS-4, DS-5, and DS-9 (fig. 22) are similar and show a characteristic trend change that can be traced through this set of curves. This change is probably the influence of the shale-limestone boundary; although this cannot be definitely confirmed, in' view of the absence of drill hole information in this part of the area. The depth curves DS-6, DS-7, and DS-8 are similar also, but the resistivity trends exhibited by them are different from the characteristic trends of the curves on the west end of the traverse. This difference in the curves is due, apparently, to the influence of a highly resistant outcropping sandstone on the east end of the traverse. Curves DS-6, DS-7, and DS-8 are similar to the curves obtained in areas of relatively shallow limestone (e. g., resistivity depth measurements in the Greenback area). Because of this difference in curve character, it is not possible to make a direct correlation between the two groups of curves. Figure 22 shows the resistivity depth correlations and the indicated structural profile along traverse V-V'.
Figure 22—Resistivity depth profiles and indicated structure in the Mullen area.
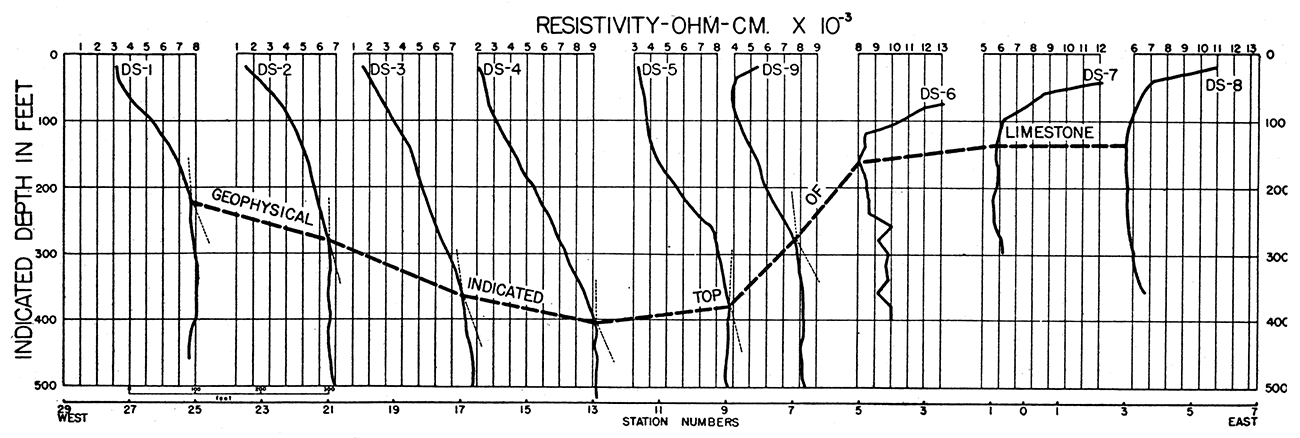
From these results the conclusion seems warranted that under favorable conditions the top of the limestone can be mapped by resistivity depth measurements. In this connection, it is of interest to note that the geophysical interpretation indicates the low point in the trough to be near station DS-4, some 150 to 200 feet farther west than indicated by drill hole information. As mentioned previously, both the gravity and the resistivity profiles along traverse II-II' also indicate a more westward location of the bottom of the trough (fig. 19).
Geothermal Survey
The two temperature profiles along traverses I-I' and II-II' (figs. 18,19) are quite dissimilar in trends, although the structure is essentially the same under the two traverses. Profile II-II' shows a general conformity to the limestone profile and to the other geophysical data along this traverse, with low temperature values recorded over the trough. There is no indication that the presence of ore mineralization extending between stations 7 and 10 has influenced the temperature readings. Profile I-I', however, shows no relation whatever to the trough structure, and the recorded values apparently are influenced primarily by effects at, or near, the surface of the ground.
Most of the high values measured on the east ends of these traverses are in an area where sandstone crops out at the surface. Some of the low readings, as at station 24 on profile II-II' and station 26 on profile I-I', coincide with the location of surface drainage courses. This is not true, however, of other apparently anomalous lows on these traverses.
Geochemical Survey
Spectrographic analysis of the soils in the Mullen area showed only cobalt, manganese, and gallium to be present in amounts exceeding the analytical error of the measurements.
The distribution and relative concentrations of cobalt and manganese in the soil along traverses I-I', II-II', and III-III' in the Mullen area are shown in profiles on figures 18, 19, and 20.
In general, the variation in cobalt and manganese content appears to be similar for each traverse. There is an apparent correlation between the cobalt highs occurring between stations 4 and 12 on traverse I-I', between stations 4 and 9 on traverse II-II', between stations 0 and 4 on traverse III-III', and, to a lesser extent, between manganese highs in approximately the same locations. These cobalt and manganese variations, however, have no apparent relationship either to subsurface structure or to mineralization. The areas of higher relative concentration on the three traverses lie over the steep eastern flank and edge of the trough, adjacent a gentle ridge formed by out-cropping sandstone beds. No explanation for these variations is offered at the present time.
Jarrett Area
The locations of the two gravity-meter traverses in the Jarrett area are shown on figure 3, which also shows the configuration of the top of the limestone. Gravity profiles along the two traverses are shown on figure 23.
Figure 23—Profiles along traverse I-I' and II-II' in the Jarrett area, showing gravity anomalies and configuration of the top of the limestone.
The profiles are practically identical in character of gravity variations along the two traverses. The gravity values, however, are uniformly higher along profile II-II' by an average of about 0.10 milligals. Considering the close spacing of the traverses (230 feet) this represents a north-south gradient about twice that estimated for the district as a whole (1.0 milligal per mile—see "Regional Survey").
This increased gradient is probably due to local structure. A reasonable explanation is afforded by the presence of a relatively sharp structural low north of traverse I-I'.
Comparison of the gravity profiles with the profile of the top of the limestone indicates that the gravity values are directly related to shallow structure. The most pronounced features on the gravity profiles are the gravity minima near the west ends of the traverses. These agree closely in location with an indicated structural low. This depression in the limestone plus probably related zones of brecciation are believed to be responsible for the gravity minima. It is to be observed, also, that the eastward increasing gravity values appear to be directly related to the trend of the limestone surface along the two traverses.
A comparison of the gravity-meter results with the prior torsion balance work conducted by P. W. George (1928) over this area shows close agreement. Inverse gradients (contour distances) computed from the torsion balance gradients were compared directly to the plotted gravity-meter values.
Walton Area
The locations of the various geophysical traverses and stations in the Walton area are shown in figure 4. The geophysical measurements are described as follows: magnetic, 135 stations on the grid layout and 5 stations on the eastward extension of the grid line 16; gravity, 128 stations on grid layout and extensions of traverses I-I', II-II', and V-V'; natural potential, 105 stations, covering a portion of the grid layout; resistivity longitudinal traverses at intervals of 50 feet along traverses I-I', II-II', III-III', IV-IV', V-V', VII-VII', and VIII-VIII'; resistivity transverse traverses, with lines of centers at 50 foot intervals, along traverses V-V', VI-VI', VII-VII', VIII-VIII', IX-IX', and X-X'; resistivity depth measurements at stations DS-1 to DS-8 (fig. 14) ; geothermal, 127 stations on grid layout and extensions of traverses I-I', II-II', and V-V'; geochemical soil samples, 149 stations on the grid layout and traverse extensions.
Profile and contour maps illustrating representative portions of the geophysical data and results for this area are shown in figures 24 to 36.
Figure 24—Profiles along traverse III-III' in the Walton area, showing magnetic, gravity, natural potential, resistivity (longitudinal), and geothermal anomalies, zone of mineralization, and configuration of the top of the limestone.
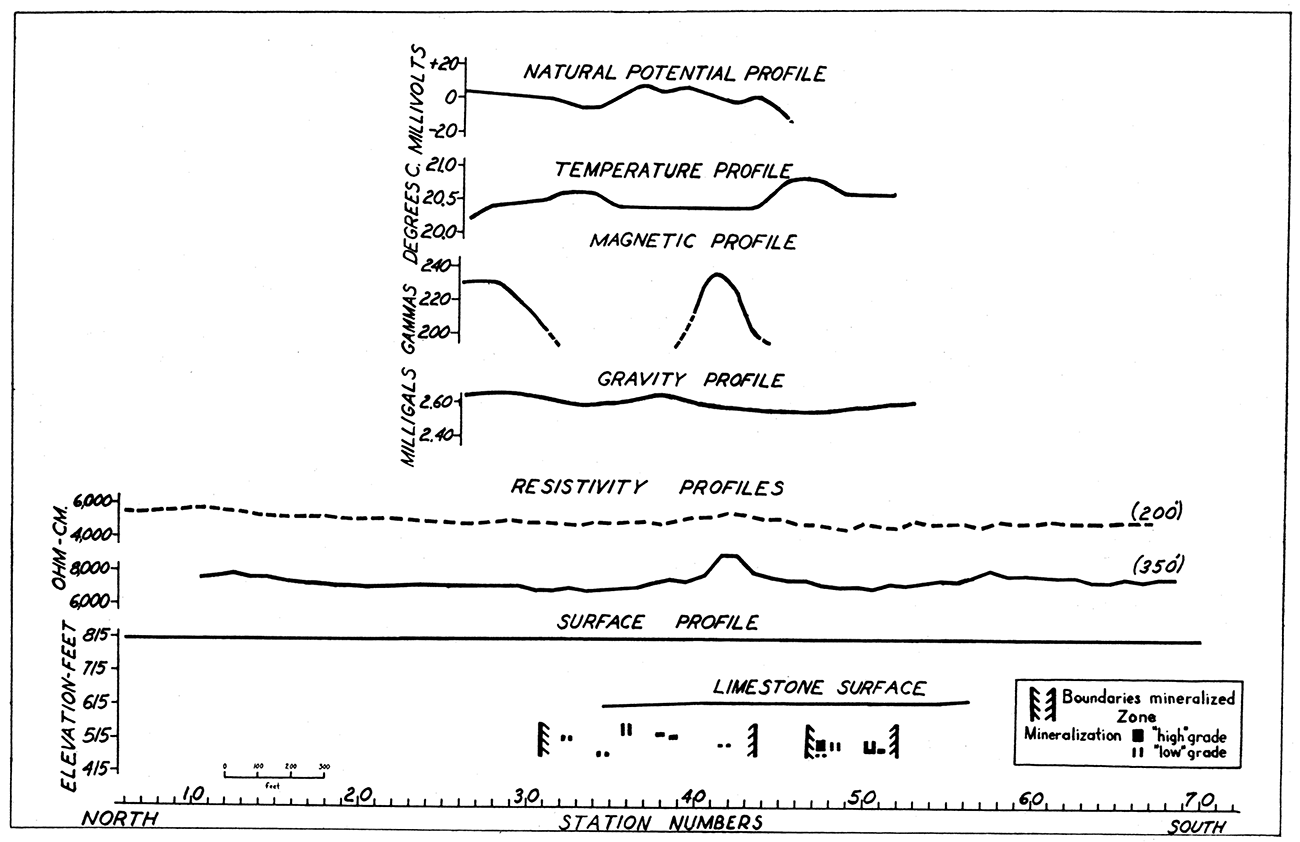
Figure 25—Profiles along traverse IV-IV' in the Walton area, showing resistivity (longitudinal) anomalies and top of limestone.
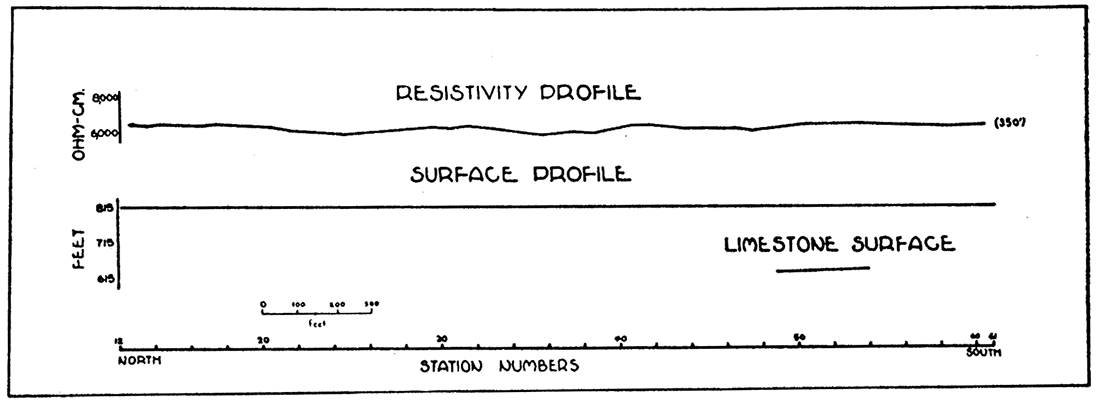
Figure 26—Profiles along traverse V-V' in the Walton area, showing magnetic, gravity, resistivity (longitudinal and transverse), and geothermal anomalies, zone of mineralization, and configuration of the top of the limestone.
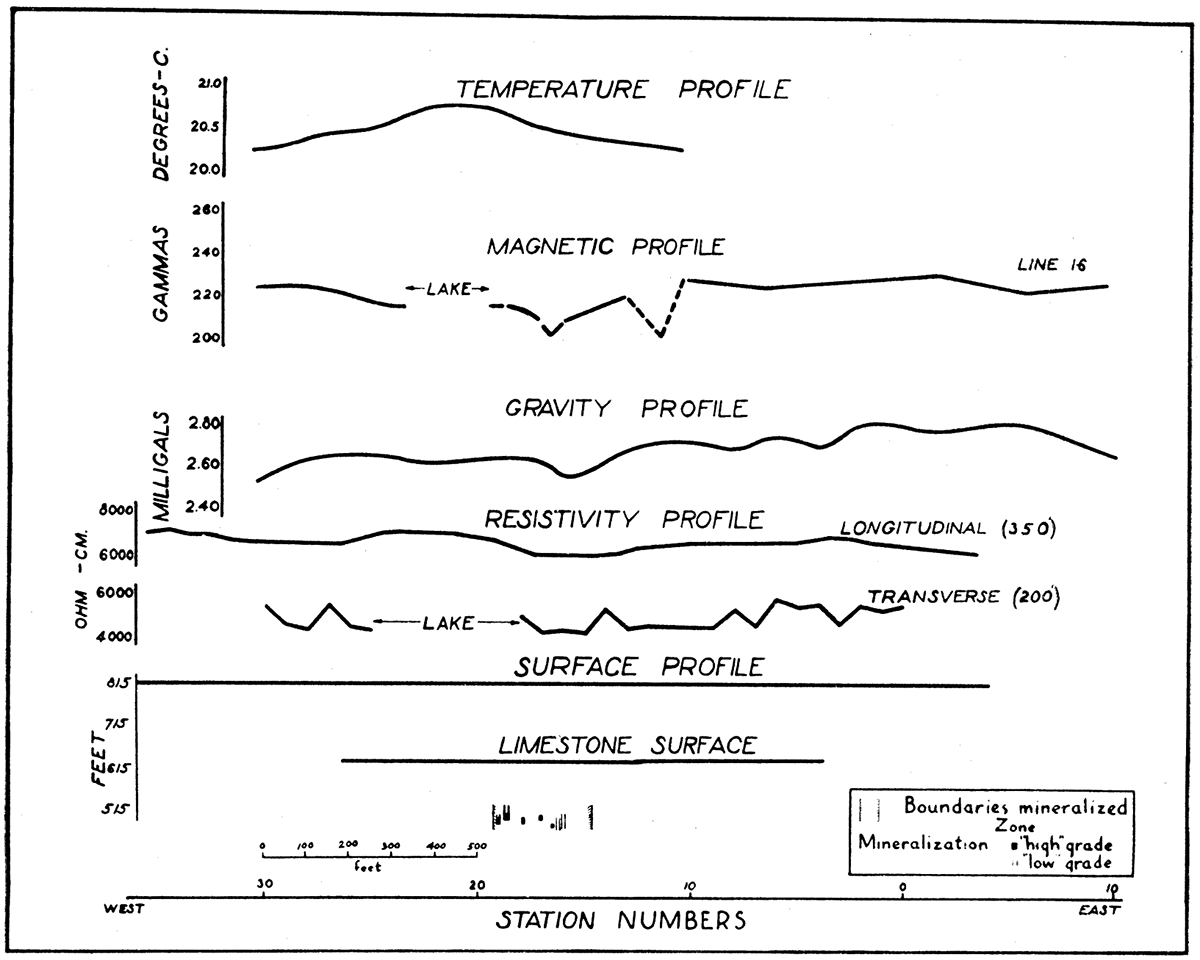
Figure 27—Profiles along traverse VII-VII' in the Walton area, showing magnetic gravity, natural potential, resistivity (longitudinal and transverse), and geothermal anomalies, zone of mineralization, and top of the limestone.
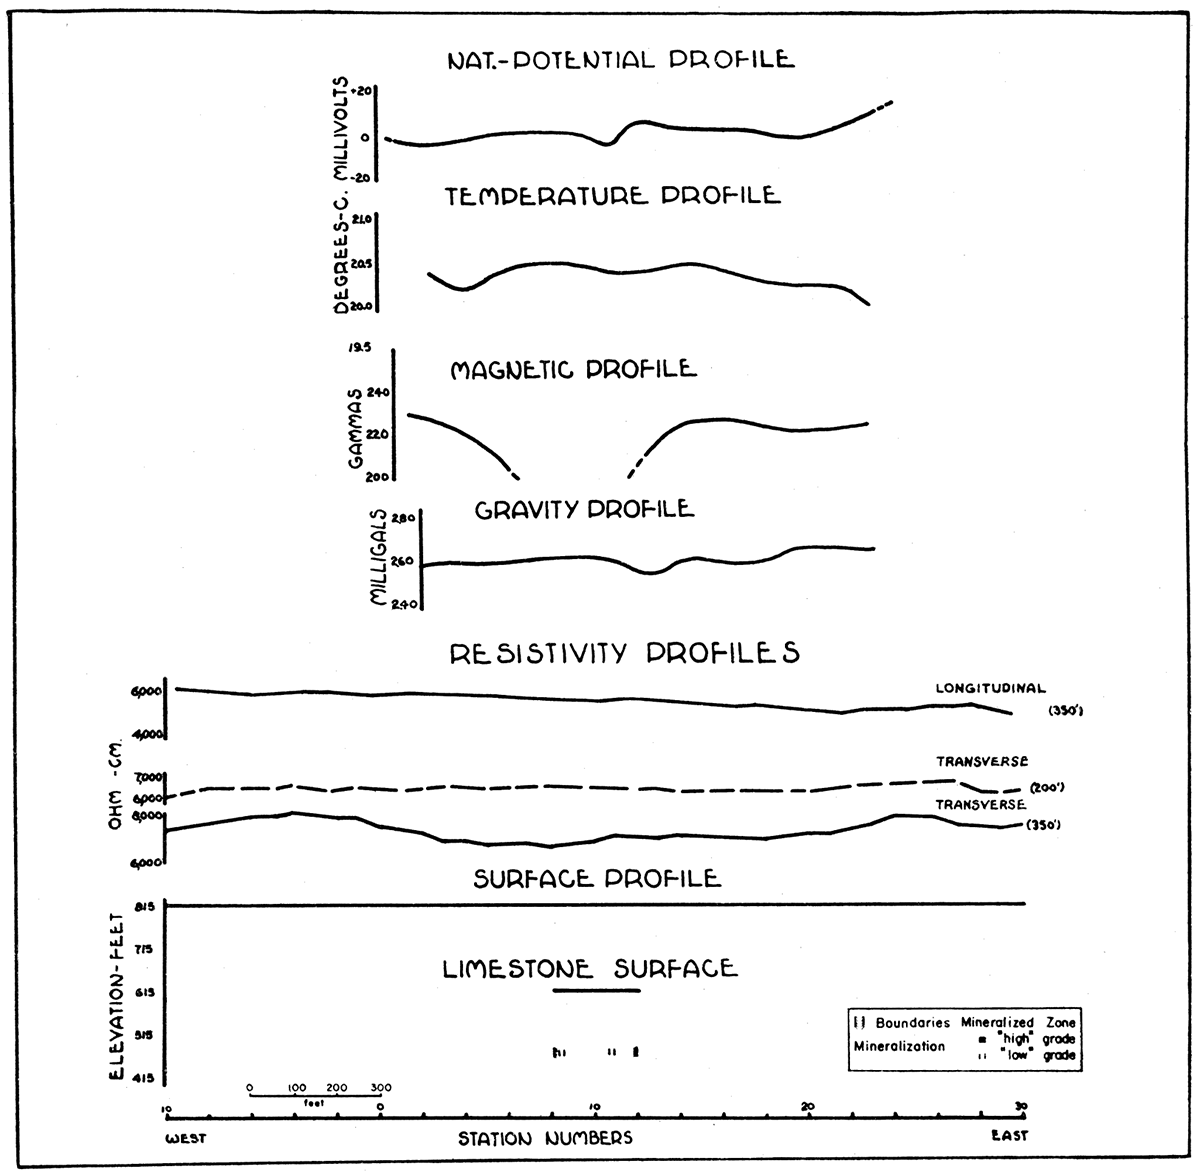
Figure 28—Profiles along traverse VIII-VIII' in the Walton area, showing magnetic, gravity, natural potential, resistivity (longitudinal and transverse), and geothermal anomalies, zone of mineralization, and configuration of the top of the limestone.
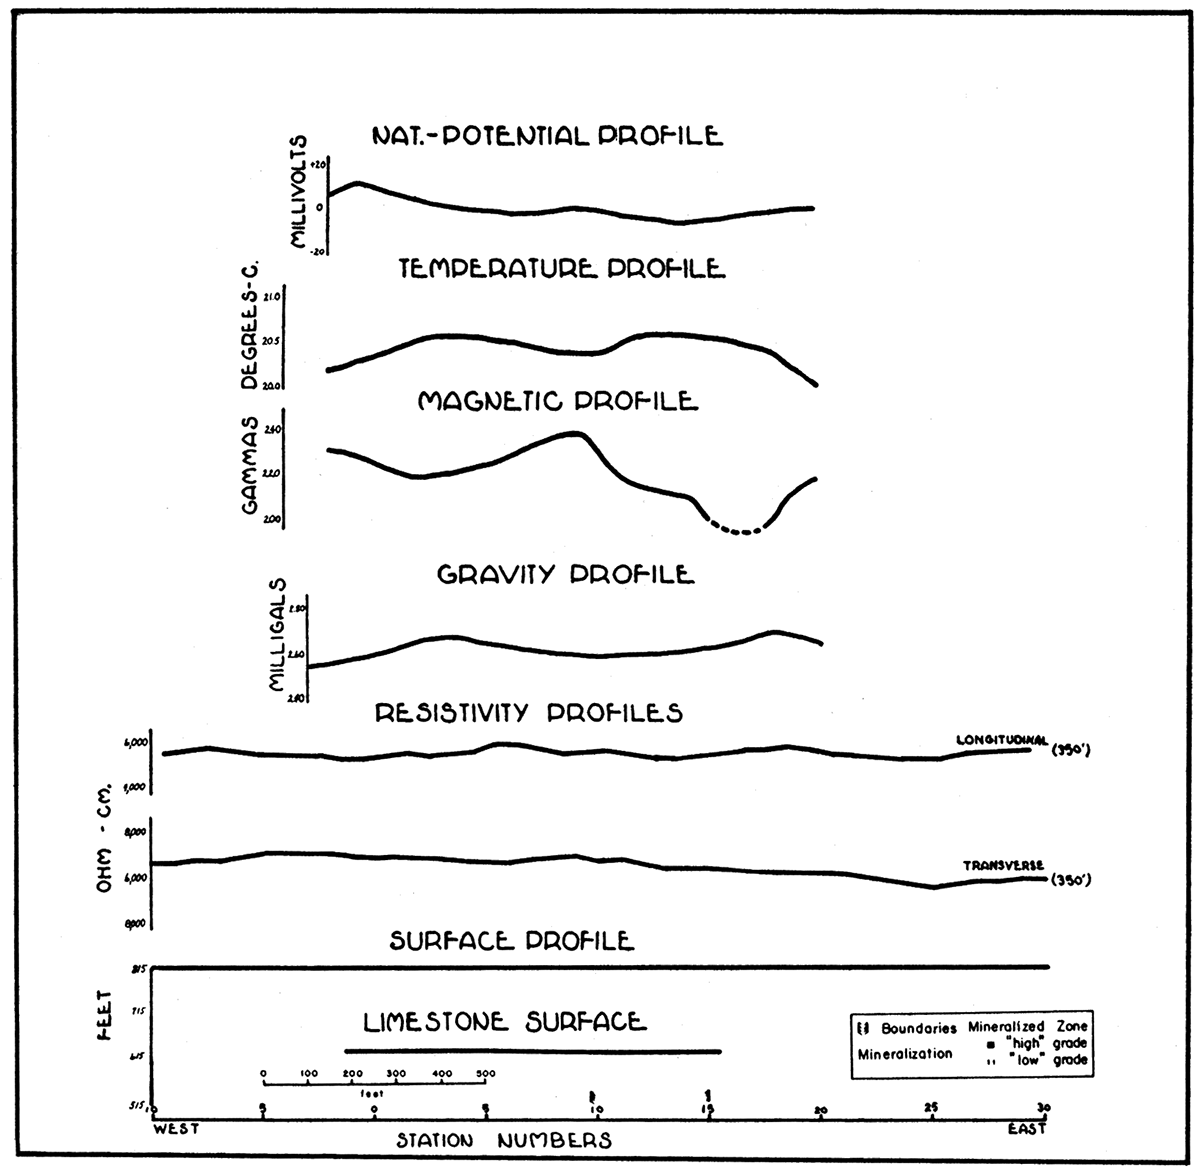
Figure 29—Profiles along traverse IX-IX' in the Walton area, showing gravity, resistivity (transverse), and geothermal anomalies, zone of mineralization, and configuration of the top of the limestone.
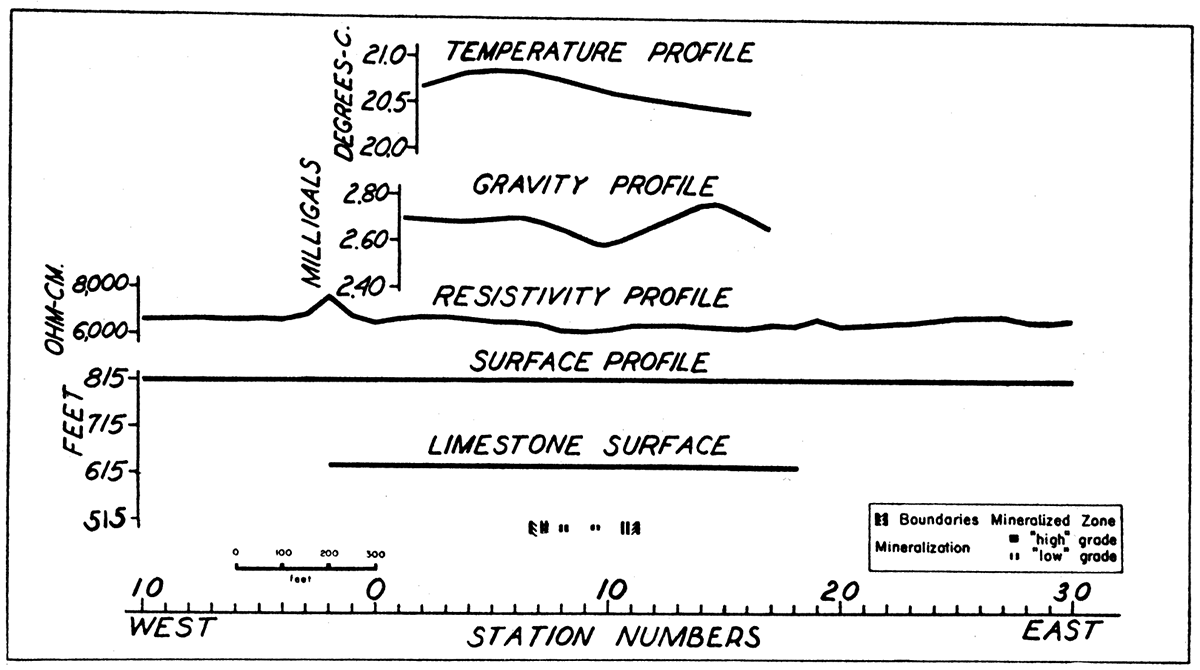
Figure 30—Profiles along traverse X-X' in the Walton area, showing gravity and resistivity (transverse) anomalies, zone of mineralization, and configuration of the top of the limestone.
Magnetic Survey
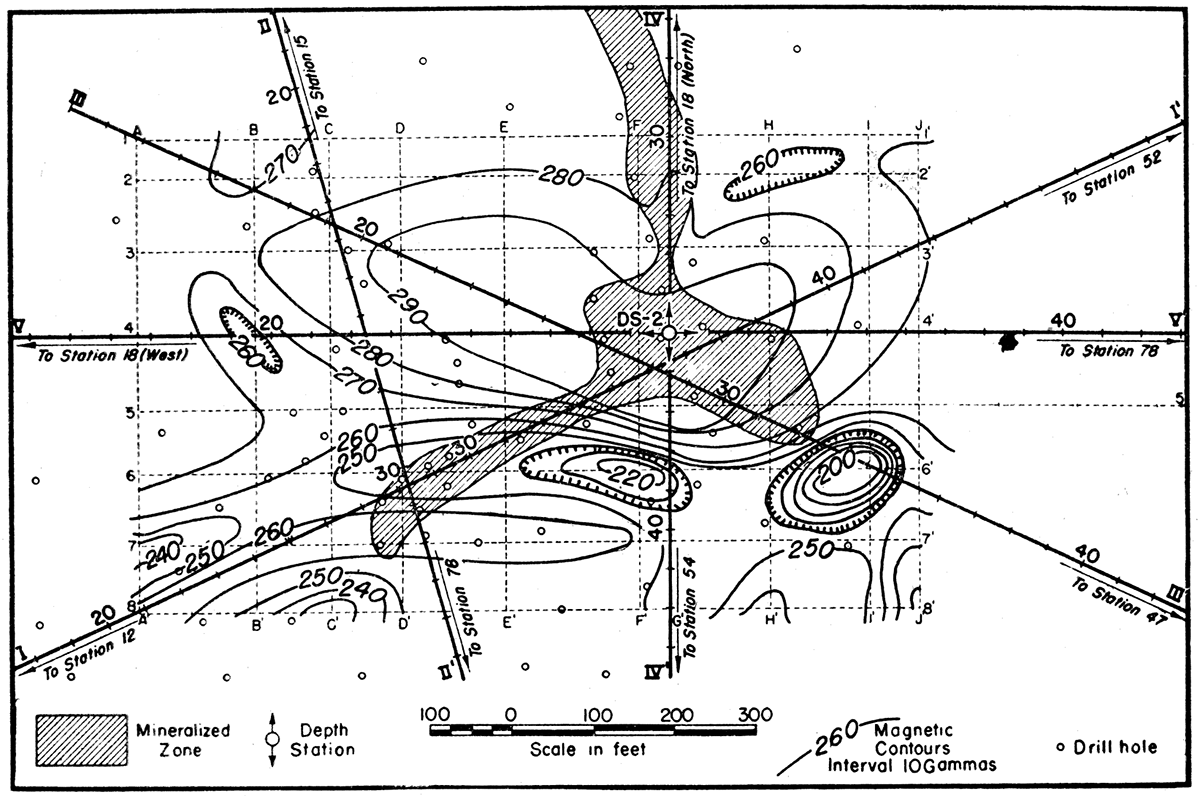
The magnetic map of the Walton area (fig. 31) shows lower magnetic values in the central part of the area, except for the small magnetic high immediately north of the pond. A value of 220 to 230 gammas appears to be normal for the area.
Figure 31—Map showing magnetic contours in the Walton area.
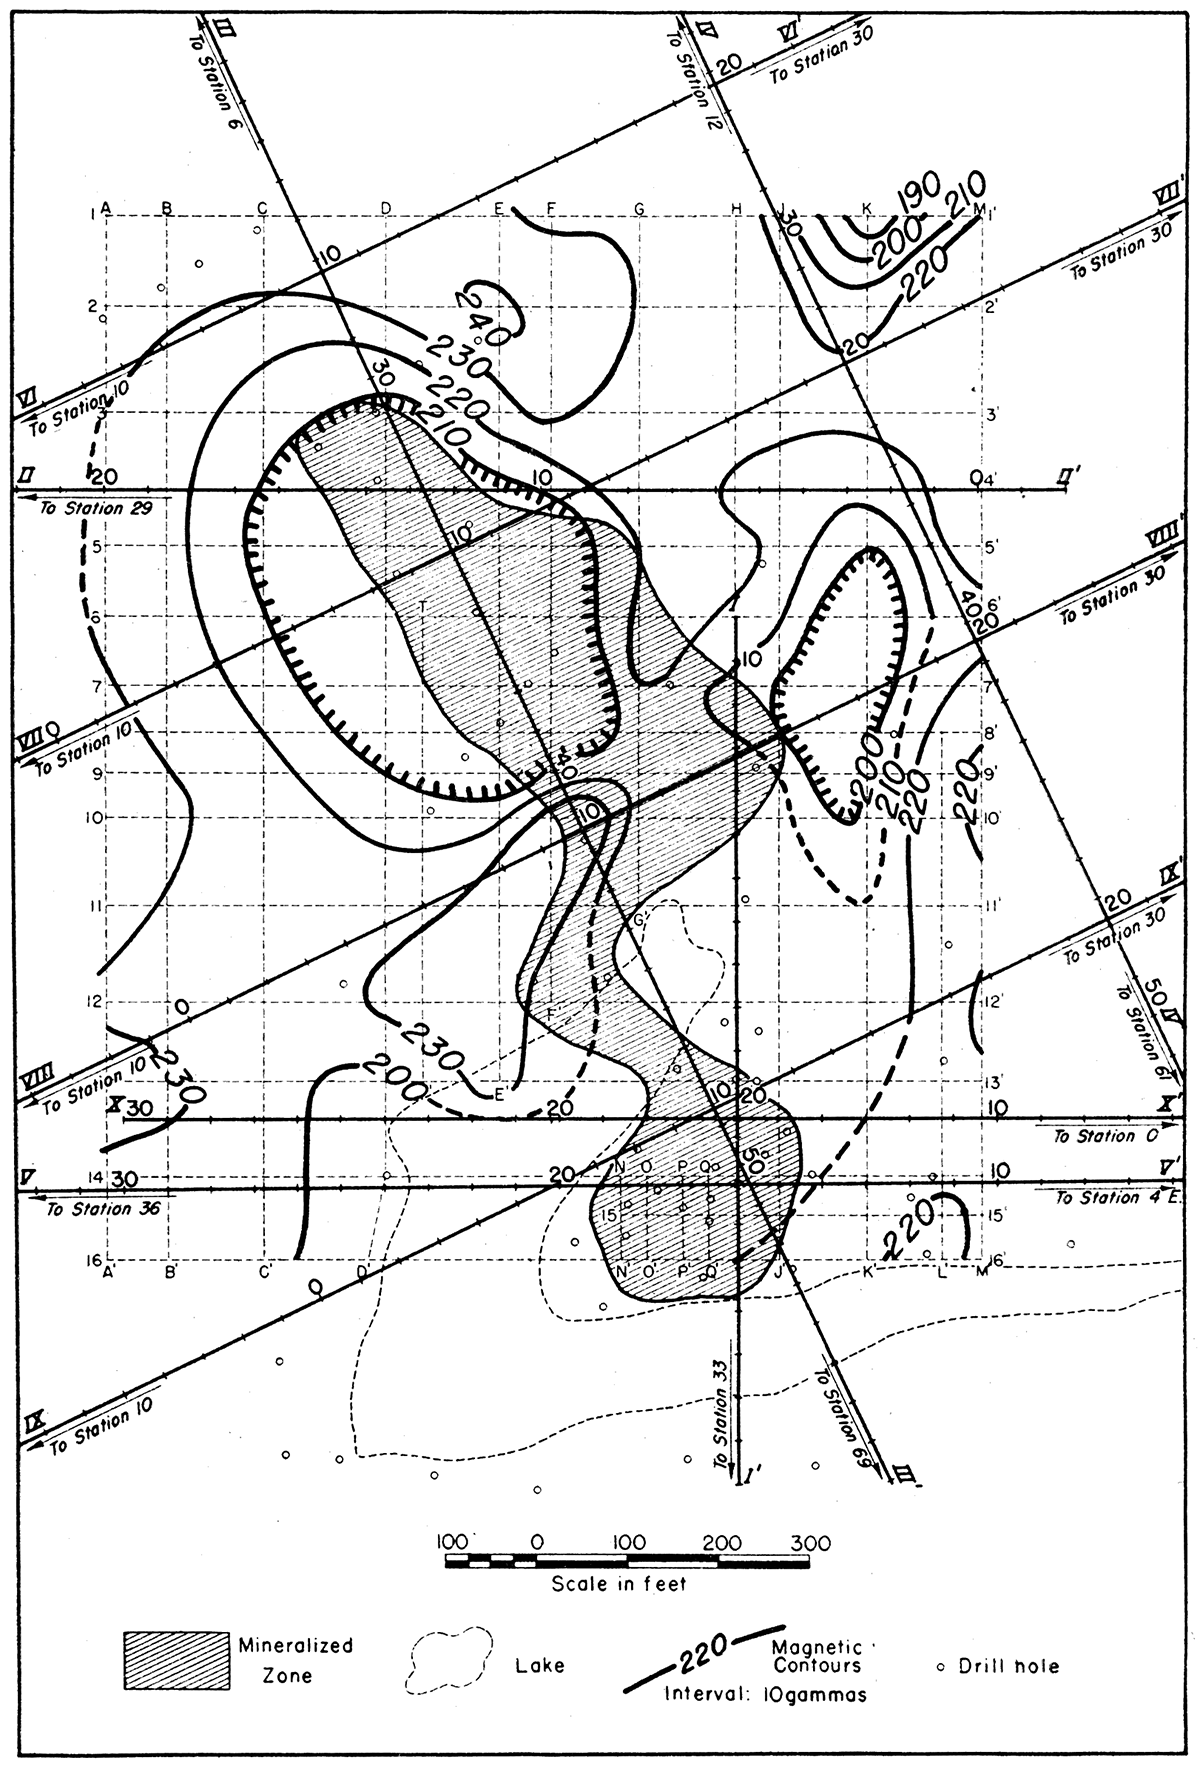
The most prominent features are the magnetic lows, one at the intersection of traverses III-III' and VII-VII', and another at grid station K-7. The first-named low and the trend of magnetic contours agree quite closely with the outline of the mineralized zone in this part of the area. The other low appears to be east of the mineralized zone. A trace of sulphide mineralization was noted in the drill hole located about 30 feet east of grid station K-8. The field work indicated that these anomalies might be due to the presence of casing in some of the drill holes. Casing was observed at the drill hole near grid station D-4 and, although unobserved, might be present in some of the other holes. A more thorough analysis indicates that these anomalies could not be caused entirely by casing, and, therefore, that natural anomalies of a magnitude of at least 50 gammas probably are present in the area. There is a possibility that a magnetic low might normally be present in the area over the mineralized zone at the south end of the property, except for the effect of drill hole casing.
Although there appears to be some correspondence in the position of low magnetic values and the trend of mineralization in this area, a theoretical basis for actual relationship cannot be seen at this time. The anomalies are of small lateral extent and may, therefore, be due to shallow structural or lithologic variations within the shale and the upper portion of the underlying limestone (including the zone of mineralization). The magnetic lows cannot be attributed to the ore mineralization itself, since any small difference existing between the magnetic susceptibilities of the ore minerals and the surrounding rocks would not be such as would tend to produce magnetic lows over the mineralized zones. Brecciation and cavernous conditions in the limestone may be associated with mineralization in this area. If extensive enough, such conditions might cause magnetic minima due to the reduction in normal magnetic susceptibility of the limestone. It would be logical to expect that such conditions might also cause gravity minima. (See Gravity Survey.) Another possible explanation is that the magnetic lows are the result of a lateral variation in the thickness and magnetite content of sandstone horizons in the Cherokee shale. Such variations would have no relation to the occurrence or location of lead-zinc mineralization.
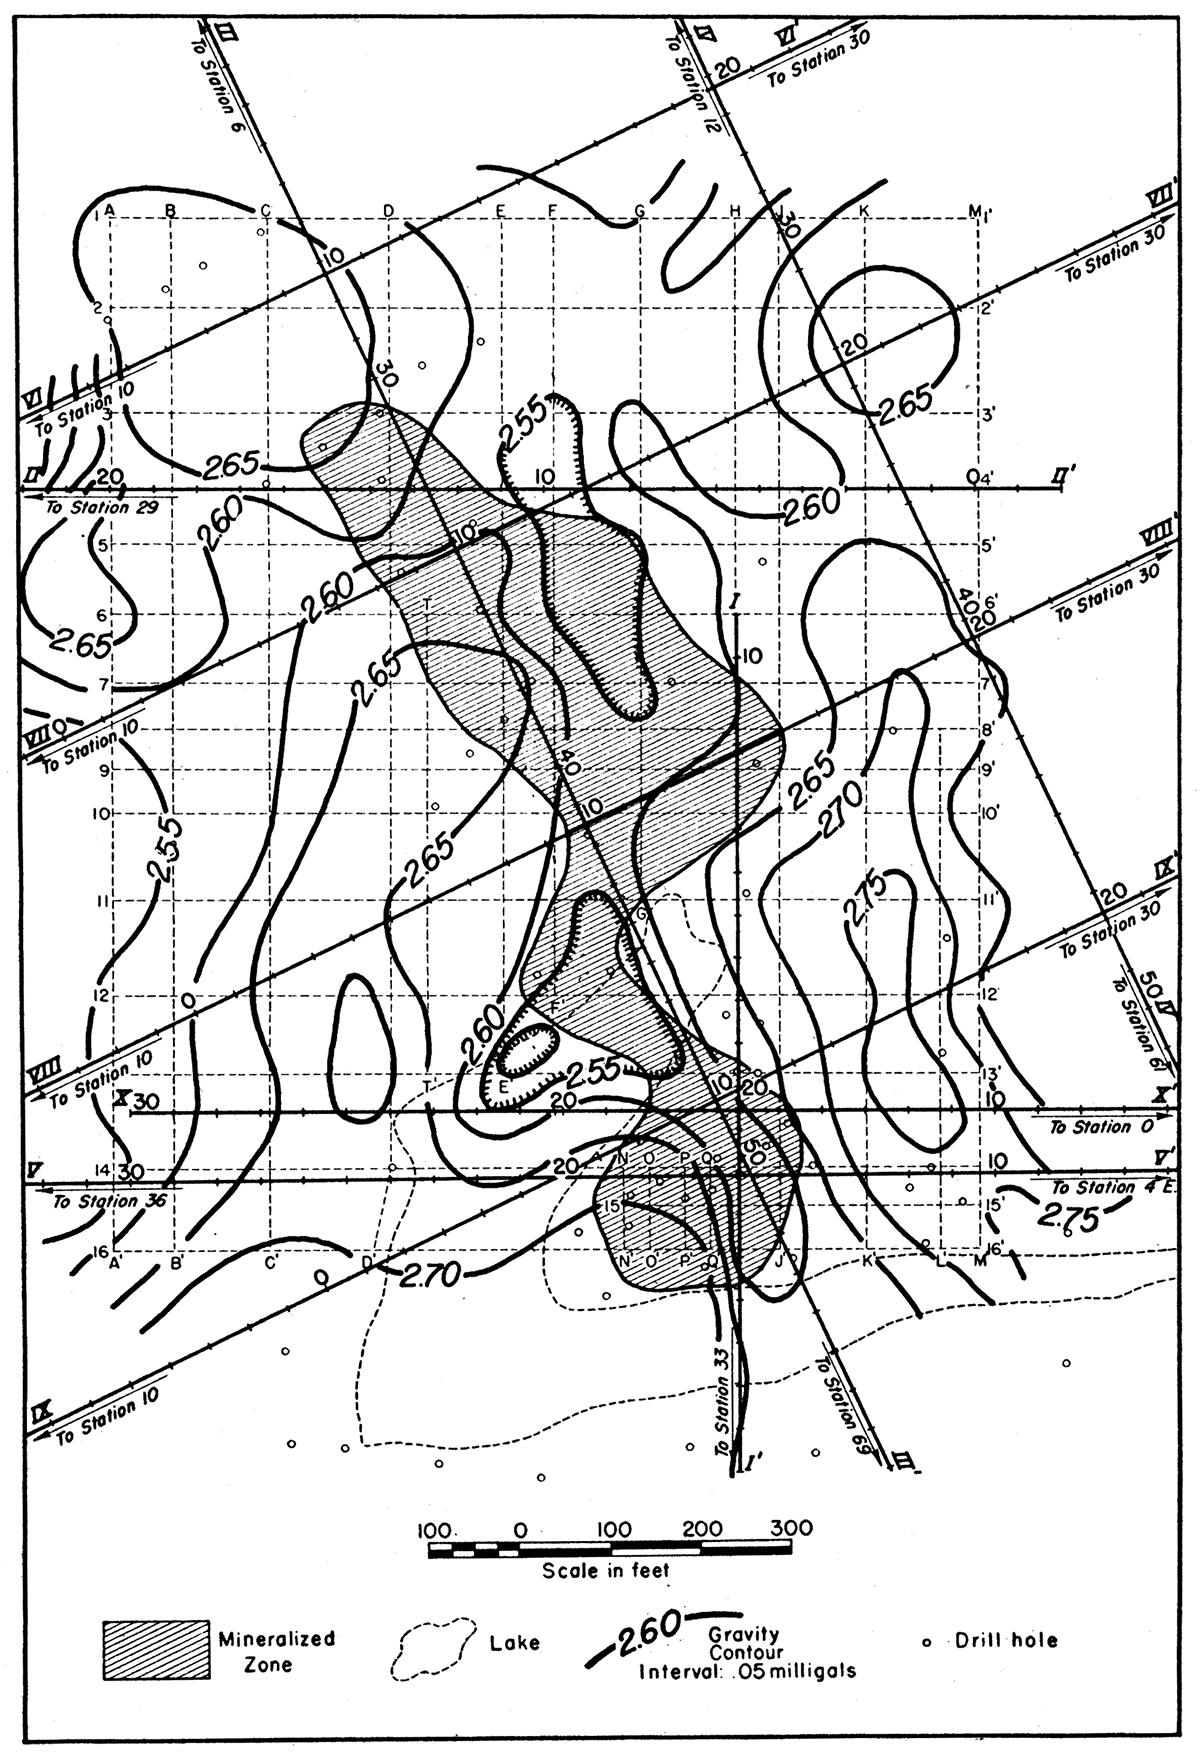
Gravity Survey
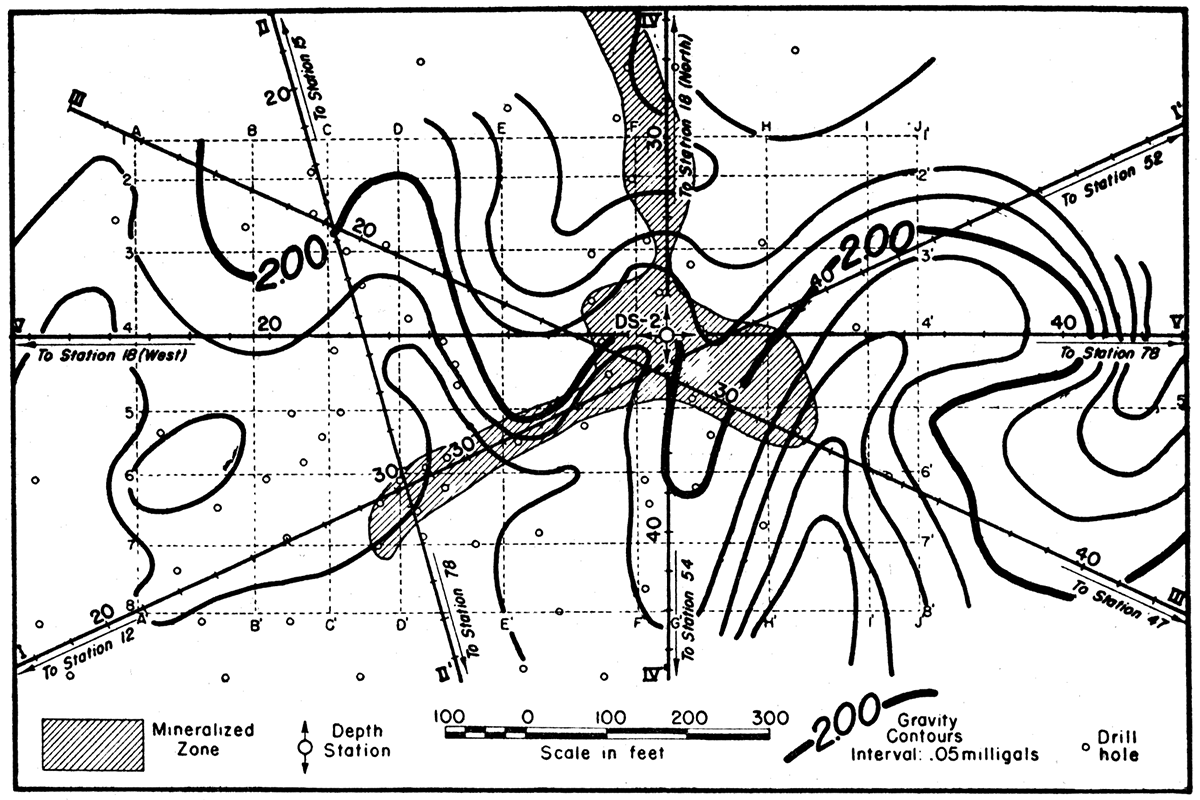
The gravity map of the Walton area (fig. 32) shows several high and low anomalies. The maximum gravity relief in the area is approximately 0.4 milligals, and the average relief between the individual anomalies is approximately 0.1 to 0.15 milligals. A gravity low in the central part of the area coincides in part with the position and trend of the zone of mineralization, suggesting a possible relationship. However, it is to be noted that except for the values along profiles IX-IX' and X-X' (figs. 29, 30), this central gravity low departs considerably from the indicated position of the mineralized area. It is true, also, that the gravity values at places along the east and west borders of the area are as low as, and sometimes lower than, values over the mineralized zone.
The gravity anomalies, therefore, do not show any unique diagnostic relationship to the trend of the mineralized zone. It is probable that the variation in gravity values are related to irregular zones of brecciation and cavernous conditions in the limestone which may or may not be related to the mineralized zone.
Figure 32—Map showing gravity contours in the Walton area.
Natural Potential Survey
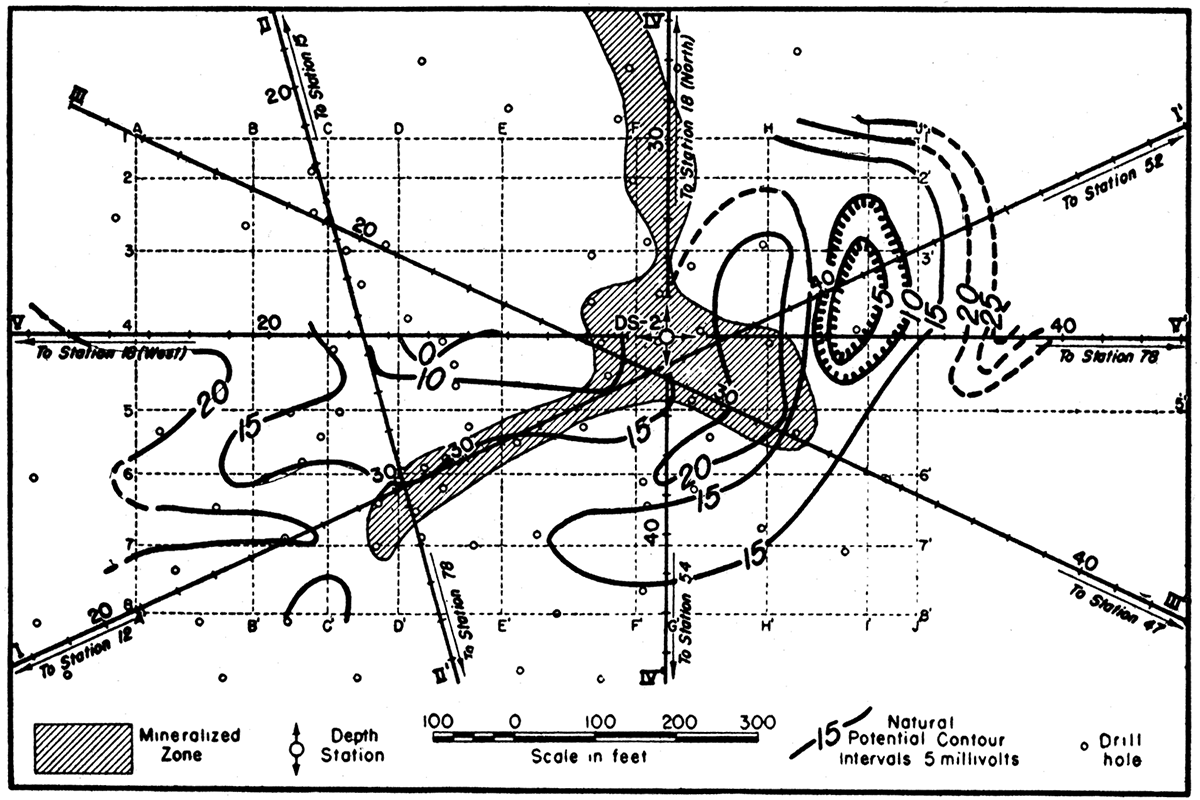
The natural potential readings in the Walton area were less satisfactory from the standpoint of reading accuracy than in any of the other areas. The total observed variation in the area was approximately 30 millivolts. In this area particularly, it was difficult to secure accurate readings because of an apparently random directional and intensity variation in the natural potentials. It is thought that this may be due to changing distribution and flow of ground water, associated with possibly cavernous conditions in the limestone. The contour map (fig. 33) shows natural equi-potential contours with an interval of 5 millivolts, which is believed to correspond approximately to the error of the observations.
No relationship to structure or mineralized zones is apparent in this contour map. The erratic distribution of potentials suggests that they are either related to ground water conditions or, perhaps, to even more shallow near-surface effects.
Figure 33—Map showing natural potential contours in the Walton area.
Resistivity Survey
Profiles—The resistivity results in the Walton Area are shown in profiles which exhibit the variations in apparent resistivity along the various traverses (figs. 24 to 30). The results obtained along the various traverses are described below:
Traverse I-I' (longitudinal): There is evidence of a slight resistivity low over the southernmost mineralized zone. The north part of the profile is ambiguous, probably as the result of an extraneous near-surface resistivity variation.
Traverse II-II' (longitudinal): The profile shows a slight resistivity low with associated "W" effect, partially obscured by a westward increasing resistivity gradient.
Traverse III-III' (longitudinal): A resistivity low extending from station 31 to 37 extends over a portion of the northern-most indicated mineralized zone. The normal values on the curve are disturbed by the sharp resistivity high at station 42 which appears to be part of the same condition which causes a resistivity high at station 12 on traverse I-I'. Another resistivity low extending from station 47 to station 53 coincides quite closely with the location of the southern-most indicated zone of mineralization.
These resistivity lows are reflected only very slightly in the readings taken at a depth of 200 feet. This indicates that the conditions responsible for lows lie within the limestone, below the bottom of the shale.
Traverse IV-IV' (longitudinal): Insofar as is known, this traverse crosses barren area throughout its extent. Measurements along this line were made for the purpose of determining the magnitude of resistivity variations in barren ground and for the purpose of direct comparison to the resistivity profile along traverse III-III', crossing the mineralized zone 500 feet to the west.
Resistivity lows are present in the vicinity of station 25 and station 36. In variation from mean average values along the traverse these lows are of approximately the same magnitude as the lows observed over the mineralized zones along traverse III-III'.
Traverse V-V' (longitudinal): A well-defined resistivity low extends between stations 14 and 18. This agrees closely with the location of the underlying mineralized zone. (Transverse): The transverse profile at this location was measured at 200 feet depth, primarily for the purpose of comparison to the transverse profile at 350 feet depth along traverse X-X'. An offset location was necessary in order to span the pond in the vicinity. The profile values are erratic but show slightly lower resistivity values in the area over the mineralized zones.
Traverse VI-VI' (transverse): The values on this profile show only slight departures from the average trend, a slight low extending between stations 10 and 16. This traverse is believed to cross barren area.
Traverse VII-VII' (longitudinal): The values on this profile show only very slight departures from the mean average values. The gradient of westward increasing values is possibly due to decreasing depth of shale cover in this direction (fig. 4). (Transverse):
This profile shows lower resistivity values in the central part of the traverse with a well-defined low extending between stations 3 and 9.
This low extends chiefly to the west of the projected outline of the mineralized zone and apparently represents a structural change which mayor may not be related to the mineralized zone. The increasing values to the westward may be due to decreasing thickness of shale or to greater induration of the limestone west of the mineralized zone.
Traverse VIII-VIII' (longitudinal): This profile shows a slight resistivity low with associated "W" effect at station 13, over the projected outline of the mineralized zone. (Transverse): The transverse profile shows a westward increasing gradient but no Indication of an anomaly related to the mineralized zone or immediately adjacent structure.
Traverse IX-IX' (transverse): This profile shows a definite, but very slight, resistivity low occurring over the mineralized zone at stations 8 and 10.
Traverse X-X' (transverse): A well-defined resistivity low extends between stations 14 and 21. This covers the projected outline of the mineralized zone and extends, as well, out over the pond to the west. Since no control is available in this vicinity, however, it is possible that the mineralized zone extends somewhat farther west than indicated on the maps.
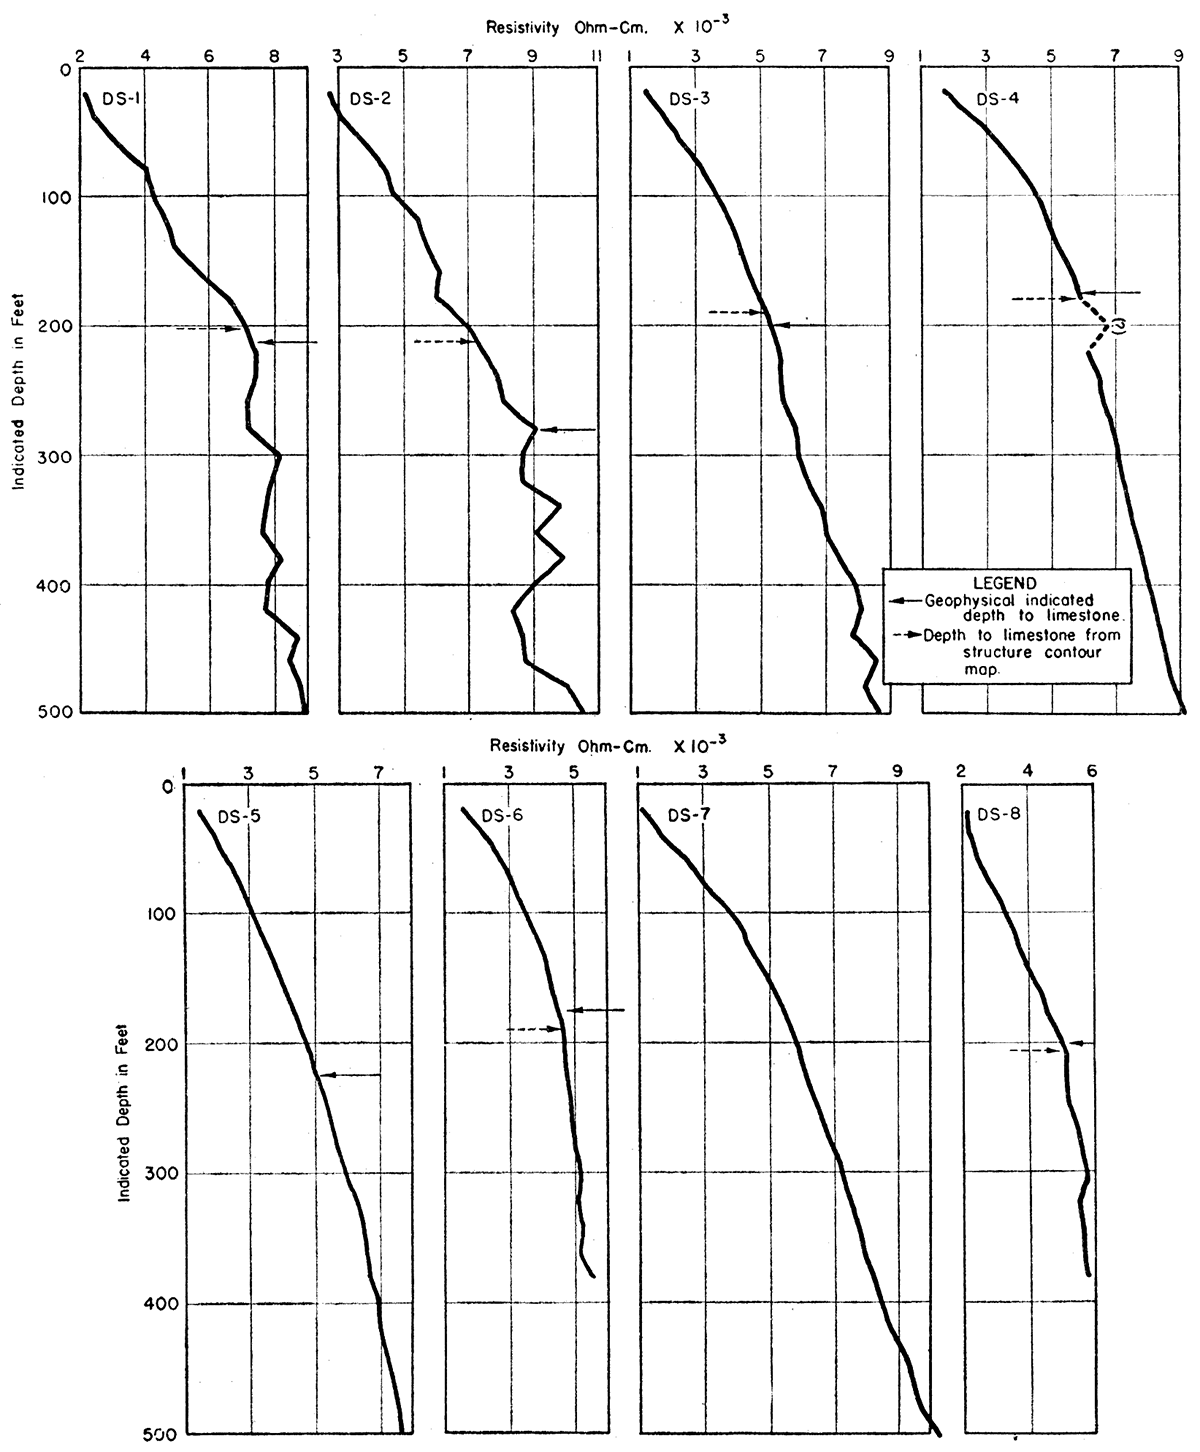
Depth stations—The resistivity depth profiles in this area (fig. 55) are somewhat similar to those previously described for the Mullen area. As in the latter area, a definite change in curve trend appears to be associated with the shale-limestone boundary. [Note: It is recognized that conventional theory will not account for these trend changes.] However, this does not appear on all of the curves. All resistivity curves were interpreted by the theoretical method previously described and the depth to the shale-limestone boundary calculated.
Table No. 14 illustrates the geophysical calculations and a comparison to drill-hole indicated elevations.
Table 14—Resistivity-depth correlation—Walton area
| Station | Surface elevation |
Geophysical depth to limestone |
Geophysical elevation of limestone |
D.H. elevation of limestone |
|---|---|---|---|---|
| 1 | 816 | 210 | 606 | 614 |
| 2 | 817 | 275(?) | 542(?) | 605 |
| 3 | 813 | 200 | 613 | 625-630 |
| 4 | 814 | 175 | 639 | 630-640 |
| 5 | 815 | 225 | 590 | no data |
| 6 | 816 | 175 | 641 | 620-625 |
| 7 | 816 | no trend change | ||
| 8 | 816 | 200 | 616 | 610 |
Geothermal Survey
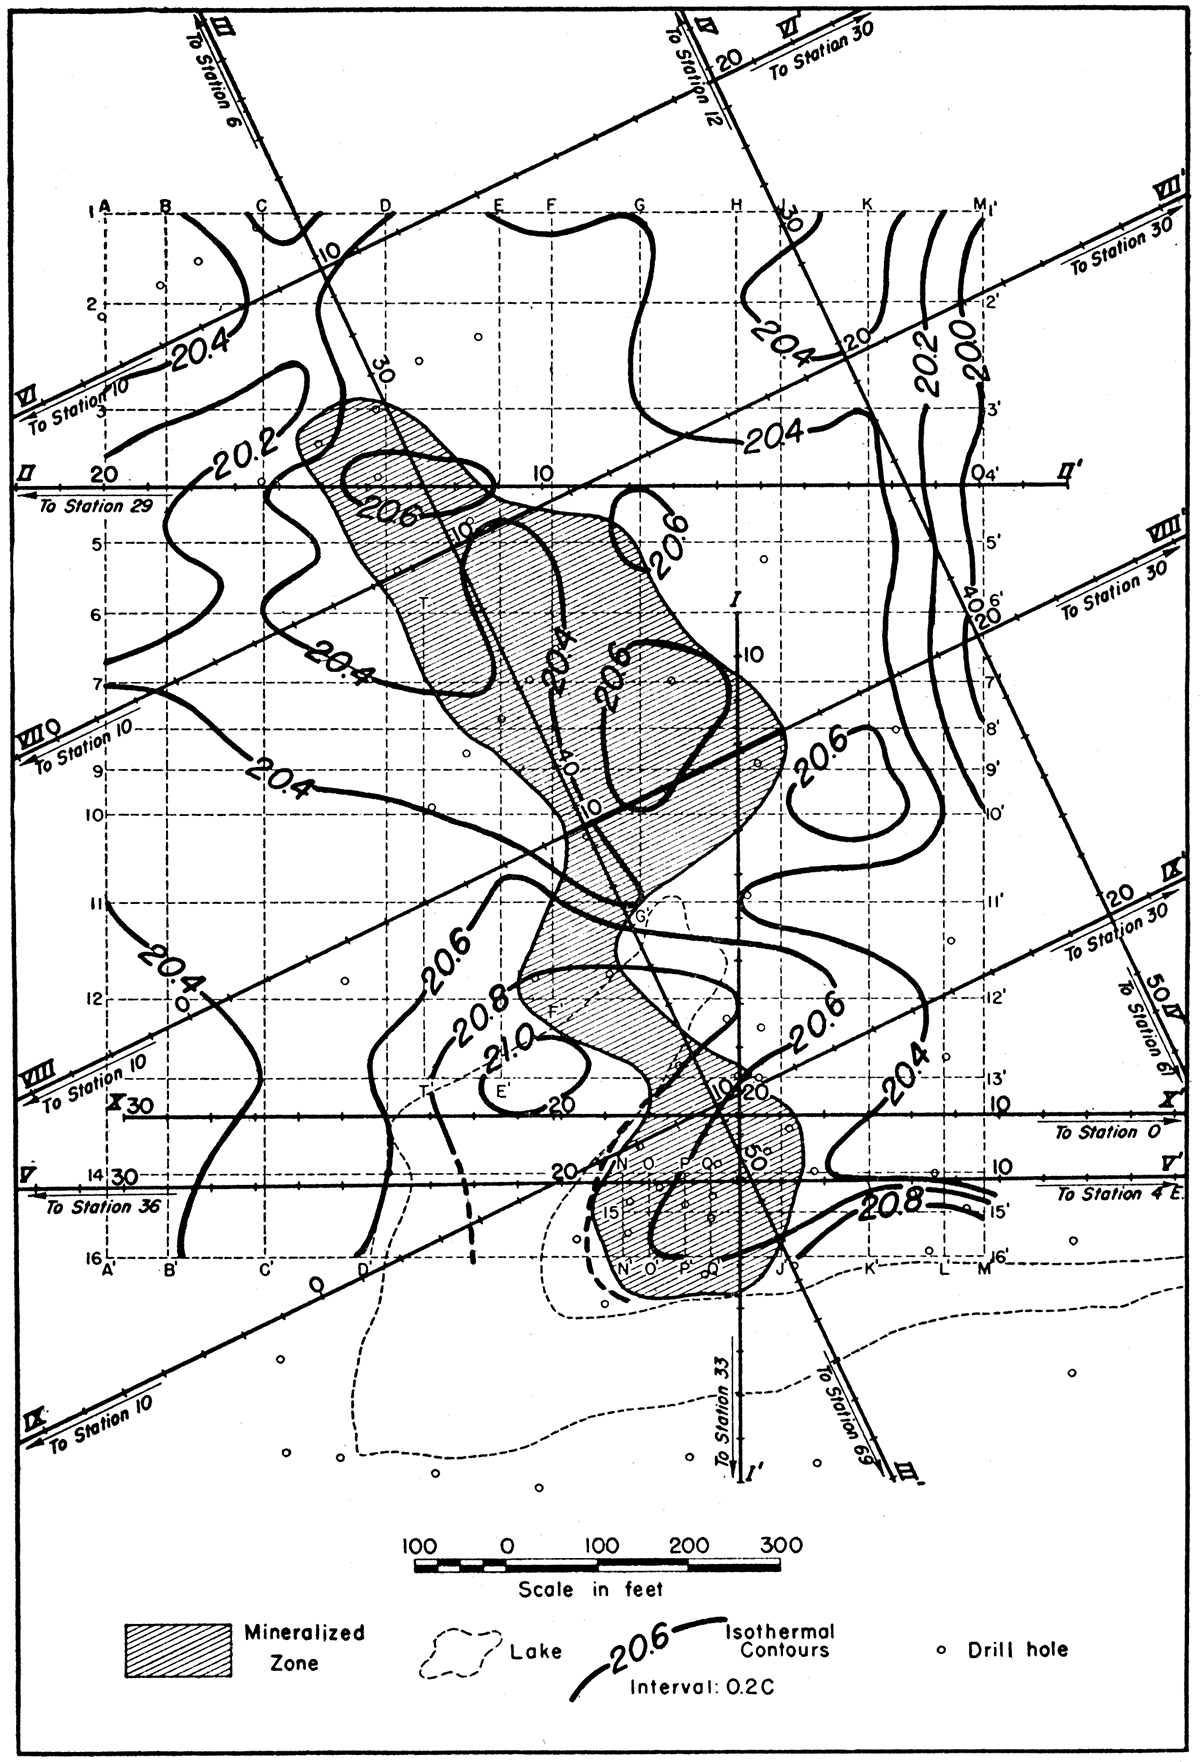
The temperature contour map of the Walton area (fig. 34) shows a central area of slightly higher temperatures. The total range of temperature in the area is approximately 1.0 degree Centigrade. The contour interval is 0.2 degree, which is the estimated probable error in the final corrected values.
Figure 34—Map showing temperature contours in the Walton area.
Nevertheless, they are sometimes found in field resistivity curves. Electrolytic or polarization effects at the formation boundaries may be influential in causing these variations.
The areal extent of this survey was not sufficient to allow definite conclusions with regard to a possible relationship between this broad temperature high and the central mineralized zone. It is to be noted, however, that the highest temperature values fall in an area west of the south end of the mineralized zone (south ends of grid lines D, E, and F), Traverses II-II' and III-III' both show local temperature highs of small intensity occurring over portions of the mineralized zones. Traverses VII-VII' and VIII-VIII', however, show local highs outside of the indicated mineralized zone.
Geochemical Survey
In the spectrographic analyses of the Walton soil samples, cobalt was the only element found to vary to a degree definitely beyond the possible analytical error of the measurements. The map (fig. 35) shows the approximate distribution of cobalt in the soils of the Walton area.
Figure 35—Map showing areal distribution of cobalt in the soil of the Walton area.
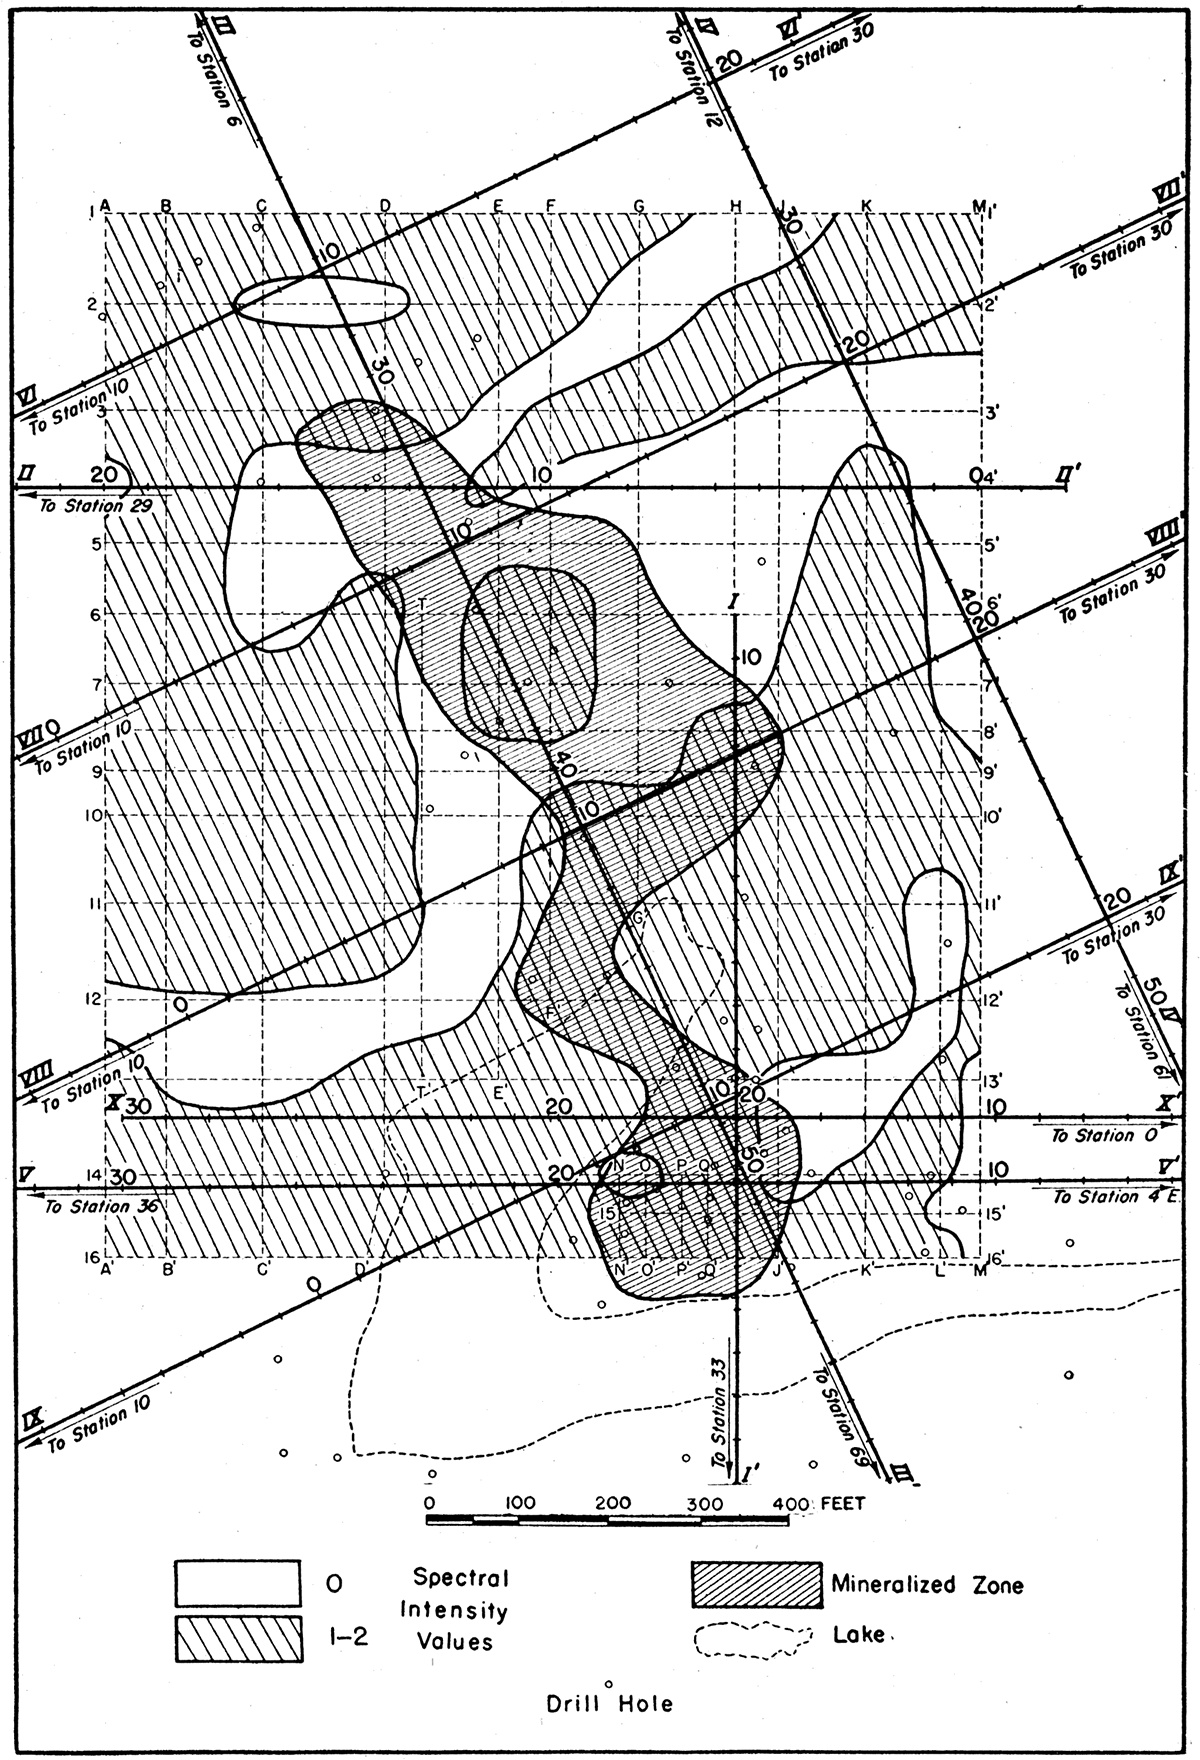
Figure 36—Resistivity depth profiles in the Walton area.
The distribution of cobalt as shown by this map apparently has no relationship to ore mineralization or structure on the Walton area. Neither is there any significant resemblance of this data to the other geophysical data in the area. The presence of a relatively thick Tertiary cover in this area probably explains, in part, the lack of correlation between geochemical data and geology.
Summary
One of the most significant features in the study of the geophysical data for this area is the small magnitude of the anomalies. In order to adequately illustrate the anomalies by means of contours it has been necessary to use a contour interval which is approximately equal to the error in the observations. The data in table No. 15 were compiled to compare, for each type of geophysical method, the intensities of the various geophysical anomalies relative to the maximum error in the observations.
Table 15—Magnitude of geophysical anomalies—Walton area. *Ratio of variation from approximate mean average values to the indicated maximum. error in the measurement. (see pp. 37, 89, 40, 42, 46, 46, 61, and 62-77).
| Geophysical Method | Ratio of anomaly to maximum error* |
Ratio of total range of observations to maximum error |
|---|---|---|
| Magnetic | 5 | 10 |
| Gravity | 3 | 8 |
| Natural potential | 2 | 6 |
| Resistivity | 10 | 10 |
| Geothermal | 2 | 5 |
| Geochemical | 2 | 2 |
From this compilation it is apparent that, regardless of any geological significance, resistivity, magnetic, and gravity anomalies, in the order given, are the least likely to be due to, or influenced by, observational error; whereas, observational error is likely to be influential in the natural potential, geothermal, and geochemical anomalies.
The relief on the limestone surface in this area is so gentle as to eliminate this feature from consideration as a primary cause for anomalies in the area, although some of the resistivity curves apparently indicate the effect of greater or less depth of shale in parts of the area where the change is most pronounced. Of most importance, therefore, are possible relationships of the various anomalies either to the mineralized zone or to conditions of porosity or brecciation which are related to the mineralization.
None of the geophysical methods gave consistently correlatable results for this area. Six of the resistivity traverses exhibit anomalies that appear to be due either to the mineralized zone or to directly related structural conditions (traverses II-II', III-III', V-V', VIII-VIII', IX-IX', and X-X'). However, a traverse in supposedly barren territory (traverse IV -IV') exhibits anomalies of approximately the same strength as those over the mineralized zones.
The resistivity depth studies are summarized as follows: From a total of eight stations, it was possible on five (DS-1, DS-3, DS-4, DS-6, and DS-8) to determine the probable depth to the limestone. On the average, these computed depths. are within 5 percent of the depths indicated by drilling information. One station (DS-2) gave an erroneous correlation; one (DS-7) showed no correlatable trend change; and one (DS-5) exhibited a trend change; but it was outside the area of drill hole check information.
The magnetic work reveals an apparent coincidence in location of magnetic lows with parts of the mineralized zone. No theoretical basis for actual relationship between the magnetic values and the mineralized zone is evident from available data.
The gravity work affords evidence of an occasional relationship between gravity minima and the mineralized zones. The areal relationship is not well-defined, however, nor are gravity minima unique criteria, since adjacent barren areas also show low gravity values. The results indicate that gravity minima correspond to zones of fracturing or cavernous conditions which mayor may not be related to mineralization.
The broad geothermal high extending over the central part of the Walton area is of unknown significance due to the restricted areal extent of the measurements.
The natural potential and geochemical anomalies appear to be unrelated to structure, lithology, or mineralization, in this area.
Karcher Area
The locations of the geophysical traverses and stations in the Karcher area are shown on figure 5. The geophysical measurements were conducted as follows: magnetic, 66 stations on the grid layout and 4 stations on the eastward extension of grid line 5; gravity, 79 stations on the grid layout and extensions of traverses IV-IV' and V-V'; natural potential, 76 stations on the grid layout and extensions of traverse V-V'; resistivity longitudinal traverses, at intervals of 50 feet along traverses I-I', II-II', III-III', IV-IV', V-V', VI-VI', and VII-VII'; resistivity depth measurements, at stations DS-1, DS-2, DS-3, and DS-4, all located on traverse V-V' (fig. 5); geothermal, 84 stations on the grid layout and extensions of traverses IV -IV' and V-V', and grid line 5; geochemical soil samples, 91 stations on the grid layout and extensions of traverse V-V'.
Profile and contour maps illustrating representative portions of the geophysical data and results for this area are shown herein (figs. 37-46).
Figure 37—Profiles along traverse II-II' in the Karcher area, showing magnetic, gravity, resistivity, and geothermal anomalies, zone of mineralization, and configuration of the top of the limestone.
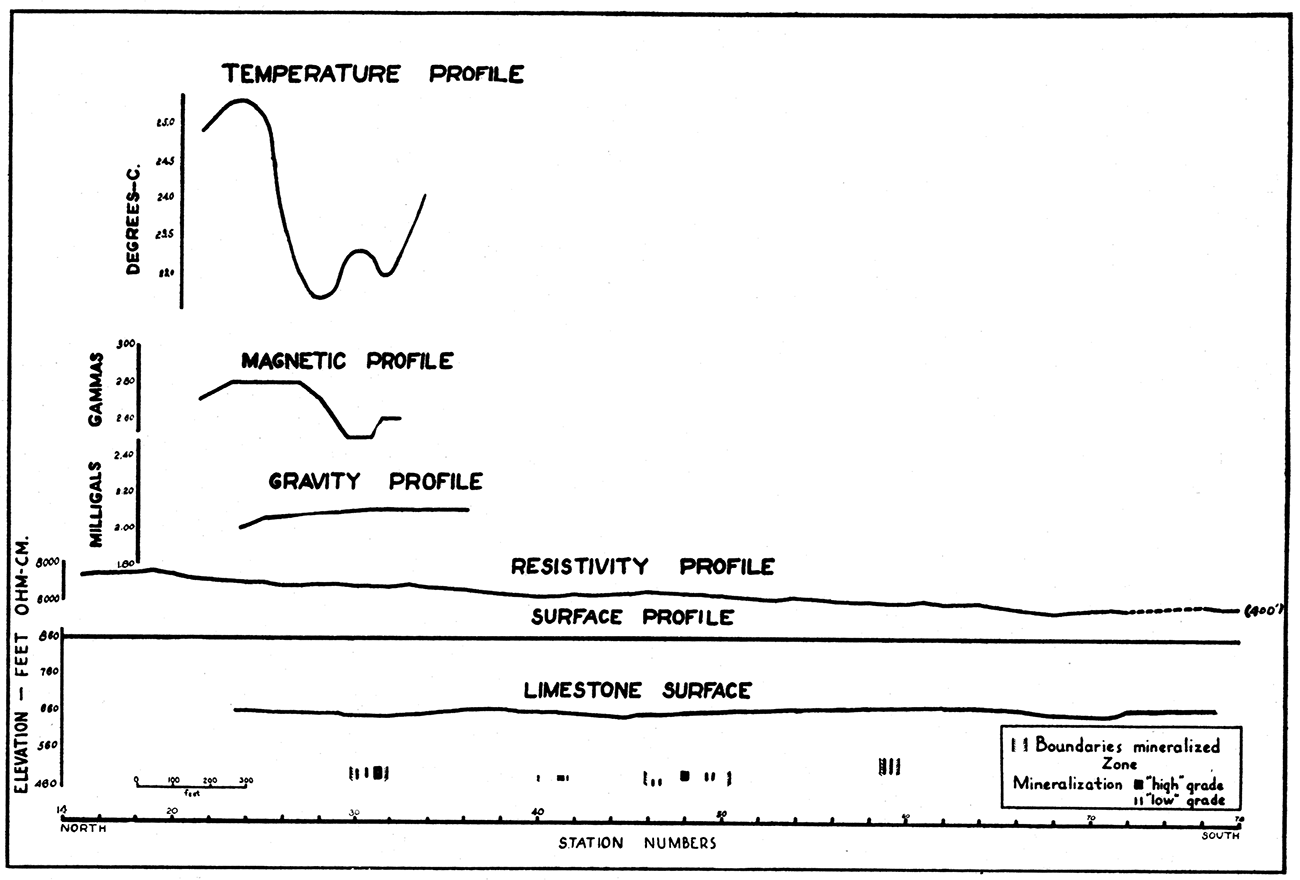
Figure 38—Profiles along traverse IV-IV' in the Karcher area, showing magnetic, gravity, resistivity, and geothermal anomalies, zone of mineralization, and configuration of the top of the limestone.
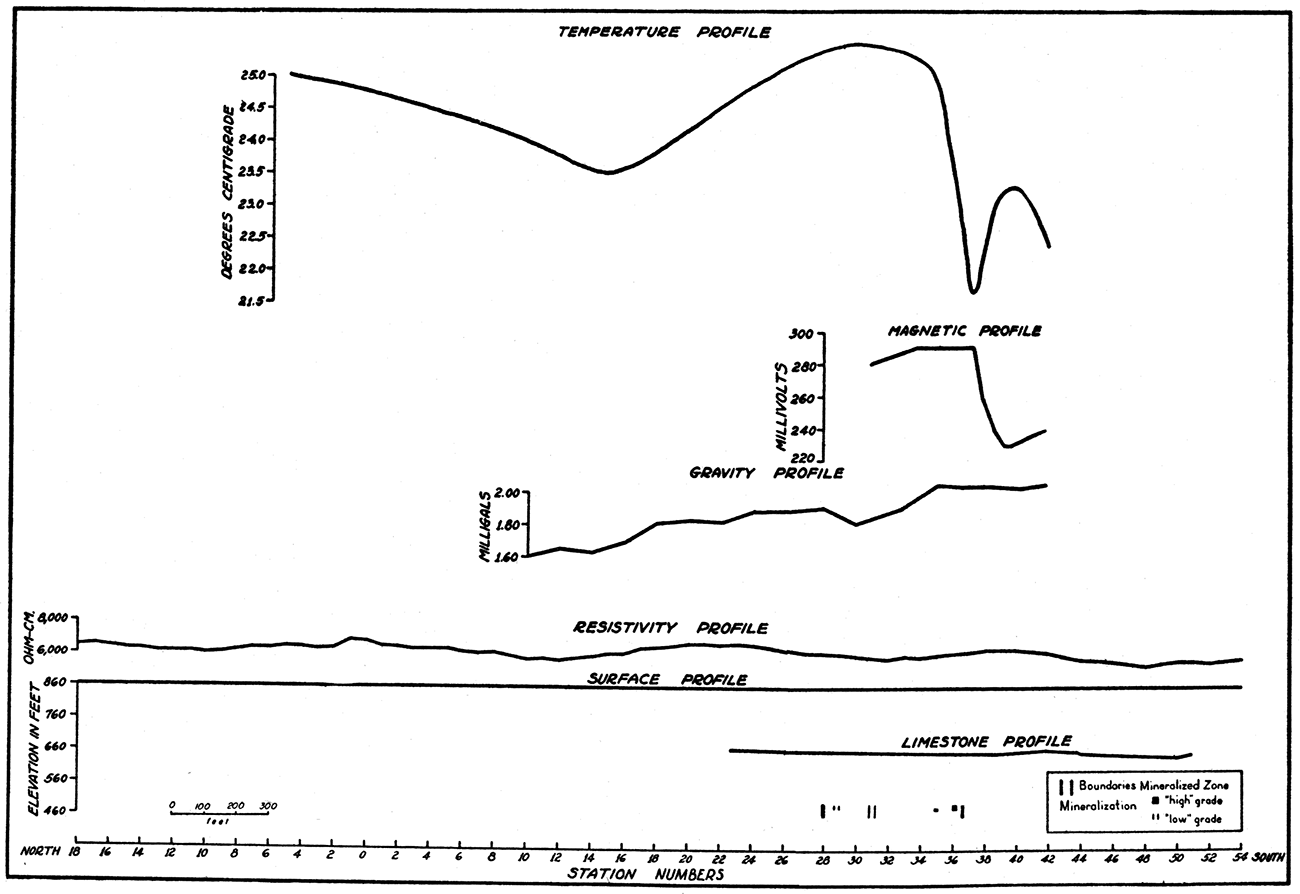
Figure 39—Profiles along traverse V-V' in the Karcher area, showing magnetic, gravity, natural potential, resistivity, geothermal, and geochemical anomalies, zone of mineralization, and configuration of the top of the limestone.
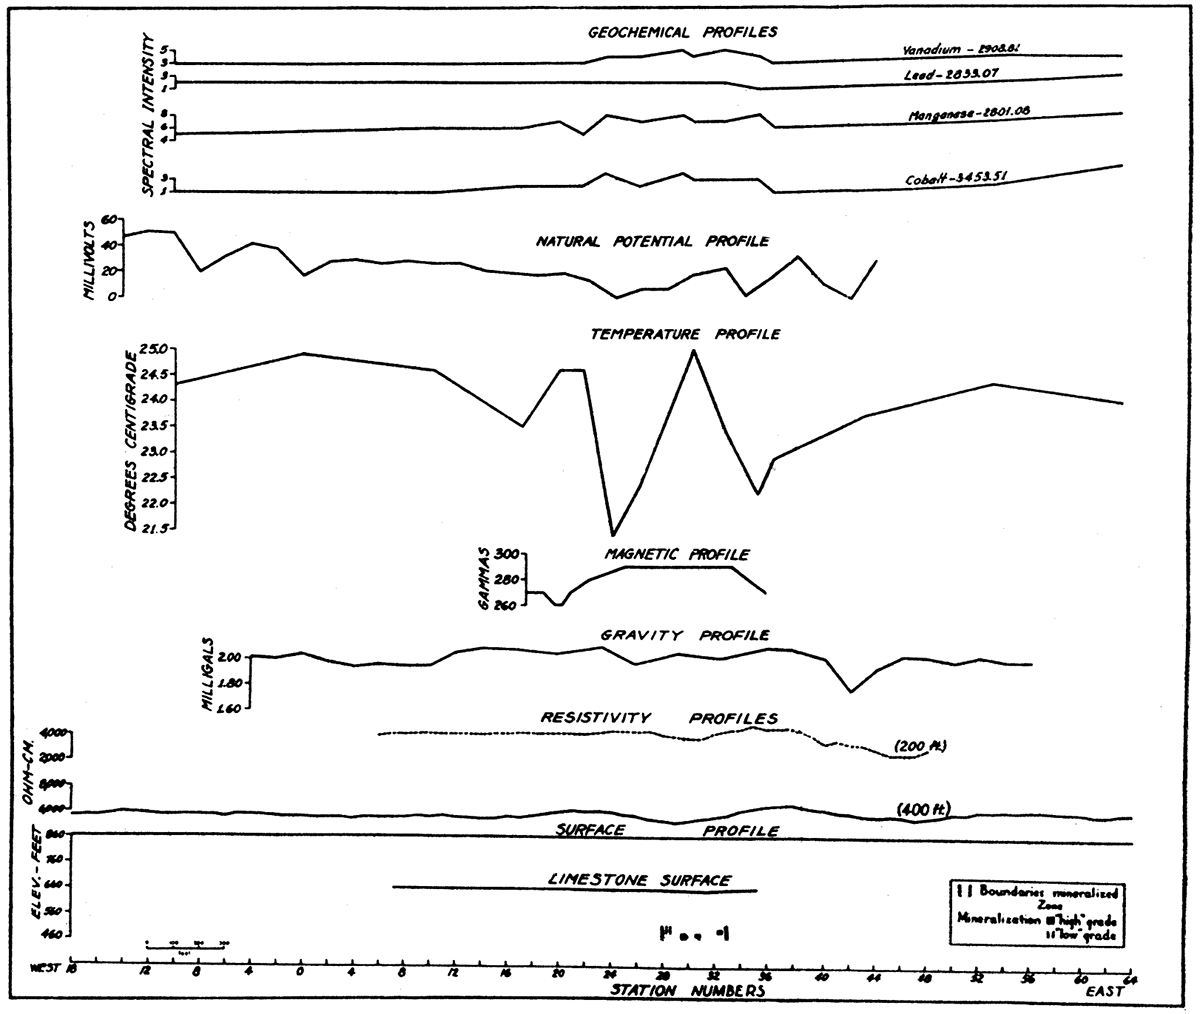
Figure 40—Resistivity profile along traverse VII-VII' in the Karcher area.
Magnetic Survey
The range of variation of the vertical magnetic intensity in the Karcher area is approximately 150 gammas. Most of this is represented by the two magnetic lows in the southeastern part of the grid layout. Over most of the grid, the values range between 250 and 300 gammas. A magnetic high with a closure of approximately 40 gammas covers most of the northern half of the grid layout (fig. 41).
Figure 41—Map showing magnetic contours in the Karcher area.
The magnetic anomalies apparently have no relation to the mineralized zones or to the contour of the shale limestone boundary. The smaller anomalies probably are caused by extraneous near-surface lithological variations; while the somewhat more extensive magnetic high may represent a change at greater depth. This change, however, does not appear to be related to the mineralized zone.
Gravity Survey
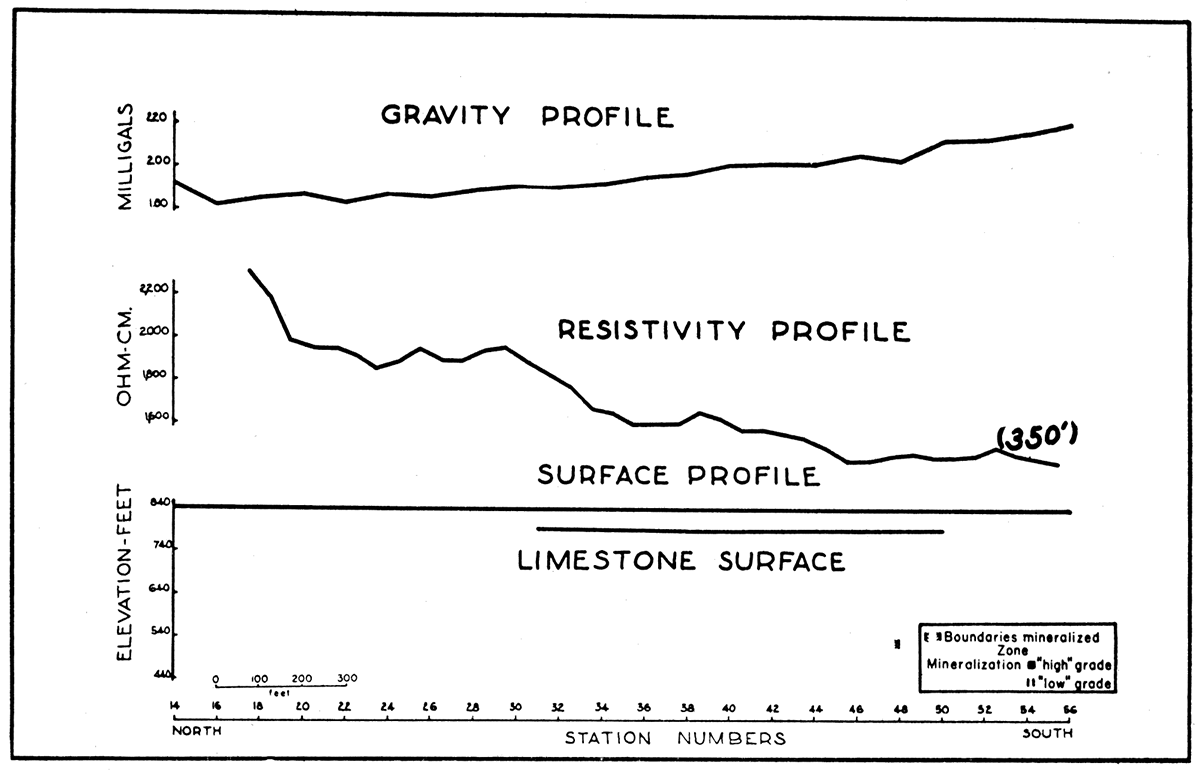
The gravity map of the Karcher area (fig. 42) shows quite a number of minor variations (small undulations in the contours) but no well-defined gravity maxima or minima. The total range of gravity change in tlie area is approximately 0.6 milligal, about half of which represents regional gradient (profile IV-IV', fig. 38). The total range of variation, in an east-west direction, crossing the mineralized zone at its indicated widest extent (profile V-V'), and excluding the apparently anomalous reading at station 42, is approximately 0.2 milligal.
Figure 42—Map showing gravity contours in the Karcher area.
A series of small gravity variations occur throughout the area. This can be best observed by following the 2.00 milligal contour on the map (fig. 42). As in the Walton area, gravity minima in the Karcher area occur both in the vicinity of and at locations away from the mineralized zones. It is believed that the lower gravity values are probably due to zones of brecciation or cavernous conditions. The results indicate that gravity minima in this area are not uniquely diagnostic criteria indicating the presence of mineralized zones, either directly or indirectly.
Natural Potential Survey
A range of variation of approximately 50 millivolts in natural potential was observed in the Karcher area. Over the grid layout, the range was only about 30 millivolts. The readings in this area are considered to be somewhat more accurate than was the case for the Walton area, since less diurnal variation was noted during the time devoted to the Karcher survey.
In addition to the readings on the grid stations, measurements were made along traverse V-V' in order to allow comparison to the subsurface structure and to the other geophysical data along an extended line of measurement (fig. 39). On this traverse the natural potential values are somewhat lower in that part of the area covered by the grid, but no correlation to structure or mineralized zones is apparent, The low readings at stations 23, 34, and 42 correspond in position to slight topographic lows representing drainage courses. The low values at station 42 are in the vicinity of a near-surface resistivity low as indicated by the shallow resistivity measurements along this traverse.
The contour map (fig. 43) shows the areal distribution of natural potential values. There is no evidence that negative centers are associated with the mineralized zones. The slight potential high extending along grid line 7 and turning northward along line H follows the general trend of a slight depression in the shale limestone contact (fig. 5), suggesting that these two features may possibly be related. No relationship to the mineralized zone is necessarily indicated thereby.
Figure 43—Map showing natural potential contours in the Karcher area.
Resistivity Survey
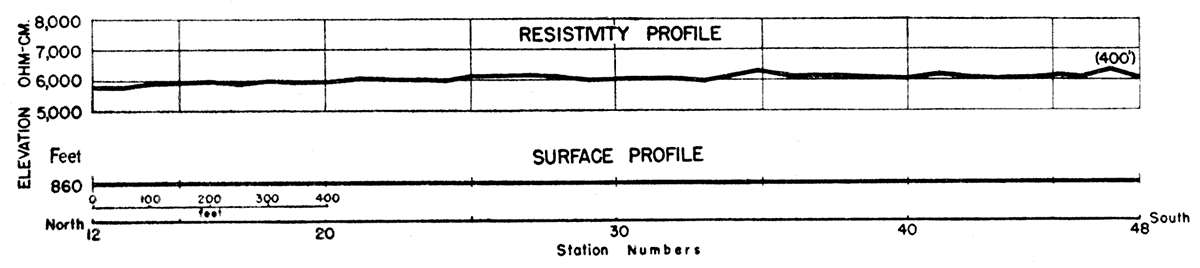
Profiles—The resistivity traverses in the Karcher area were all of the longitudinal type, and all extended to an effective depth of approximately 400 feet.
Traverses I-I', III-III', IV-IV', and V-V' all cross the Karcher mineralized zone near the position of its greatest width as indicated by drill hole logs. Of this group of traverses, traverse V-V' was extended a considerable distance east and west to get beyond the mineralized area. Along a part of traverse V-V', measurements to a depth of 200 feet were also made in order to indicate the presence of near-surface effects and to ascertain whether the effects of near-surface conditions on the deeper measurements could thus be determined and suitably evaluated.
The measurements along traverses II-II' and VI-VI' were for the purpose of ascertaining the possible effect of narrow mineralized zones on the apparent resistivity values:
Traverse VII-VII' is in known barren area, and the observed resistivity variations are, therefore, characteristic of barren ground in this area, as are also the eastern and western ends of the profile along traverse V-V'.
Traverse I-I': The resistivity profile shows a well-defined anomaly (resistivity low and "W" effect) centering at station 35, approximately over the center of the widest part of the Karcher mineralized zone. The narrow mineralized zone extending southwestward apparently has little effect upon the measurements.
Traverse II-II': The resistivity values on this profile decrease rather uniformly toward the south with only slight departures from the mean average trend. The relatively narrow mineralized zones crossed by this traverse apparently have no effect upon the resistivity values. Likewise, the effect of the contour of the limestone surface is very minor, if effective at all, (cf. structure and resistivity profiles at the south end of the traverse).
Traverse III-III': This profile exhibits a well-defined anomaly centering at station 29, over the center of the main mineralized zone. At this location the indicated zone of mineralization is 275, feet wide, the widest crossed by any of the traverses.
Traverse IV -IV': The anomaly shown on this profile over the mineralized zone is similar to the preceding anomalies (resistivity low with symmetrical "W" effect); but, with reference to variations along the rest of the profile, the low over the mineralized zone is not as prominent as the increases in apparent resistivity over the edges of the mineralized zone. A resistivity low occurs at stations 10 to 12 (south). A gravity low was also observed at this location. The only drill holes in this immediate vicinity are 200 to 400 west of the traverse, and none of these indicate more than a trace of zinc mineralization. The coincidence of resistivity and gravity lows probably indicates either increased thickness of shale at this location, or brecciation and cavernous conditions in the limestone, or both.
Traverse V-V': The anomaly shown by this profile, centering at station 30 over the mineralized zone, is very well-defined and is the only notable resistivity variation in a traverse distance of 4,800 feet. The normal trend of resistivity values is shown on the east and west portions of the traverse. That this anomaly is the effect of conditions in the limestone is shown by the relatively minor effect on the near-surface measurements at this location. It is interesting to note the relatively pronounced resistivity low at stations 45 to 47 on the shallow curve. This effect is present also on the deeper curve, but the relative magnitudes of the variations indicate that a shallow structural condition is responsible for the low at stations 45 to 47.
Traverse VI-VI': The profile along this traverse shows a number of minor variations, none of which show any correlation to the indicated mineralized zones or trend of the shale-limestone contact. Traverse VII-VII': This profile represents the resistivity variation in barren ground. It is notable for its extremely uniform trend with values decreasing slightly toward the south.
Depth stations—The resistivity-depth curves in this area (fig. 45) fire similar to those of the Mullen and Walton areas. They appear, however, to be less useful for determining the depth of the shale-limestone contact. The first measurements were made in an east-west direction. In view of the poor diagnostic quality of these curves, some north-south measurements were made for comparison at DS-1 and DS-2. Both of the north-south measurements gave better results than the east-west measurements at the same locations, and a trend change is present on the curve at the approximate depth to the shale-limestone contact.
Figure 44—Map showing temperature contours in the Karcher area.
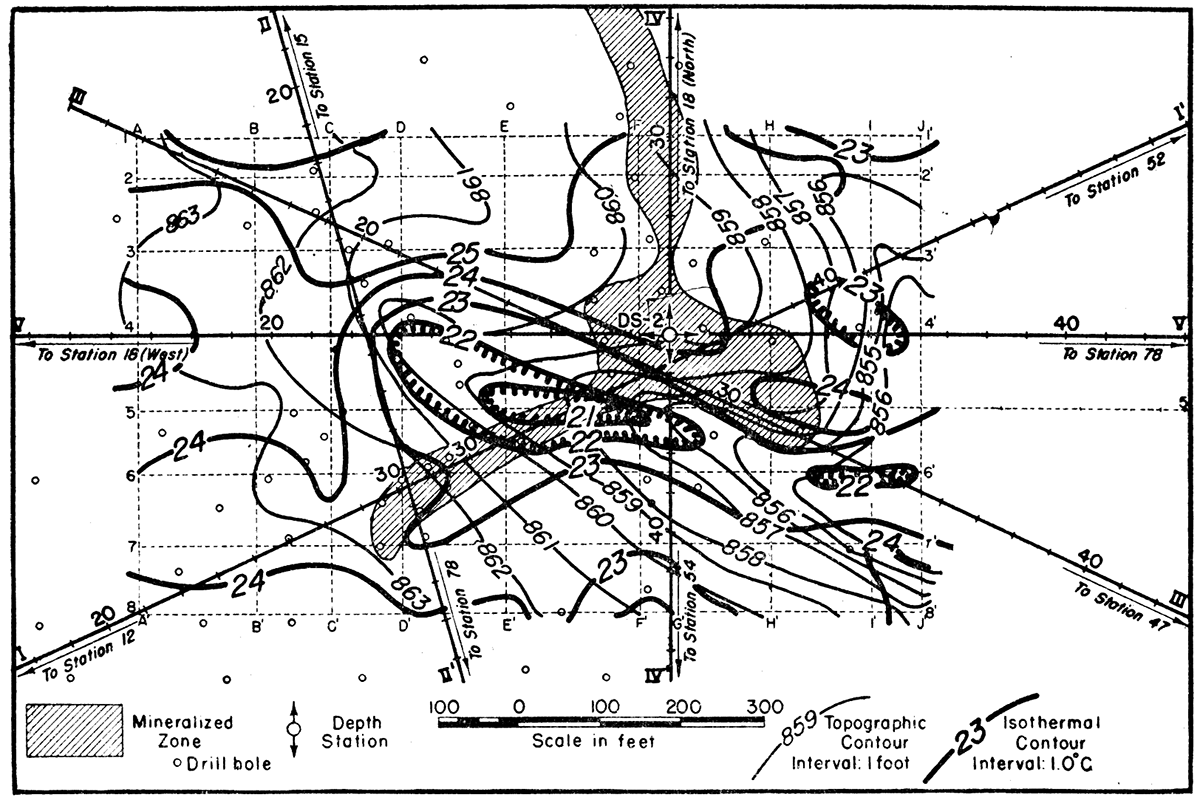
Figure 45—Resistivity depth profiles in the Karcher area.
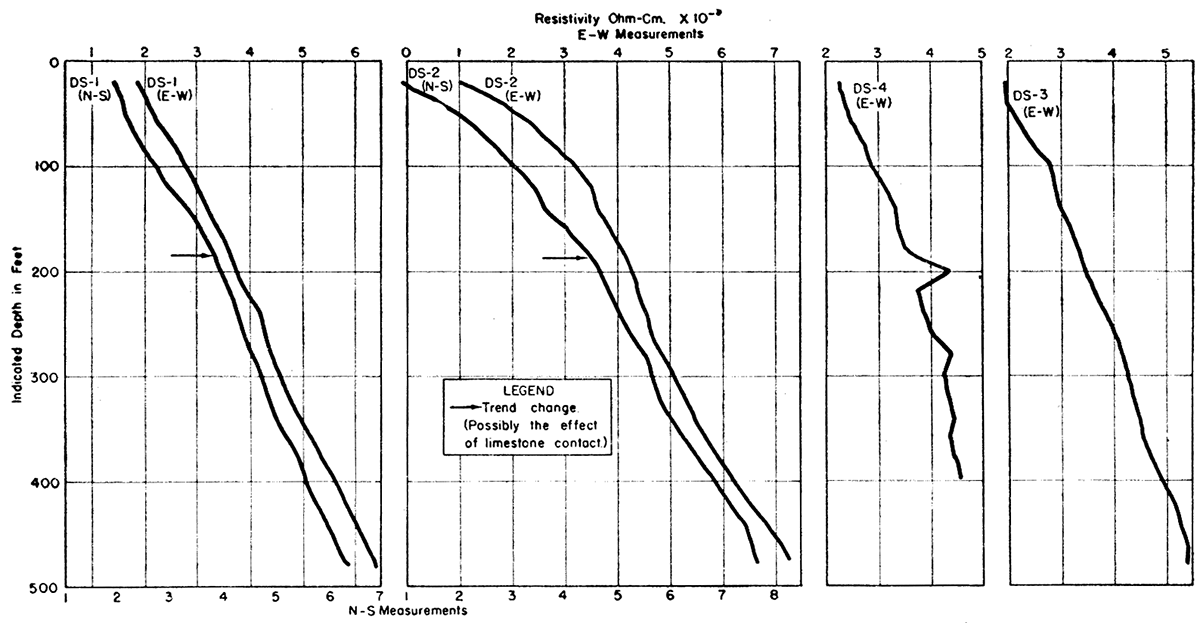
Table No. 16 summarizes the results of the resistivity-depth measurements.
Table 16—Resistivity-depth correlations—Karcher area.
| Station | Surface elevation |
Geophysical depth to limestone |
Geophysical elevation of limestone |
Drill hole elevation of limestone |
|---|---|---|---|---|
| DS-1 (N-S) | 865 | 190 | 675 | none |
| DS-1 (E- W) | 865 | 225(?) | 640 | none |
| DS-2 (N-S) | 860 | 190 | 670 | 655 |
| DS-2 (E- W) | 860 | 120(?) | ||
| DS-3 (E-W)—There are several minor trend changes but none that appear to be related to the shale-limestone contact. DS-4 (E-W)—A trend change at 140 feet (elevation of 715 feet) appears to be too high to be the shale-limestone contact. |
||||
Geothermal Survey
The Walton area geothermal survey was conducted after the onset of a period of prolonged rainfall. During the course of the measurements the ground was quite uniformly saturated with water, and the temperature measurements were made under water, with comparable conditions at each station.
On the Karcher area, the temperature measurements were made under quite different conditions. The Karcher readings were made earlier in the year, before the full onset of the rains, but during a period of intermittent rainfall. As a result, near-surface moisture conditions were often different at the various measurement stations. These conditions seem to be reflected in: (1) higher temperature readings, (2) greater range of earth temperature (5° C. as compared to 1° C. on the Walton area), and (3) a definite relationship of temperature anomalies to the surface topography (lows often in close proximity to drainage courses).
In view of those conditions it is extremely doubtful that any temperature effect associated with the mineralized zone would be sufficiently strong to influence the surface measurements made in this area. On the northwest part of the grid layout and over the northern part of the mineralized zone, topographic effects are at a minimum; but even in this part of the area there are no diagnostic changes in temperature gradient over the mineralized zone.
Geochemical Survey
Spectrographic analyses of the Karcher soil samples indicate that the following elements show a quantitative variation in the soil to an extent exceeding any possible analytical error; cobalt, manganese, nickel, lead, and vanadium. Of this group, cobalt and manganese show the greatest range of variation, and lead shows the least.
The cobalt and manganese maps (figs. 46A, 46B) indicate a relative concentration of these metals in the soil over a rather broad area, which includes, but is not confined to, the major portion of the mineralized zone. No such concentration pattern is shown by the lead and nickel maps. The indicated relative concentrations of lead and vanadium are plotted in profile (fig. 39). Concentrations of nickel and cobalt occur along the eastern end of grid line 6. This location is in a slight topographic depression (drainage course) which might have influenced the metallic content of the soil samples taken in this vicinity.
Figure 46—A. Map showing the areal distribution of cobalt in the soil of the Karcher area; B. Map showing the areal distribution of manganese in the soil of the Karcher area.
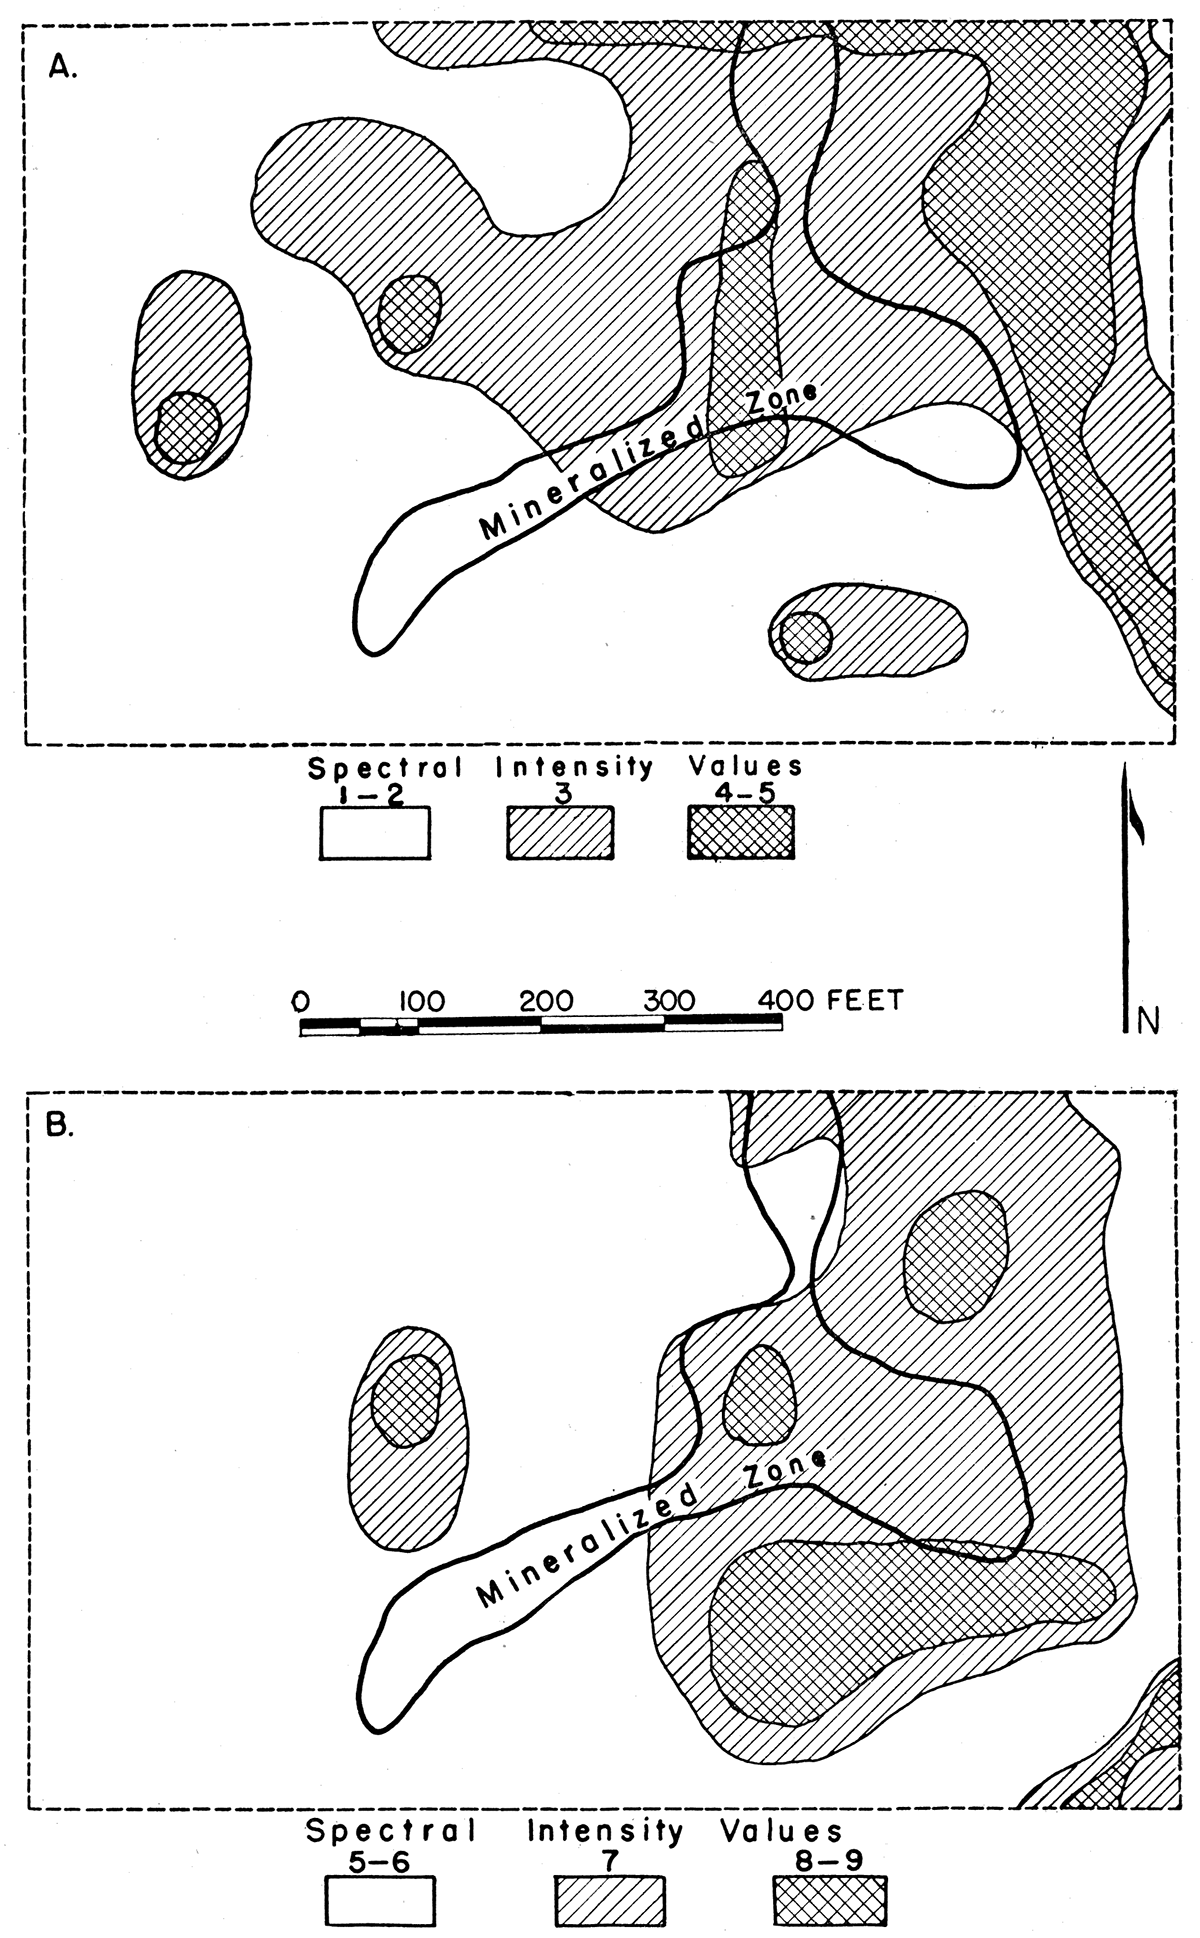
Although some of the indicated increases in metallic content may have been influenced by erosional processes along the drainage courses (e. g., as the above mentioned along the east part of grid line 6 and, possibly, in the northeast corner of the grid layout), no such influence could have accounted for the entire central zone of relatively higher concentrations.
Summary
Table No. 17 gives the ratios of the individual anomalies and of the total range of values to the estimated maximum error in the geophysical values for the Karcher area. Comparison of these figures with those for the Walton area indicates that, in the Karcher area, the range of the geophysical readings is somewhat larger for each method; and, except for gravity and natural potential, the individual anomalies are also larger. As in the case of the Walton area, the resistivity anomalies are the least likely to have been significantly influenced by, observational error.
Table 17—Magnitude of geophysical anomalies—Karcher area. *Ratio of variation from approximate mean average values to the indicated maximum. error in the measurement. (see pp. 37, 89, 40, 42, 46, 46, 61, and 62-77).
| Geophysical Method | Ratio of anomaly to maximum error* |
Ratio of total range of observations to maximum error |
|---|---|---|
| Magnetic | 10 | 15 |
| Gravity | 2 | 12 |
| Natural potential | 2 | 10 |
| Resistivity | 12 | 48 |
| Geothermal | 7 | 15 |
| Geochemical (cobalt and manganese) | 3 | 5 |
The relief on the limestone surface in the Karcher area is so gentle as to eliminate this feature from consideration as primary cause for anomalies in this area. Possible slight influence has been noted at a few places as mentioned previously.
In the resistivity work, well-defined anomalies were observed over the indicated mineralized zone on those traverses which crossed this zone at or near its widest extent (traverses I-I', III-III', IV-IV', and V-V'). On the two traverses which cross narrower zones of mineralization no indicative anomalies were found (traverses II-II', VI-VI'). Traverses in barren area (traverses VII -VII' and extensions of traverse V-V') show very uniform resistivity trends. On these barren area profiles the maximum departure from mean average trend is of the order of 2 percent; whereas, the aforementioned anomalies over the mineralized zone represent departures of from 8 to 10 percent.
From the above, it is indicated that the resistivity anomalies on traverses I-I', III-III', IV-IV', and V-V' are due either to the mineralized zone or to some directly related structural condition which influences the electrolytic properties of the ground in the vicinity of the mineralization. Fracturing and brecciation of a type which might have controlled and influenced the distribution of mineralization might effectively localize conductive electrolytes, which would cause anomalies in ground resistivity.
The failure to find resistivity anomalies over the narrower mineralized zones possibly may be attributed to the absence of electrically conductive sulphide mineralization in sufficient quantity and concentration to cause detectable variations in ground resistivity, less brecciation in the rock surrounding these smaller zones, or low resolving power of the resistivity methods.
The gravity survey indicated a slight gravity minimum in the vicinity of the mineralized zone. It is believed that the decrease in gravity may be due to brecciation in and around the mineralized zone. However, anomalies of this kind are not always diagnostic of mineralization since other minima of equal or greater intensity occur in barren territory beyond the mineralized zone.
The geochemical survey revealed slight concentrations of cobalt, manganese. and vanadium in the soil in the general vicinity of the mineralized zone. This suggests a possible relationship between metallic constituents in the-soil and underlying mineralization. The survey in the Karcher area was too limited to draw definite conclusions from this work alone.
The magnetic, natural potential, and geothermal anomalies observed in the Karcher area appear to be unrelated to structure or mineralized zones.
Swalley Area
Figure 6 shows the locations of the geophysical traverses and stations in the Swalley area. The following geophysical measurements were made: gravity, 41 stations at intervals of 100 feet, along traverses I-I' and II-II'; resistivity longitudinal traverses, at intervals of 50 feet, along traverses I-I', II-II', and III-III'; resistivity depth measurements, at stations 35 and 50, on traverse II-II'; geochemical soil samples, at 68 stations on grid layout.
Geophysical data and results in this area are illustrated in figures 47 to 50.
Figure 47—Profiles along traverse I-I' in the Swalley area, showing gravity and resistivity anomalies, zone of mineralization, and configuration of the top of the limestone.
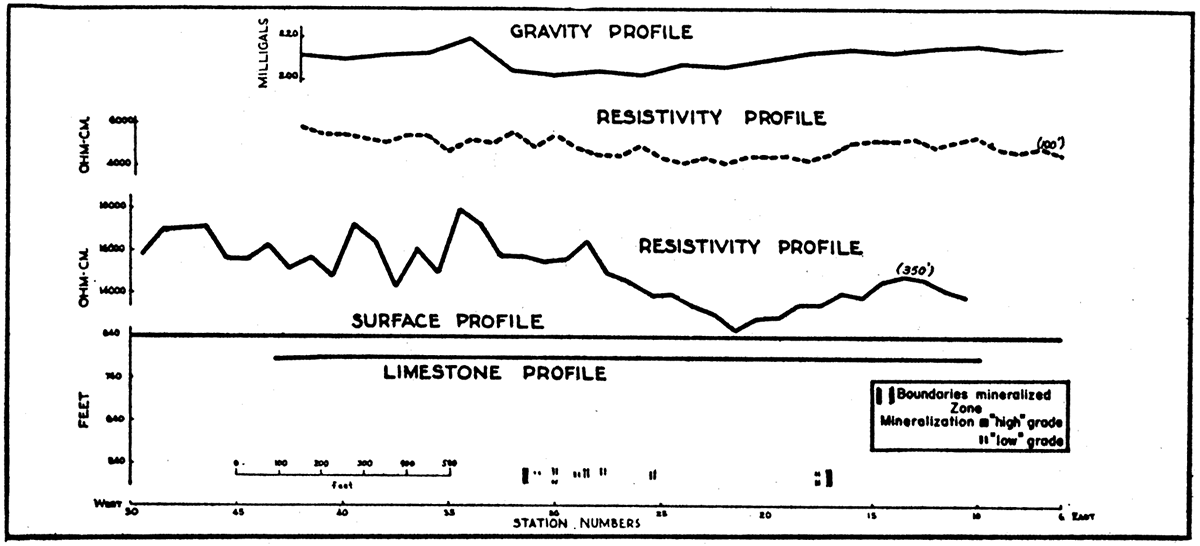
Figure 48—Profiles along traverse II-II' in the Swalley area, showing gravity and resistivity anomalies, zone of mineralization, and configuration of the top of the limestone.
Gravity Survey
Gravity measurements in the Swalley area were taken only along two traverses; hence, the data are insufficient for contour representation. The gravity values on traverse II-II' increase quite uniformly to the southward, showing only slight departure from the estimated regional gradient. On traverse I-I' there is a small gravity minimum between stations 22 to 32 over the west edge of the mineralized zone. The assay values are somewhat higher here than to the east. Since an unknown quantity of material has been removed from the subsurface here by mining operations, it is not possible to draw conclusions as to the significance of this gravity anomaly.
Resistivity Survey
All three resistivity profiles (traverses I-I', II-II', and III-III') show a similar pattern of variations, with the apparent resistivity increasing irregularly toward the north and northwest. None of those variations have any apparent relation to the mineralized zone or to the profile of the limestone surface. They are probably due to lateral lithologic or textural variations either in the comparatively shallow soil, shale cover, or in the underlying limestone. It is to be noted that there is no correspondence between the gravity and resistivity gradients in this area, such as has been noted in some of the other areas (cf., Neutral and Mullen areas, figs. 16, 18, 19).
Resistivity-depth measurements were made at two locations (DS-1, DS-2, fig. 6) to determine whether depth to limestone could he mapped under shallow cover (the shale cover averages 40 to 80 feet in thickness in this area as compared to 175 to 200 feet in the Walton and Karcher areas). Both depth curves show shallow changes in trend indicative of a boundary between a relatively thin conductive layer and an underlying, more resistant formation. In the case of station DS-2 the indicated depth of this change agrees well with the projected depth to the top of the limestone. At station DS-1 the calculated depth is considerably shallower than shown by the projected limestone elevation.
Figure 49—Resistivity depth profiles in the Swalley area.
Geochemical Survey
Analyses of the soil samples from the Swalley area indicate that the following elements vary from station to station to an extent exceeding any possible analytical error; cobalt, manganese, titanium, nickel, lead, gallium, and molybdenum. Except for cobalt, manganese, and titanium, however, the variations are small and consist chiefly of single station anomalies. As in the Karcher area, the cobalt and manganese distributions in the Swalley area are very similar. Titanium shows a smaller range of variation than cobalt or manganese. Figure 50, showing the areal distribution of manganese in the soil, is representative of the geochemical results for this area.
Figure 50—Map showing the areal distribution of manganese in the soil of the Swalley area.
Also, as in the Karcher area, weathering and erosion along drainage courses evidently affects the concentration values. A drainage course runs along the west boundary of the grid layout and crosses the northwest corner. Increased concentrations of cobalt and manganese at the southwest and northwest corners of the grid layout appear to be associated with this surface drainage course. Indicated content of titanium, however, is less along the drainage course than in adjacent area.
The pattern of distribution of these elements in the soil of the Swalley area apparently is unrelated to ore mineralization or .to configuration of the limestone surface. High and low concentration trends cut across the strike of the mineralized zone. Variations in grade within the general mineralized zone show no relationship to the local variations in metallic content of the soils.
Greenback Area
Figure 7 shows the locations of the geophysical traverses and stations in the Greenback area. The following geophysical studies were conducted: gravity, 44 stations at intervals of 100 feet along traverses I-I', and IV-IV'; resistivity longitudinal traverses, at intervals of 50 feet along traverses I-I', II-II', III-III', and IV-IV'; resistivity depth measurements, at station DS-1 to DS-4 on traverse I-I', DS-5 on traverse II-II', DS-6 on traverse III-III', and DS-7 on traverse IV-IV'; geothermal, 42 stations on traverses I-I' and IV-IV'; geochemical, 84 stations on traverses I-I', II-II', III-III', and IV -IV'.
Figure 51—Profiles along traverse I-I' in the Greenback area, showing gravity, resistivity, geothermal, and geochemical anomalies, zone of mineralization, and configuration of the top of the limestone.
Figure 52—Profiles along traverse IV-IV' in the Greenback area, showing gravity, resistivity, geothermal, and geochemical anomalies, zone of mineralization, and configuration of the top of the limestone.
Gravity Survey
Neither of the two gravity traverses show anomalies in the vicinity of the indicated zones of mineralization. On traverse I-I' slight gravity minima are present at stations 36 to 38 and stations 16 to 20.
On traverse IV -IV' a gravity minima occurs at stations 10 to 12. The gravity gradient is flat over the locations of the mineralized zone, but increasing values are noted at the east end of the traverse.
Resistivity Survey
Large resistivity variations were found along all of the traverses in this area. Particularly strong anomalies are present along traverses I-I' and III-III'. Comparison of the shallow and deep resistivity profiles for traverses I-I' and IV -IV' indicates that shallow geologic conditions are responsible for these anomalies.
Available drill hole data are insufficient to allow detailed correlation of all of the observed anomalies. Depth measurements along traverse I-I' were made, therefore, for two purposes: (1) to secure information to help explain the traverse resistivity anomalies, and (2) to determine whether the top of the limestone could be mapped in this manner. This work indicated slightly greater depths to the top of the limestone at the locations where the resistivity profile shows resistivity lows (DS-1, DS-4, corresponding to stations 35 and 18, respectively, in traverse I-I'). It has been noted that gravity minima are found at these same locations on this traverse. It would appear from the depth measurements that the resistivity variations are due to variations in depth to the limestone. The size of the variations and the presence of gravity minima, however, would seem to require a more pronounced physical change in the subsurface than slight changes in elevation of the limestone contact. It is probable, therefore, that brecciation and fracturing with, perhaps, cavernous conditions and attendant slump age in the limestone are contributary causes for the observed resistivity and gravity anomalies. A possible "sink hole" is indicated near the west end of traverse IV-IV' near the location of a gravity minima (stations 10-12, traverse IV-IV', as previously described).
None of the anomalies appear to be due to the effect of the mineralized zone or its structural environment.
Figure 53—Resistivity depth profiles in the Greenback area.
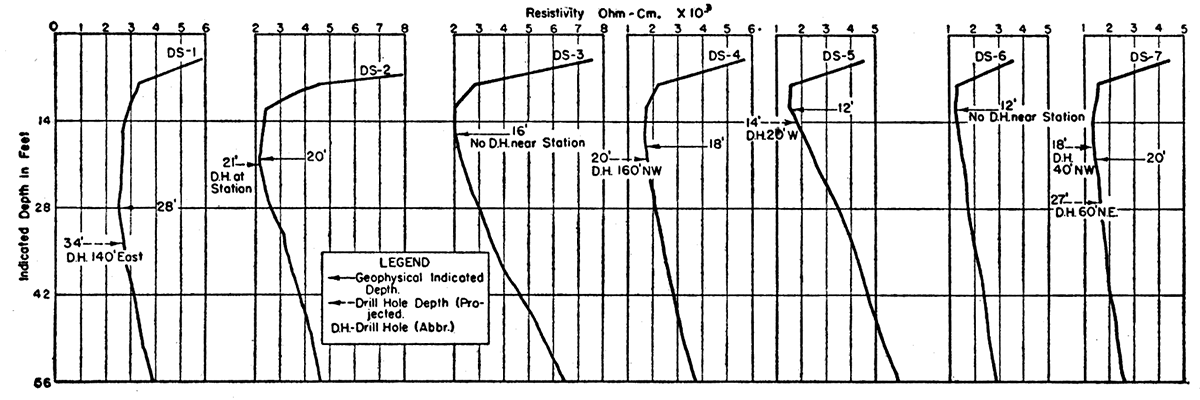
Geothermal Survey
The geothermal profiles (traverses I-I', IV-IV') exhibit general trends that are similar to the resistivity profiles, indicating the influence of the same structural conditions (compare with the Neutral area, fig. 16). The temperature values are too erratic, however, to be of any diagnostic value in this area.
Geochemical Survey
Analyses of the Greenback soil samples indicate that the following elements vary to an extent exceeding any possible analytical error: cobalt, manganese, vanadium, and lead. The distribution of these metals along traverses I-I' and IV-IV' is shown in the accompanying profiles (figs. 51, 52).
The distribution seems to be quite random and no relationship to mineralized zones or structure is apparent. On some of the traverses the positions of the mineralized zones coincide with the location of relatively high concentrations of the above elements. At other locations lower concentrations occur over the indicated mineralized zones. The variations in the barren parts of the area are as pronounced as those above the mineralized zones.
McBee-Martin Area
Figure 8 gives the locations of the geophysical traverses and stations in the McBee-Martin area. Geophysical measurements were made as follows: gravity, 34 stations at intervals of 100 feet along traverses I-I' and II-II'; resistivity longitudinal traverses, at intervals of 50 feet along traverses I-I' and II-II'; resistivity depth measurements, at station DS-1 (at station 25, on traverse I-I'); geothermal, 17 stations, at intervals of 100 feet along traverse I-I'.
The results of these measurements are given in figures 54 and 55.
Figure 54—Profiles along traverse I-I' in the McBee-Martin area, showing gravity, resistivity, and temperature anomalies, zone of mineralization, and configuration of the top of the limestone.
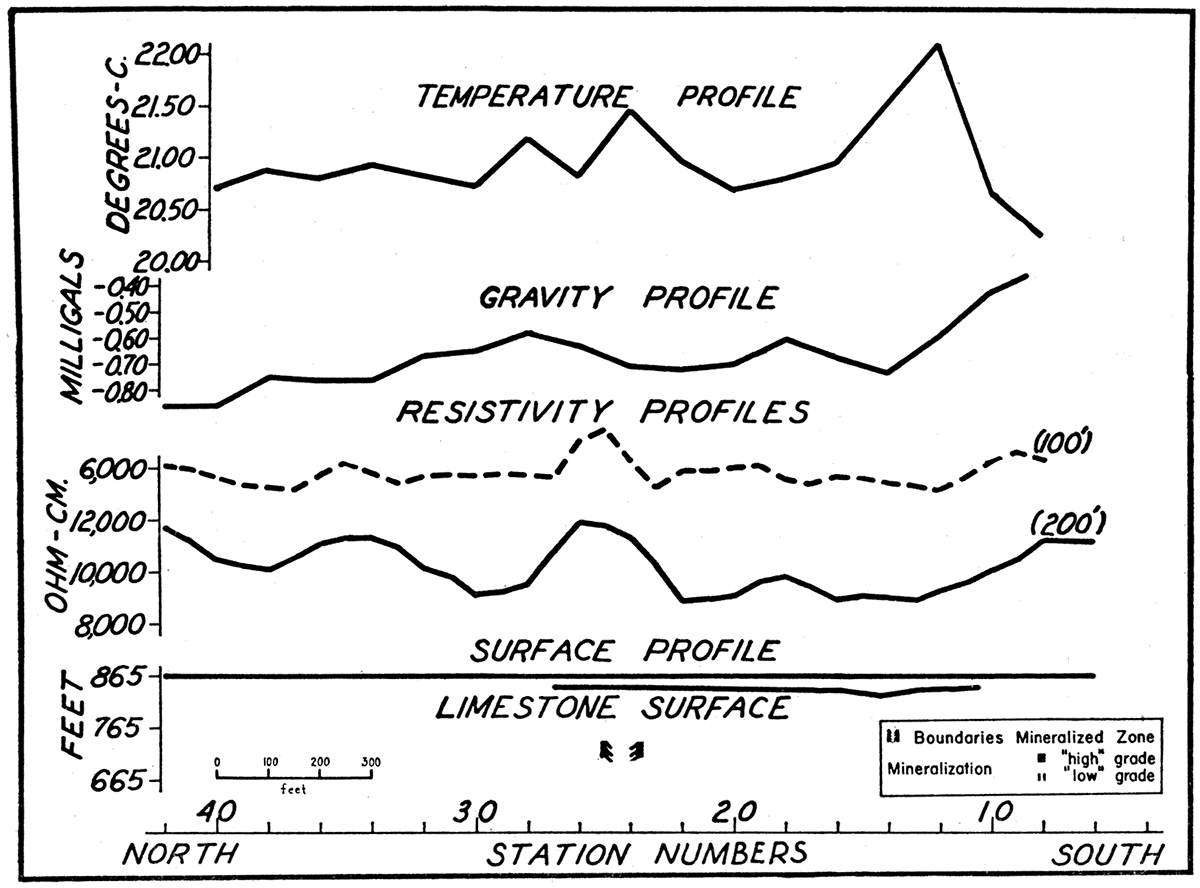
Figure 55—Profiles along traverse II-II' in the McBee-Martin area, showing gravity and resistivity anomalies, zone of mineralization, and configuration of the top of the limestone.
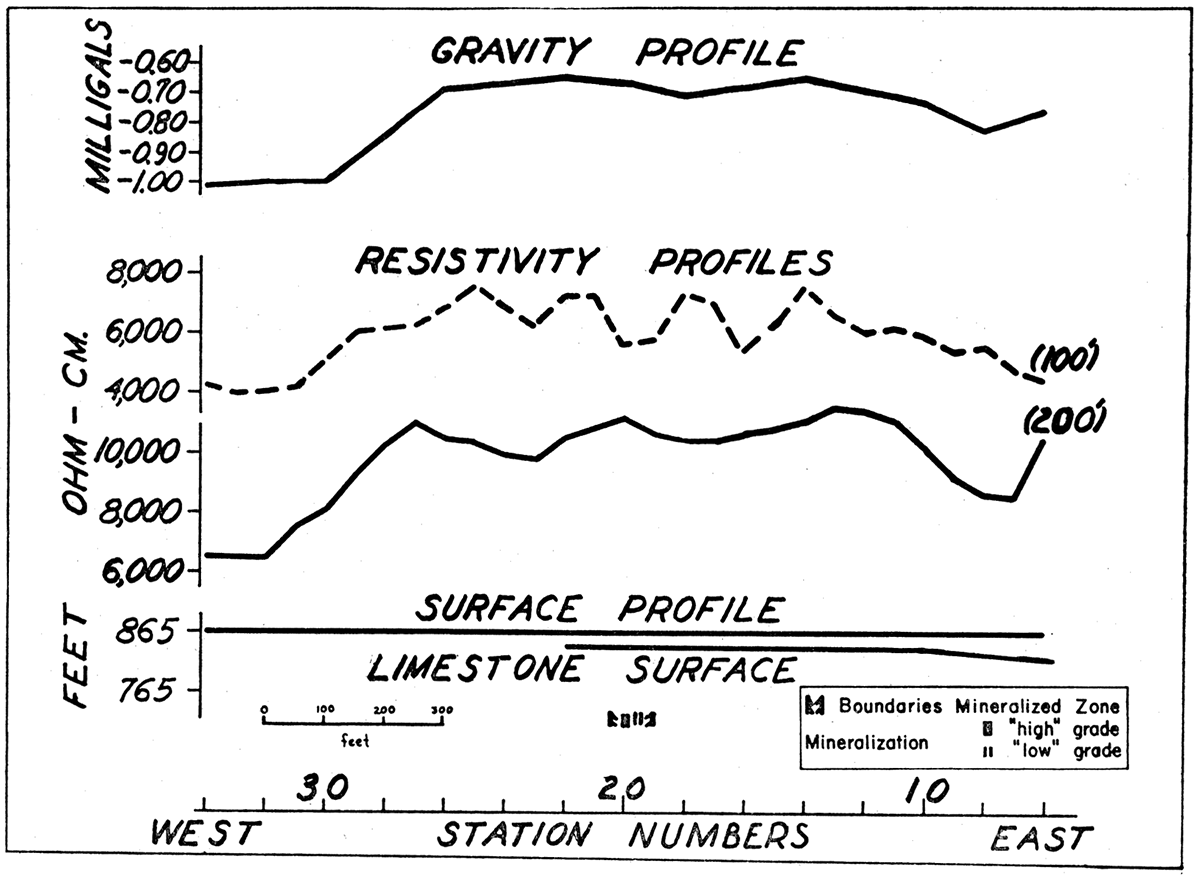
Results of Gravity, Resistivity, and Temperature Measurements
Analysis of the geophysical data for this area has disclosed no relationships between the geophysical anomalies and the mineralized zone. The variations in geophysical values appear to be the result of near-surface structural and lithologic changes that are unrelated to the ore mineralization.
Logs for drill holes in the area indicate not only variable depths (20 to 40 feet) to the limestone, but variations in the character of the material overlying the limestone. The presence of Tertiary gravel is indicated by some of the logs. According to the logs, shale is present at some places. At other places soil and clay lie directly upon the limestone. Lateral lithologic variations of this kind plus cavernous or brecciated conditions in the limestone are believed to be responsible for the anomalies observed in this area, but it is not possible to correlate the anomalies in detail due to inadequate geologic information.
On traverse I-I' a resistivity high occurs over the mineralized zone on both shallow and deep curves, indicating the probable influence of lithologic variation rather than the effect of mineralization.
A temperature high also occurs at this location; but it is probably due to the same structural condition causing the resistivity anomaly rather than to any effect of the mineralized zone, since an even stronger temperature anomaly occurs at station 12 in barren territory.
The gravity profile shows a number of irregular variations which might have been influenced in part by the surface caves in this vicinity. No correlation with the mineralized zone is apparent.
The gravity and resistivity profiles on traverse II-II' are very similar in appearance. No correlation with the mineralized zone is indicated. The lows on the east end of the traverse appear to be related to the increased depth to the limestone at this location as shown by the structure profile. A similar structural condition is probably present on the west end of the traverse, as indicated by the resistivity and gravity values.
Resistivity depth measurements gave results similar to those obtained in the Greenback area, and indicate that, at shallow depths, the top of the limestone can be mapped by these measurements.
Summary and Coordination of Geophysical Results
Factors Influencing Interpretations
In the Tri-State geophysical investigations, the problem of interpretation was two-fold: (1) to indicate anomalies due to structural conditions, whether related or unrelated to the mineralized zones, and (2) to indicate anomalies due either directly to ore mineralization or to structural conditions that are related to the occurrence of ore mineralization. The regional survey and the studies in the Neutral, Mullen, and Jarrett areas were concerned, primarily, with the structural problem; whereas, the work in the Walton, Karcher, Swalley, Greenback, and McBee-Martin areas was concerned, for the most part, with the problem of mineralization.
In making interpretations, it was necessary to consider a great many geological factors that might influence the geophysical values. Chief among these are the following: depth and configuration of the pre-Cambrian basement, depth to limestone, relief of the limestone surface, porosity of the limestone (i. e., whether massive or brecciated), type of formation overlying limestone (i. e., whether soil, Tertiary gravel and clay, or shale), topography and surface drainage courses, ground water conditions, form of mineralized zones (i. e., whether "run" or "sheet ground"), type of mineralization (i. e., ratio of galena to sphalerite), size of mineralized zone, and grade or ore mineralization (see pp. 17-22, 23-32, 77-82).
The amount and detail of available geological information varies among the different areas. In the Neutral area, drill hole information is not available in the immediate vicinity of the geophysical studies. In other areas, the available information is sufficient to permit the plotting of contours on the limestone surface and the drawing of generalized outlines of the mineralized zones.
The geophysical interpretations represent deductions which consider: (1) information from local drilling and (2) knowledge of general geological conditions in the district.
Regional Magnetic and Gravity Investigations
Regional magnetic work (including the work of the Missouri Bureau of Mines) has shown that prominent magnetic anomalies occur over a wide territory, including some of the ore producing districts. These anomalies evidently are influenced by magnetic variations both in the basement rocks and in the overlying sediments, the relative effects of which it is impossible to determine from magnetic work alone.
In this survey only a relatively small area was covered by both magnetic and gravity work. A comparison of the results (approximate coincidence in location of magnetic and gravity highs in the Quapaw-Hockerville area, figs. 9, 10) indicates that,' at this particular location, the gravity and magnetic anomalies are the result of structural or lithologic variations in the pre-Cambrian basement.
Investigations in Local Areas
Magnetic Survey
In the Walton area a magnetic low occurs over the mineralized zone in the north part of the area. In all of the other areas, the magnetic data show no correlation to structure or to mineralized zones. The cause of the anomaly in the Walton area is not known, but that it is actually related to the mineralized zone seems doubtful, from theoretical considerations. The apparent agreement in location between the magnetic anomaly and the mineralized zone may be a coincidence.
The preponderance of evidence indicates that neither the mineralized zones nor significant local structure in the sediments (e.g., configuration of the surface of the limestone) influences the earth's magnetic field under conditions exemplified by the territory studied in this work. Magnetic anomalies which apparently are due to relatively near surface lateral lithologic variations were noted in both the regional and local surveys.
Gravity Survey
Gravity minima are indicated over depressions in the limestone surface at the following locations: over the Miami trough in the Mullen area, in the Jarrett area, in the McBee-Martin area, in the Greenback area, and probably in the Neutral area. At all of these locations (except the Jarrett area in which no resistivity measurements were made) there is close coincidence and similarity between the gravity and resistivity anomalies. This is especially well shown by the comparison between the resistivity and corrected gravity profiles in the Neutral area (fig. 16). This similarity between the gravity and resistivity anomalies indicates that the local gravity anomalies are due, primarily; to relatively shallow subsurface condition in the sedimentary section. With the possible exception of the Miami trough, however, the amount of relief on the limestone surface appears to be insufficient to cause anomalies of the observed magnitude, since the specific gravity of shale ordinarily is but slightly less than that of limestone. It is indicated, therefore, that brecciation and cavernous conditions associated with slumped' zones or depressions in the limestone surface are influential in causing the gravity lows. Either a thickening of the shale cover or increased porosity in the underlying limestone could reduce the average density of local portions of the subsurface sufficiently to cause the observed gravity minima. It seems probable, however, that, in most cases, these conditions are so intimately related in the subsurface that determination of the relative influence of each would be most difficult.
The results of the gravity measurements in the mineralized areas may be summarized, briefly, as follows: In all cases the gravity anomalies in the general vicinity of the mineralized zones are smaller than the anomalies found over known structural variations (e. g., the Miami trough). In a few cases (e. g., traverse X-X', Walton area, fig. 30), gravity minima coincide with the location of the mineralized zones. In the Walton, Karcher, and Swalley areas, in which the mineralized zones are the most extensive, gravity minima are not confined to the trends of mineralization. Minima of equivalent intensity are found outside of the areas of, mineralization. In the Greenback and McBee-Martin areas, gravity anomalies show no relationship to mineralized zones.
Natural Potential Survey
In the Neutral area higher potential values were found at locations showing resistivity and gravity minima. In the other areas, no apparent correlation was found between the natural potential values and either structure or mineralized zones. The following conditions probably are mainly responsible for the natural potential anomalies: (1) oxidizing iron disulphides unrelated to ore mineralization, (2) non-uniform distribution of electrolytes in the subsurface, and (3) irregular distribution of moisture at the surface (perhaps influenced by topography).
Resistivity Survey
The resistivity measurements were influenced chiefly by portions of the subsurface extending from the surface to a depth of approximately 400 feet. The measurements, therefore, are influenced primarily by relatively shallow geological conditions; whereas, the gravity and magnetic measurements are without depth control and are influenced by both shallow and the larger, deeper structures. It was helpful, in the interpretations, to utilize the resistivity anomalies as a guide or comparison, in order to indicate the relative importance of shallow and deeper structural influences in causing other geophysical anomalies.
It is well recognized that any of the resistivity methods and the so-called potential-ratio methods, employing a pair of energizing electrodes and a pair of potential electrodes, are unsuitable for detection of small subsurface bodies. This unsuitability is due chiefly to their poor resolving power caused by the large spreads of the surface electrodes.
Variations in subsurface resistivity were found in all of the areas investigated. In the Mullen area, well-defined resistivity lows are associated with the Miami trough (figs. 18 to 20). The resistivity low in the Neutral area is also attributed to a probable depression in the limestone surface (fig. 16). In the McBee-Martin area, a resistivity low on the east end of traverse II-II' coincides with a depression in the limestone surface (fig. 55). The occurrence of resistivity lows over depressions in the limestone surface is well established by these examples and by other examples that have been mentioned in the discussions of the separate areas.
Some very pronounced resistivity variations occur in the Greenback area (e. g., traverse I-I', fig. 51). Geologic control is inadequate for detailed correlations in this area; but, in general, the lower resistivity values appear to be associated with depressions in the limestone surface. In this area, however, the amount of relief on the surface of the limestone appears to be insufficient, alone, to account for the magnitude of the anomalies. Evidence from the gravity survey indicates that brecciation and cavernous conditions are probably present in the limestone. With or without thickening of the overlying shale, the increased porosity due to brecciation or cavernous conditions would result in the lowering of the average resistivity values.
The resistivity depth results indicate that, under favorable conditions, the depth to limestone can be determined by these measurements (figs. 22, 36,45,49, 53).
The results of resistivity measurements that were conducted along traverses in the mineralized areas are summarized briefly as follows:
In the Walton area (deep run-type mineralization, 300 to 350 feet deep, medium to high grade, relatively high lead:zinc ratio, shale cover 175 to 200 feet deep) , six of the eight resistivity traverses that cross the mineralized zone show resistivity lows that agree closely in location with the indicated outlines of the mineralized zone. A resistivity traverse in probably barren area (traverse IV-IV') shows resistivity lows of approximately the. same intensity as those over the mineralized zones (p. 118).
In the Karcher area (deep run-type mineralization, 350 to 400 feet deep, medium to high grade, relatively little galena, shale cover 200 to 220 feet deep), all traverses that cross the central, widest (200 to 275 feet) zone of mineralization show well-defined resistivity lows over the mineralized zone. Traverses in barren ground (traverse VII-VII' and portions of traverses V-V') show no variation. However, a resistivity low at stations 10 to 12 (south) on traverse IV -IV' appears to be outside. of the mineralized zone. On the traverses that cross the narrower portions of the mineralized zone, no resistivity. variations were observed over the mineralized zones (p. 131).
In the Greenback area (shallow run-type mineralization, 150 to 200 feet deep, low grade, very little galena, soil-shale cover 15 to 70 feet deep), the resistivity anomalies show no correlation with the ore mineralization. Available drilling information indicates that the mineralized zone is relatively narrow.
In the McBee-Martin area (shallow run-type mineralization, 100 to 160 feet deep, medium to high grade, relatively little galena, overburden 20 to 40 feet deep), the resistivity anomalies show no correlation with the ore mineralization. Available drilling information indicates that the mineralized zone is relatively narrow.
Geothermal Survey
In a few cases, temperature minima appear to be related to depressions in the limestone surface (e. g., profile II-II' in the Mullen area, fig. 19; profile I-I' in the Greenback area, fig. 51; and the Neutral area profile, fig. 16, all of which show some similarity to the resistivity profiles). Consistent structural correlation has not been found, since, in other cases, the temperature variations do not reflect subsurface structure (e. g., traverse I-I' in the Mullen area, fig. 18).
No definite correlation between temperature anomalies and mineralized zones was found in any of the areas. Additional work would be necessary. in the Walton area to determine whether the slightly higher temperature values in the central part of the area have any relationship to mineralization.
The geothermal data are strongly affected by surface topography and drainage.
Geochemical Survey
Only in the Karcher area is there any evidence of a possible relationship between the mineralized zone and the relative distribution and concentration of metallic elements in the soil (fig. 39). This apparent correlation is very general.
In several of the areas, distribution of the indicated metallic elements appears to be influenced by weathering and erosion along surface drainage courses.
Conclusions
In the geophysical methods which were employed in these investigations, the most prominent anomalies are the result of: (1) relatively shallow structural conditions (e. g., configuration of the limestone surface and brecciation, fracturing, or cavernous conditions in the limestone), (2) near surface lithologic variations (e. g., variations in the shale or other formations overlying the limestone), or (3) topography and surface drainage.
It has been demonstrated in particular, by the Neutral area anomalies, that relatively shallow structural conditions which probably are unrelated to ore mineralization may cause anomalies in any of the various types of geophysical measurements employed in this work.
In this Tri-State region the effects of near-surface variations are especially important in the natural potential, geothermal, and, geochemical methods and are present to smaller extents in the magnetic and resistivity data. The natural potential, geothermal, and geochemical methods, therefore, are of doubtful value for either the determination of structure or for direct location of mineralized zones.
In the resistivity measurements the effect of surface drainage is negligible. Near-surface lithologic variations are responsible for resistivity anomalies in many cases (e. g., the Swalley area profiles; the east end of traverse V-V', in the Karcher area). The effects of these variations ordinarily can be evaluated by employing double-depth traverses (pp. 46, 47).
The magnetic and gravity values, when influenced by near-surface variations, are of small lateral extent and readily apparent on a plot of the traverse readings.
Coincident resistivity and gravity minima related to the configuration of the limestone surface and to the physical character of the upper portion of the limestone (whether of massive fractured, brecciated, or cavernous character) are found in the Neutral, Mullen, Greenback, and McBee-Martin areas. In the Walton and Karcher areas, similar coincident resistivity and gravity minima are found. In the latter areas, since the relief of the limestone surface is very gentle, the minima are probably due to increased porosity in the limestone. These results indicate that both resistivity and gravity work are useful in locating depressions in the limestone surface as well as zones of increased porosity. The problem of determining the relative influence of these two effects at a particular location will be difficult without geologic control of a nature to indicate the probable depth to the limestone. Under favorable conditions resistivity-depth measurements can supply information that will aid in this differentiation. Such measurements are of especial importance in areas of shallow cover, where the influence of equivalent relief on the limestone surface is relatively larger than in areas of deeper cover (cf., resistivity and gravity anomalies in the Walton and Karcher areas with those in the Greenback and McBee-Martin areas).
In a few cases both gravity and resistivity lows occur over the mineralized zones. The resistivity lows are much more frequent and more consistent than the gravity lows. Resistivity anomalies are present only over mineralized zones of considerable width (100 to 300 feet, e. g., Walton and Karcher areas). No effects are discernible over narrower mineralized zones (e. g., Karcher and Greenback areas) even though they are of relatively high grade (e. g., McBee-Martin area). This is due, as previously mentioned, to the low resolving power of all methods employing surface potential measurements.
The following lines of evidence support the belief that these resistivity lows are due to increased porosity of the limestone rather than to the direct conductive effect of sulphides, although the increased porosity may be due to brecciation indirectly related to mineralization: (1) Coincident resistivity and gravity lows occur over areas in which shale thickening and brecciation are known to exist; (2) Coincident resistivity and gravity lows occur over areas which are indicated by drilling to be devoid of ore mineralization; and (3) The resistivity anomaly over the Karcher sphalerite zone is just as pronounced as the anomalies over the Walton mineralized zone which has a relatively high content of galena, although sphalerite is generally a poor conductor and galena a good conductor,
From the gravity work in the mineralized areas, it may be concluded:
- The gravity anomalies mapped in this work are not directly related to ore mineralization.
- In a few instances, gravity minima appear to be due to the 'effects of brecciation or cavernous conditions which are directly related to the mineralized zones.
- Presence or absence of gravity minima are not conclusive evidence of the presence or absence of mineralized zones.
From the resistivity work in the mineralized areas it may be concluded that:
- Resistivity anomalies probably are not directly related to the ore mineralization.
- When the mineralized zones are of sufficient size (comparable to those in the Walton and Karcher areas) resistivity lows frequently may be related indirectly to the mineralized zone, as a result of the conductive effect of water-saturated zones of brecciation or fracturing in the limestone. Comparison of the gravity and resistivity data indicates that brecciation, fracturing, or cavernous conditions of insufficient extent to cause gravity anomalies, may, however, be extensive enough to cause detectable changes in resistivity.
- Presence or absence of resistivity minima are Dot conclusive evidence of the presence or absence of mineralized zones. However, brecciation, fracturing, and cavernous conditions related to mineralization are more likely to cause resistivity lows than gravity lows.
Regional Geological Implications of Geophysical Data
The geophysical data show several features that appear to be of interest from the point of view of regional geology. For example, the resistivity measurements show a sharp resistivity low over the Miami trough. The gravity low is of practically the same areal extent as the resistivity low; and there is no discernible magnetic anomaly. These relationships indicate that the Miami trough is a relatively shallow structure and is not reflected in the basement.
The regional gravity survey, considered with the regional magnetic survey and with the earlier magnetic work of the Missouri Bureau of 'Mines, indicates that the configuration of the pre-Cambrian basement is very irregular. Further gravity work, however, will be necessary before it is possible to state whether there are any regional correlations between gravity anomalies and areas of zinc or lead mineralization.
The lack of correlation between geothermal or natural potential anomalies and intensity of lead and zinc mineralization gives added evidence to the small amount. of sulphide oxidation in the ore bodies.
The geochemical data appear to indicate either that there was no consistent permeation of the mineralizing solutions into the Cherokee shale above the zones of lead and zinc deposition, or, if such permeation occurred, that there was no consistent sequence of metallic deposition such as would be represented by differential metallic concentrations in the soil above zones of mineralization. The chemical complexity of the ordinary soil attests to the fact that the major differences between metallic concentrations are quantitative rather than qualitative.
Prev Page—Geological Basis || Next Page—Evaluation, References
Kansas Geological Survey, Geology
Placed on web Oct. 29, 2018; originally published December, 1942.
Comments to webadmin@kgs.ku.edu
The URL for this page is http://www.kgs.ku.edu/Publications/Bulletins/44/07_interp.html