![]()
Prev Page--Geochemistry || Next Page--Summary
Development of the Aquifer
Water-Supply Suitability Areas
Development of the Dakota aquifer has been dependent on both the physical characteristics of the aquifer (transmissivity of and depth to the aquifer, confined versus unconfined nature) and the chemical characteristics of the groundwater (primarily TDS concentration). The substantial variability in both the physical characteristics and water quality of the aquifer across Kansas strongly influences the suitability of the aquifer as a source for water supply. Five types of water-supply suitability areas have been defined primarily on the basis of their physical hydrogeologic characteristics and, secondarily, on their water-quality characteristics (fig. 30). One of these areas is subdivided according to the salinity of the groundwater. The five suitability areas are a modification of the six areas originally described in Macfarlane (1997b).
Figure 30--Map of the five water-supply suitability areas of the Dakota aquifer in Kansas.
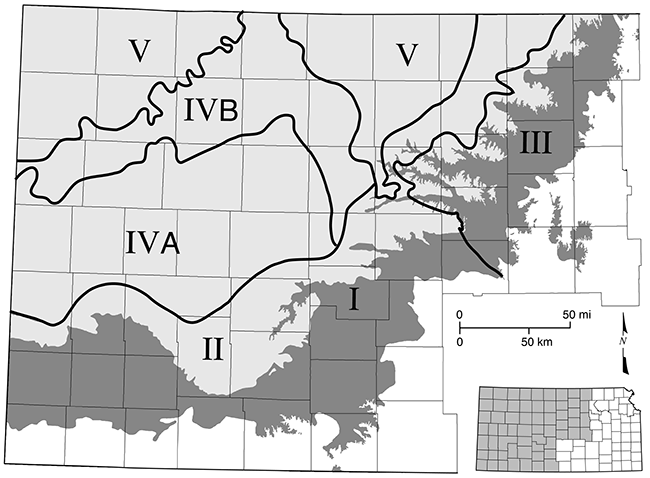
Suitability Area I
Suitability Area I (fig. 30) encompasses the region where the Dakota aquifer is hydraulically connected to the overlying High Plains or alluvial aquifers in southwestern and south-central Kansas (fig. 2). The southwest Kansas part of this suitability area contains the greatest number of water-right-permitted wells completed partially or solely in the Dakota aquifer (fig. 3). Only the western reaches of the south-central part of Suitability Area I are used for water supply (fig. 3). The HPA is thick enough and water tables have been stable enough in most of south-central Kansas that the Dakota aquifer is not used. Dakota strata also thin across south-central Kansas toward the eastern extent of the Dakota aquifer and could contain saline water from the underlying Permian strata in this area. Where the HPA is thickest in southwest Kansas, the depth to the top of the Dakota aquifer is more than 500 ft (152 m). In western Stanton, western Morton, and southern Hamilton counties, the HPA is absent or is very thinly saturated and the Dakota aquifer (with some Morrison-Dockum strata contributing in Stanton and Morton counties) is the primary shallow aquifer.
Groundwater in the upper Dakota aquifer is fresh throughout nearly all of Suitability Area I (fig. 30). In this suitability area, the Dakota is used for irrigation, municipal purposes, stock, and industry (fig. 4), with the greatest use volume for irrigation (fig. 8). However, groundwater chemical quality is variable in the lower Dakota aquifer because of the small amount of freshwater recharge that passes through the Kiowa shale aquitard. The TDS and chloride concentrations can exceed 2,000 mg/L and 500 mg/L, respectively, in some parts of the lower Dakota (levels too high for irrigation and human consumption but usable for livestock). Nearer the Kansas-Colorado border and the southern extent of the Dakota aquifer in southwestern Kansas, the lower Dakota contains freshwater because of its proximity to the regional recharge area in southeastern Colorado and local recharge from the HPA.
Pre-development conditions indicate that the HPA was naturally recharged by the Dakota aquifer in Stanton, Morton, and Grant counties. To the east, the Dakota was recharged by the HPA under pre-development conditions. Water-level declines in the Dakota aquifer from development are generally less than 50 ft (15 m) but can be greater in portions of Suitability Area I. The Dakota and High Plains aquifers are generally hydraulically connected, so they largely behave as a single system over extended time in this area. Thus, water levels might be expected to drop in the future where both the HPA and Dakota aquifer are heavily used (fig. 3). Water-management policies developed for one of the aquifers will eventually have an impact on the other. Consequently, it is appropriate to consider both aquifer systems together in policy development.
Suitability Area II
In Suitability Area II (fig. 30), the Dakota aquifer is confined (or partially confined immediately adjacent to the outcrop/subcrop belt) by the Upper Cretaceous aquitard. This area is adjacent to Suitability Areas I and III. Recharge from overlying sources can be a significant component of the flow in the Dakota where the confining layer is thin and relatively permeable. However, in southwest and south-central Kansas near the edge of the confined boundary, the primary source of recharge to this part of the Dakota under pumping conditions is from the High Plains or alluvial aquifers where the Dakota is hydraulically connected to one of these aquifers.
Many wells tap the Dakota aquifer for a variety of uses in the part of Suitability Area II in southwest Kansas and part of south-central Kansas (fig. 4) that contains freshwater. Use of the Dakota for irrigation is more common in Hodgeman and northern Ford counties than in other counties in this area. The wells in the western part of Suitability Area II tend to be completed only in the Dakota aquifer rather than both the HPA and Dakota as in much of the southwest Kansas portion of Suitability Area I. The depth below the surface to the top of the Dakota aquifer is less than 400 ft (120 m) over most of Suitability Area II. Water-level declines from development are generally less than 50 ft (15 m).
Groundwater in the upper Dakota aquifer is fresh (TDS less than 1,000 mg/L, chloride less than 250 mg/L) over the southwest Kansas portion of the region (figs. 17 and 18). However, the central and north-central parts of this subunit are located near the regional discharge area of the Dakota and the Cedar Hills Sandstone-Upper Salt Plain aquifers (fig. 2) and the Lower Dakota confining layer is not present. Saltwater intrusion into the lower and then the upper Dakota aquifer is widespread. Groundwater salinity increases substantially with depth and little groundwater is used. Groundwater salinity in the lower Dakota in the western part of Suitability Area II is estimated to be less than 5,000 mg/L and in the eastern half to be substantially greater than 5,000 mg/L.
Suitability Area III
In the eastern part of Suitability Area III (the main portion of the area), the Dakota is a shallow unconfined aquifer or is in contact with stream-aquifer systems (figs. 2 and 30). In the westernmost part of the area, the Dakota is confined and the Upper Cretaceous aquitard is thin and relatively permeable. In the confined part of this area, the depth below the surface to the top of the Dakota aquifer is generally less than 150 ft (46 m). Where the Dakota is unconfined, recharge has been estimated at a few tenths of an inch per year (Wade, 1992). The aquifer is used for a variety of water-right-permitted purposes and is also usually the main water source for domestic wells. Irrigation use is concentrated primarily in southwestern Washington, eastern Cloud, and northern and central Ottawa counties where the thickness and permeability of sandstone units are generally greater than in other portions of the unconfined aquifer in this suitability area (figs. 4 and 8).
Groundwater quality in the upper part of the Dakota aquifer is locally variable throughout Suitability Area III, although fresh over most of the unconfined upper Dakota (fig. 17). In some areas, especially the confined parts, not all of the high chloride water has been flushed from the aquifer by freshwater recharge (fig. 18). Salinity generally increases with depth into the lower aquifer in the confined portions and increases in the unconfined aquifer near some of the larger streams that cross the area as a result of groundwater discharge of deeper saline water in the Dakota. Water-level declines from development in Suitability Area III are believed to be less than 20 ft (6 m). Continued declines from further development could reduce discharge from the Dakota aquifer to streams and increase lateral movement of groundwater from the confined to the unconfined Dakota aquifer from west to east.
Suitability Area IV
In Suitability Area IV (fig. 30), the thickness of the Upper Dakota confining layer ranges from less than 200 ft (61 m) in southeast Ellis County up to 600 ft (180 m) in Hamilton County along its south boundary. Along the northern boundary with Suitability Area V, the confining layer thickness ranges from approximately 600 ft (183 m) in southeastern Rooks County to 2,000 ft (610 m) along the Kansas-Colorado border in Wallace County. The confined Dakota aquifer in this area receives negligible freshwater recharge from overlying sources. The major source of freshwater is flow from the regional recharge area in southeastern Colorado.
TDS concentration in the upper Dakota aquifer generally increases northeastward from less than 500 mg/L to 1,500 mg/L in Suitability Area IVA and from 1,500 mg/L to 10,000 mg/L in Suitability Area IVB (fig. 17). In general, the upper Dakota is more saline with depth to the north and east. TDS concentration in the lower Dakota aquifer is probably greater than 2,000 mg/L and could exceed 10,000 mg/L in the far northern and eastern parts of the suitability area.
Although water quality in Suitability Area IVA is acceptable for most uses, the number of water-right-permitted wells is regionally sparse (fig. 4) because of the greater depth to and lower permeability of sandstone units in the Dakota aquifer than in Suitability Areas I-III. Most of the water use from water-right-permitted wells in the Dakota is for livestock, followed by municipal purposes (fig 8). Water-level declines from development are probably less than 50 ft (15 m) in Suitability Area IVA due to its limited use. However, pumping rates are expected to greatly exceed recharge from overlying sources. As a result, pumping may locally deplete the aquifer if wells and wellfields are spaced too closely together. In Suitability Area IVB, the water quality is too saline for direct use. However, Hays has six municipal supply wells in the Dakota aquifer that produce saline water (chloride concentration generally in the range of 570-700 mg/L) that is mixed with freshwater sources from alluvial aquifers.
Suitability Area V
In Suitability Area V (fig. 30), the Dakota aquifer is confined by a substantial thickness of Upper Cretaceous strata and contains saline or "mineralized" groundwater, defined by state statute as water containing more than 5,000 mg/L chloride or more than 10,000 mg/L TDS. Mineralized groundwater is considered unusable or undesirable for most uses except oil and gas operations (such as secondary recovery) and is not protected by state and local regulations. In the northwest Kansas part of Suitability Area V, the Dakota receives negligible freshwater recharge from overlying sources, flow rates are very low, and the depth to the top of the Dakota exceeds 1,500 ft (460 m). In the eastern part (between Suitability areas IVB and II), vertical and lateral flow rates through the aquifer are higher than in northwestern Kansas and the top of the aquifer is fewer than 500 ft (150 m) below the surface. However, the flow of freshwater through the aquifer has been insufficient to flush the saltwater from the aquifer where it is hydraulically connected to the Cedar Hills Sandstone.
Recent Development Trends
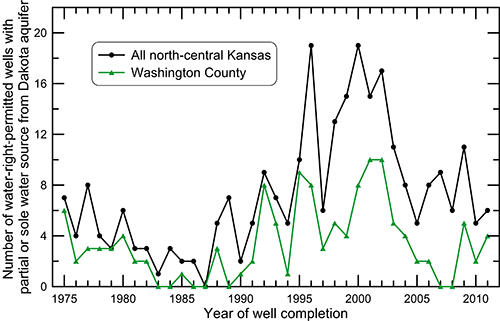
One approach to characterizing recent development of the Dakota aquifer is to determine the temporal trend in the number of new water-right-permitted wells estimated to be completed partially or solely in the aquifer. This was done using the approach described in the Location and Amount of Water Use section of this bulletin. For the five counties in the north-central Kansas region, 191 well logs (51%) were found for the 371 active points of diversion (active water rights and water use). Information in WIMAS for many of the permitted wells without logs indicates that they were probably drilled before 1975 (the year when well-log records were required of all completed wells in Kansas) and, thus, would not be expected to have a well log. Many other permitted wells with active water rights but without logs have dates for a change in the point of diversion or are water rights with priority dates after 1975. Some of the wells for these water rights might have existed before 1975 because, although Kansas law allowed the filing for water rights in 1945, water rights were not required until January 1, 1978. It would be expected that all groundwater rights with priority dates at least a few to several years after this date and changed points of diversions for groundwater appropriation after 1975 should have a WWC-5 record (well log). However, no well-log records could be found for many of the points of diversion falling in these categories. Either the missing logs were prepared but then not sent to KDHE, were misplaced somewhere along the line, or were never completed.
To add to the number of wells with completion dates and with active water rights for north-central Kansas, well completion dates were estimated for water-right priority dates and point-of-diversion changes from the mid-1980s to 2011 using two data components associated with water rights. The history (action trail) of a water right was reviewed for dates related to entries for "completed pending inspection" for new water rights or the date of "change approved" for an existing water right to change its point of diversion. A secondary approach was to base the well completion on the first year of reported water use. Using these methods, dates of well completion were estimated for 78 water-right-permitted wells without well logs in north-central Kansas, bringing the total number of water-right-permitted wells with completion dates to 73% of the total active points of diversion in this region.
The number of wells with active water rights and water use completed after 1975 in north-central Kansas shows a declining trend from 1975 to the middle 1980s, followed by a general peak during the mid-1990s to early 2000s (fig. 31). Approximately 46% of the wells for which completion dates were determined in the region are for Washington County, which shows a similar pattern to that for all the five counties in the region. Some of the general variations in the numbers of completed wells for particular years may be related to periods of wet or dry conditions. For example, during 1982-1987, the Palmer drought severity index (PDSI) for north-central Kansas was positive, with values indicating slightly wet conditions for 1983 and 1985, moderately wet for 1982 and 1986, and very wet for 1987. This coincides with the generally low values for drilling activity in the Dakota aquifer. The PDSI values during 1988-1991 were negative, with mild drought approaching moderate drought in 1988, severe drought in 1989, and moderate drought in 1991. The drought conditions may be responsible for the general rise in completed wells that started about 1988.
Figure 31--Trend in the number of new wells with active water rights and water use completed in north-central Kansas since 1975.
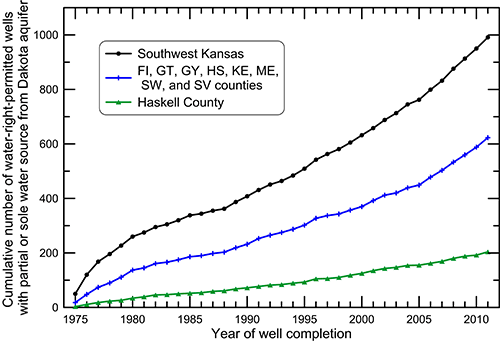
The much greater number of wells estimated to be completed partially or solely in the Dakota aquifer in southwest Kansas (1,554) resulted in a larger number of active points of diversion with well logs (993, or 64% of the wells). These data were used to generate the trends in drilled wells shown in fig. 32 for southwest Kansas without estimating well completion dates for recent points of diversion missing logs. Figure 32 displays the annual number of new wells completed partially or solely in the Dakota aquifer for all of southwest Kansas, the central block of eight counties in southwest Kansas, and Haskell County in the middle of this block.
Figure 32-Trend in the number of new or replacement wells each year with active water rights and water use completed partially or solely in the Dakota aquifer in southwest Kansas since 1975.
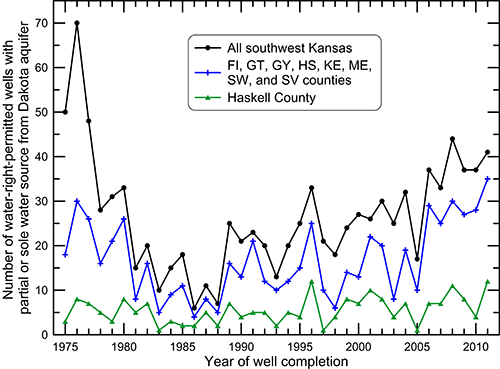
All three plots in fig. 32 show a similar pattern: a decline in the number of new wells completed partially or solely in the Dakota aquifer during the late 1970s to the middle 1980s, followed by an increasing trend from the late 1980s to 2011. The decline in the number of wells completed from the late 1970s to the mid-1980s in fig. 32 is related to the substantial slowing of the development of water rights and points of diversion for groundwater sources in all the aquifers in southwest Kansas (fig. 33). The growth in the cumulative number of active water-right-permitted wells for all aquifers grew rapidly from the middle 1950s until the late 1970s when the development rate substantially slowed. Figure 33 shows that the number of points of diversion associated with new water rights and their priority dates (not replacement wells) has essentially plateaued since 2004; only 23 new points of diversion for new water rights were added in all of southwest Kansas from 2004 to 2011 and only four were added from 2009 to 2011. The plateau is primarily related to four administrative actions from 1991 to 2002 that closed more than 90% of the area within GMD3 to new applications for water rights (Southwest Kansas Groundwater Management District No. 3, 2004).
Figure 33--Cumulative number of active points of diversion for all aquifers in southwest Kansas during 1945-2011 based on the priority date of the water right.
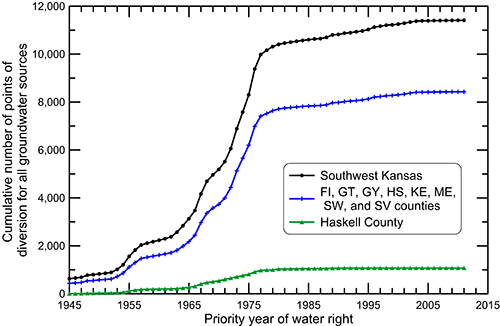
The general shape of the curves for the estimated cumulative number of wells determined to derive part or all of their source from the Dakota aquifer in southwest Kansas (fig. 34) are similar to those for wells in all aquifers (fig. 33) for the period from 1975 to the mid-1980s. However, the curves in fig. 34 display an increasing upward slope starting in the late 1980s in comparison with a generally linear, increasing trend for the late 1980s to 2003 for all aquifers. The increasing trend continued through 2011 for Dakota wells in comparison with very little increase during 2003-2011 for all aquifers. The percentage increase for the Dakota wells is also substantially greater than for new water right/points of diversion for all aquifers. The substantial number of replacement wells (involved with a change in the point of diversion associated with a water right) that include the Dakota aquifer explains most of the difference between figs. 33 and 34 for the late 1980s to 2011. Many wells drilled to replace permitted wells that were completed only in the HPA were completed in both the HPA and underlying Dakota strata, thereby increasing the percentage of wells completed in both aquifers. A relatively small number of other wells were drilled solely into the Dakota aquifer in areas where the saturated thickness of the HPA was or was becoming thin or insignificant. Although the replacement wells may be newly tapping the Dakota aquifer, this is allowed in GMD3, where the Dakota and High Plains aquifers are considered to be hydraulically connected because the definition of the HPA includes "deeper aquifers that are in vertical or horizontal hydraulic contact with the Ogallala formation" (Kansas Administrative Regulation [K.A.R.] 5-23-1[b].
Figure 34--Trend in the cumulative number of wells with active water rights and water use completed partially or solely in the Dakota aquifer in southwest Kansas since 1975.
Current Guidelines for Development
The water resources of Kansas are managed by the DWR using the concept of safe yield. Safe yield is the long-term sustainable yield of the water supply, which, for groundwater resources, includes hydraulically connected surface water and adjacent aquifers. Thus, the total amount of water pumped from an aquifer should be equal to or less than the decrease in discharge resulting from the water-level decline caused by pumping, and not equal to the recharge, so as to not deplete the aquifer. Well-spacing requirements are in place to ensure that new wells do not impair the supply of water to existing wells.
The Dakota aquifer is susceptible to over-development unless the spacing between wells is large enough to avoid well interference (overlap of the cones of depression produced by pumping wells). If wells are too close together, they may exacerbate water-level declines and lead to more rapid depletion of the aquifer. This is most likely where the Dakota aquifer is overlain by thick, relatively impervious strata such as in Suitability Area IV and the parts of Suitability Area II away from the confined edge. Local freshwater recharge to this part of the aquifer is expected to be insignificant relative to the typical pumping rate of large-capacity supply wells. Consequently, water must come from other parts of the aquifer not affected by pumping. This represents a net loss of water from the aquifer and will lead to water-level declines. In areas where the Dakota aquifer is at the surface or is overlain by shallow aquifers, local recharge to the Dakota aquifer from precipitation or from the overlying aquifer is sufficient to justify a denser well spacing. A denser well spacing for domestic wells is appropriate because they typically operate at low pumping rates and often for shorter periods of time than high-capacity supply wells, thereby causing less impact on the aquifer.
Sandstones in the Dakota aquifer are usually substantially less permeable than the sands and gravels forming the HPA and alluvial aquifers. The permeability difference means that a pumping well in the Dakota aquifer will produce significantly greater drawdown than would a well in the HPA or many alluvial aquifers being pumped at the same rate. The sandstone units in the Dakota are also typically smaller in extent and thickness than most sand and gravel zones in the HPA. Therefore, the spacing between high-capacity wells in the Dakota aquifer must generally be much greater than that in the HPA to avoid significant amounts of well interference (overlapping cones of depression).
In 1994, the DWR modified the existing well-spacing requirements for the Dakota aquifer based on research results from the Dakota Aquifer Program (Macfarlane and Sawin, 1995). The well-spacing requirements are founded on the general character of recharge to and groundwater flow rates within the Dakota aquifer. The current Rules and Regulations of the Kansas Water Appropriation Act (Kansas Department of Agriculture, 2011) specify the minimum distance from a well that is the subject of a water appropriation application to other wells in the Dakota aquifer system as follows (K.A.R. 5-4-4):
- Where the Dakota aquifer is unconfined (at the surface or beneath the HPA or alluvial aquifers--generally areas of significant surface or inter-aquifer recharge), the minimum well spacing is 0.5 mile (0.8 km) to other senior authorized non-domestic and non-temporary wells and 1,320 feet (396 m) to domestic wells, whose common source of supply is the Dakota aquifer.
- Where the Dakota aquifer is confined (overlain by relatively impervious rock units--generally very slow recharge), the minimum well spacing is 4 miles (6.4 km) to other senior authorized non-domestic and non-temporary wells and 0.5 mile (0.8 km) for domestic wells, whose common source of supply is the Dakota aquifer.
In comparison, the minimum spacing for wells in aquifers other than the Dakota is 1,320 ft (400 m) to other senior authorized non-domestic and non-temporary wells, and 660 ft (200 m) to domestic wells. A Dakota aquifer system well is defined in the Rules and Regulations (Kansas Department of Agriculture, 2011) as a well screened in whole or in part in the Dakota aquifer system, which includes the Dakota Formation, Kiowa Formation, Cheyenne Sandstone, and, where hydraulically connected, the Morrison Formation (K.A.R. 5-1-1). This definition implies that the spacing for wells screened in both the HPA and Dakota would be the 0.5 mi (0.8 km) and 1,320 ft (400 m) distance for senior authorized and domestic wells, respectively, if the common source for both were the Dakota aquifer. However, the spacing requirements are regulations; if both the proposed and existing wells only yielded a minor amount from the Dakota, the chief engineer of the DWR could determine whether the spacing regulations were not necessary to prevent direct impairment. These regulations apply to the areas of the Dakota aquifer outside of groundwater management districts (GMDs). The chief engineer has adopted the regulations for well spacing that are specific to each of GMDs Nos. 1, 3, and 4. The Dakota aquifer does not exist within GMD No. 2. The rules and regulations for Northwest Kansas GMD No. 4 include the same well-spacing guidelines for wells in the Dakota aquifer system (K.A.R. 5-24-3) as in the DWR rules and regulations.
The Dakota aquifer is confined in all of Western Kansas GMD No. 1 (GMD1), which covers parts of Suitability Area IV. The well-spacing requirements of GMD1 are a minimum of 0.5 mi (0.8 km) between a well for which water is proposed to be withdrawn from the Dakota for non-domestic use and any other well constructed into the same Dakota aquifer (K.A.R. 5-21-3).
Southwest Kansas GMD No. 3 (GMD3) specifies spacing requirements for the HPA, which also apply to wells screened in both the HPA and Dakota aquifer where they are hydraulically connected (Suitability Area I within GMD3), and for confined aquifers, which apply to the Dakota aquifer within the GMD3 portion of Suitability Area II. The well-spacing requirements are dependent on the quantity of water per well proposed for a water-right permit. The minimum horizontal spacing between each proposed well and all other senior non-temporary, non-domestic wells in the HPA ranges from 660 ft (201 m) for a quantity of 15 acre-ft/yr or less per well to 2,300 ft (700 m) for more than 500 acre-ft/yr per well (K.A.R. 5-23-3). The minimum spacing between each proposed well and all other senior non-temporary, non-domestic wells in a confined aquifer ranges from 660 ft (201 m) for a quantity of 15 acre-ft/yr or less per well to 2 miles (3.2 km) for more than 100 acre-ft/yr per well (K.A.R. 5-23-3). In addition, for a Dakota well to be defined as within the confined portion of the aquifer, the GMD3 rules include a distance from the edge of the confined boundary (called the hydraulic contact point), which is also dependent on the proposed quantity of annual use and ranges from 0.5 to 5 mi (0.8 to 8 km).
Within the boundaries of Big Bend Prairie GMD No. 5 (GMD5), the Dakota aquifer is unconfined in Suitability Area 1 and confined in Suitability Area II. The well-spacing requirement of GMD5 is a minimum of 1 mi (1.6 km) between a well for which water is proposed to be withdrawn from the Dakota aquifer for non-domestic use and all other wells withdrawing water from the same formation, including domestic wells, except for those domestic wells owned by the applicant (K.A.R. 5-25-2).
The regulations of GMDs 1, 3, and 4 also require that a well penetrating the Dakota aquifer and any other aquifers be constructed to prevent migration of water between the aquifers.
Water-Level Declines Since Pre-development
Long-term depth-to-water measurements, especially in the same wells, are valuable for assessing the amount of water in storage within an aquifer. The KGS and the DWR have routinely measured water levels for many years as part of the Kansas Annual Cooperative Water-Level Measurement Program, but in only a limited number of Dakota wells. Continuous water-level records from wells drilled at the time development began in the Dakota aquifer are unavailable.
Development of water resources in the Dakota aquifer started in the latter part of the 19th century, primarily in north-central, central, and southwestern Kansas where the aquifer is shallow. Darton (1905) used water-level measurements from these wells to construct the first potentiometric surface map of the Dakota aquifer. After that time, development slowly expanded into areas where the Dakota is deeper. Water levels in the first flowing artesian wells at Coolidge, Kansas, in 1885, were estimated to be almost 20 ft (6.1 m) above land surface. At the time of Darton's (1905) survey, flowing artesian wells in the Arkansas River valley between Coolidge and Syracuse produced 25-75 gal/min (95-285 L/min) of water (Haworth, 1913). In the 1930s and early 1940s, the maximum flow rate from these wells reportedly decreased to 30 gal/min (114 L/min) or less and water levels in these wells were only a few feet (1 m) above land surface (McLaughlin, 1943).
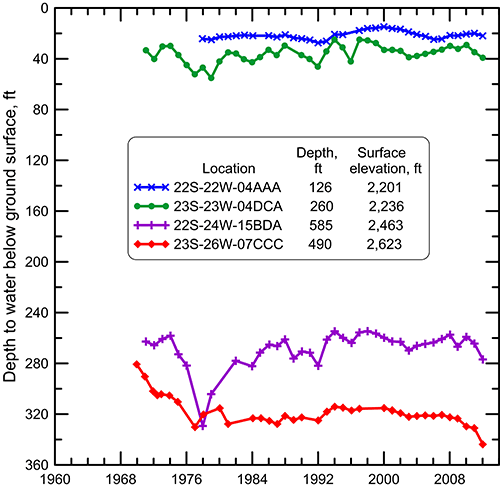
Annual winter water levels are shown in figs. 35-38 for wells in the Dakota aquifer and overlying alluvial and High Plains aquifers in southwest Kansas; the time axis and the scale of the depth axis are the same in all three figures to allow comparison of the hydrographs. The water-level data are available online through the water well levels data base (WIZARD) of the KGS.
Figure 35--Annual winter water levels in observation wells in the Dakota and overlying aquifers in southwest Kansas.
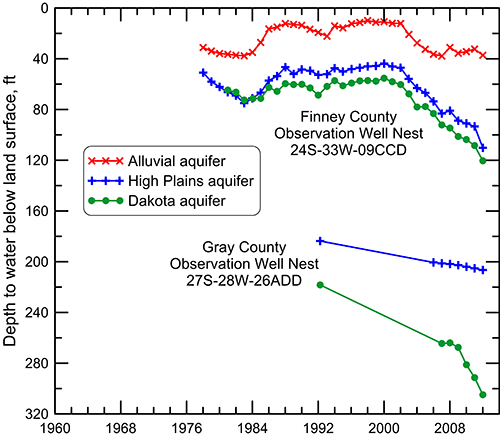
Hydrographs for a nest of observation wells screened in the alluvial, High Plains, and Dakota aquifers east of Holcomb in the Arkansas River valley, Finney County, show fluctuating levels from 1981 to 2002 followed by a general decline after 2002 (fig. 35). At this location, the Dakota aquifer is confined by the Upper Dakota confining layer. However, within 2-3 mi (3.2-5 km) south of the monitoring site, the confining layer is absent and the aquifers are hydraulically connected. Two supply wells (one for industrial and one for municipal use) are completed solely in the Dakota aquifer within 3 mi (5 km) of the observation well nest. Water levels were measured quarterly in the observation wells up until 1990 and since then at a semi-annual or annual interval. Detailed hydrographs incorporating all of the measurements (not shown in fig. 35) show the response of both aquifers to seasonal pumpage and recovery. The annual winter measurements indicate that until 1985, the seasonally recovered water levels in the Dakota were about the same as those in the HPA. After 1985, the recovered water levels in the Dakota have been lower than those in the HPA. This suggests a change in the hydrologic relationship between the aquifers. From 1981 to 1985, no substantial hydraulic head gradient existed. After 1985, the flow direction between aquifers appears to be more variable with upward flow of water from the Dakota to the High Plains during periods of more intense pumpage (generally summer months) and downward flow during times of recovery (usually winter months).
Except for the last several years, the pattern in the variations of the annual winter water levels in the High Plains and Dakota aquifers at the Finney County observation well nest have reflected changes in the shallow alluvial aquifer (fig. 35) as it responds to rapid recharge from and discharge to the Arkansas River. River flow entering Kansas was below the long-term mean during the 1970s to 1982. The flow at Garden City was zero or near zero during much of 1975 to 1983. Flow at the Colorado-Kansas state line began to increase during 1984 and was high in 1987. River flow was low during 1989 to 1994 and then changed to a sustained period of substantially greater than mean annual flow from 1995 through 2000. Since April 2002, annual flow in the Arkansas River at Garden City has been zero or near zero. Although the winter water levels in the alluvial aquifer have not changed substantially since 2005, the levels in the High Plains and Dakota aquifers have continued to decline at about the same rate as during 2002 to 2005. The HPA and Dakota aquifers now appear to be disconnected from the alluvial aquifer.
Observation wells were installed in the confined Dakota aquifer and underlying HPA about 8 mi (13 km) south of the Arkansas River in east-central Gray County in 1992 during the Dakota Program (Gray County observation well nest shown in fig. 35). The site is approximately 12 mi (19 km) north of the edge of the confined aquifer. Thus, at this site, the Dakota aquifer is confined and not hydraulically connected to the HPA. Two feedlot wells pump water from the Dakota aquifer within 1 mi (1.6 km) of the observation well nest; one feedlot well is screened solely in the Dakota, the other obtains an estimated 80% of its yield from the Dakota (and the remainder from the HPA). An irrigation well, which pumps about 70% of its supply from the Dakota aquifer (with the remainder from the HPA), is a little more than 1 mi (1.6 km) from the well nest. The water level in the Dakota aquifer at the time of observation well installation in 1992 was 34.6 ft (10.5 m) below that in the HPA well (fig. 35). Since then the water level in the Dakota well has declined at a greater rate than in the HPA well; the water-level separation between the two units was more than 94 ft (28.7 m) in January 2012.
Changes in water levels for a Dakota aquifer well and nearby wells in the HPA along the margin of the substantial saturated thickness of the HPA in northwest Grant County are displayed in fig. 36. The wells are located along an edge of the regional subsidence from dissolution of salt in Permian strata in southwest Kansas that led to greater deposition of sediments forming the HPA; the prominent edge of subsidence in the northwest part of southwest Kansas is known as the Bear Creek fault zone. The bedrock surface along the zone deepens rapidly towards the south-southeast in the northwest corner of Grant County. The well in the Dakota aquifer, which is the only Dakota well with long-term water-level data in Grant County, was located a little over 1 mi (1.6 km) farther to the northwest (in the direction of the shallowing bedrock surface) than a line between the two wells in the HPA in fig. 36. The bedrock surface is 155 ft (47 m) below land surface at the Dakota well (Watts, 1989) in comparison with about 300 and 325 ft (91 and 99 m) at the HPA wells in Sec. 12 and 22, respectively (which places the bedrock surface at the HPA wells below the extent of the y-axis in fig. 36). No lithologic log is available for the Dakota well, so it is unknown whether it is also partially screened in the HPA. Some connection with the HPA could have existed (before the water level dropped below the HPA base) through the gravel pack, which is usually installed to near land surface.
Figure 36--Annual winter water levels in wells in the Dakota and High Plains aquifers in northwest Grant County.
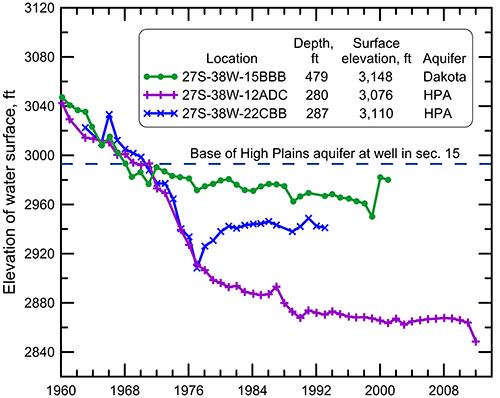
Annual winter water levels for all wells in fig. 36 generally declined from 1960 to the end of the records. The water level in the Dakota well dropped below the base of the HPA in the late 1960s. The continued declines after 1963, the year of last irrigation water use from the well, could represent withdrawals from the Dakota aquifer in the general area, but they could also be in response to the declines in the HPA to the southeast (direction of HPA thickening). The water levels in the HPA at substantially lower elevations than at the Dakota well location have created a lateral hydraulic gradient from Dakota sandstones into the HPA towards the south-southeast. The subsidence from Permian salt dissolution along the Bear Creek fault zone could have created normal faults exposing Dakota sandstones to the HPA as well as fractures that increased hydraulic connection between the Dakota and the HPA. Thus, groundwater could be flowing from the Dakota aquifer to the overlying HPA in both vertical and lateral directions.
Winter water levels in irrigation and unused wells in southwest Stanton and northwest Morton counties, where the Dakota aquifer mainly underlies unsaturated or thinly saturated Neogene or Quaternary sediments but also outcrops (see fig. 2), have remained either nearly constant or have slowly declined (fig. 37). The well showing the greatest decline (29S-43W-33CDB) has reported irrigation water use for all except one year during 2001-2010. The hydrographs imply that the Dakota aquifer is not substantially used or stressed in this area.
Figure 37--Annual winter water levels in wells in the Dakota aquifer in southwest Stanton and northwest Morton counties with thinly saturated or no HPA.
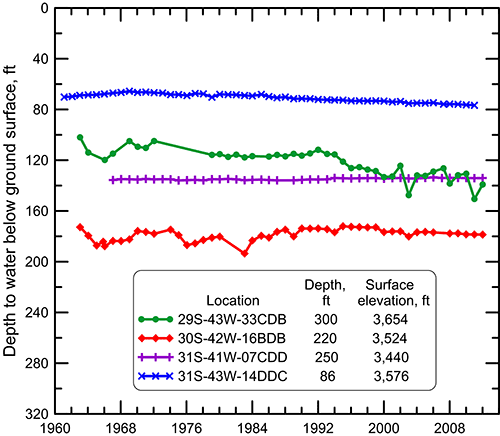
In Hodgeman and northern Ford counties, where the Dakota aquifer is primarily confined and not overlain by a significant saturated thickness of the HPA (fig. 2), water levels in the Dakota have either remained relatively constant or have slowly declined. This is illustrated by hydrographs in fig. 38 for an east-west transect across central Hodgeman County of four irrigation wells that tap the confined Dakota aquifer. Thus, just as in the Dakota outcrop/subcrop area in southwest Stanton and northwest Morton counties, the Dakota aquifer does not appear to be appreciably stressed. In these wells, and also farther east and northeast in central and north-central Kansas where development has been less intense or began more recently, water levels decline during seasonal periods of intense pumping but typically recover when pumping is reduced or stopped.
Figure 38--Annual winter water levels in irrigation wells in the Dakota aquifer in Hodgeman County.
The area where a substantial saturated thickness of the HPA is hydraulically connected to the Dakota (within Suitability Area I in southwest Kansas) does not contain an observation well sealed exclusively in the Dakota aquifer. From 2009 to 2012, January water levels were measured in a 782-ft (238-m) deep irrigation well in northwest Haskell County, for which the lithologic log indicates two screened intervals that are deeper than the bedrock depth of about 520 ft (158 m) (based on lithologic logs for the area; the log for this well is not distinctive enough to allow determination of the HPA base). However, this well is gravel packed from 20 ft (6 m) to the bottom of the well, which could allow some communication of water between the HPA and Dakota aquifer. The static water level was 374 ft (114 m) below land surface when the well was completed in December 1989. January measurements in 2009 and 2012 were 397.7 ft and 414.6 ft (121.1 m and 126.4 m), respectively, indicating an average annual decline in water level of 5.6 ft (1.7 m). Water levels in HPA wells in the area have also declined substantially during the last several years.
It is not known whether the annual water-level measurements in the HPA area of southwest Kansas are indicative of a truly interconnected system of the HPA and the unconfined Dakota aquifer. The possibility exists in some areas of Suitability Area I in southwest Kansas that shale layers are thick enough to isolate individual Dakota sandstone units in which the wells are completed; in that case, water levels could change in the Dakota at a different rate from that in the HPA, as shown in fig. 35 for the observation well nest in the confined region of the Dakota aquifer in Gray County. Further work is needed to assess the nature of the interconnection between the HPA and unconfined Dakota aquifer.
Future Development
Additional development of the water resources in the Dakota aquifer will be determined by the needs of users, the availability of water from the Dakota and other aquifers, and the management goals established by state and local water planning and regulatory agencies in Kansas. The increasing number of wells completed in both the HPA and the underlying Dakota aquifer in southwest Kansas indicates that as water levels decline in the HPA, more and more users are looking at the Dakota aquifer as an additional water source. New, high-capacity wells are also being completed solely in the Dakota aquifer in other regions where the HPA is absent, such as north-central Kansas. These trends are expected to continue in southwest Kansas as the saturated thickness of the HPA decreases and in other areas where additional water supplies are needed for municipal and agricultural demands, especially during drought periods.
The Dakota Aquifer Program identified a substantial area of additional nearly fresh to slightly saline waters in upper Dakota strata that could be important for future supplies. This aquifer area is triangular in shape with its base along the south lines of Sheridan and Graham counties and extending northward into the south-central portion of Norton County, where it is bounded by the 2,000 mg/L isocon for TDS concentration (fig. 17). Most of this area was previously believed to have waters of greater salinity (Keene and Bayne, 1977). Regional flow of fresher groundwater through the Dakota aquifer from the southwest is believed to have reduced the groundwater salinity to its present level. Some waters may even be slightly less than the TDS classification for freshwater (less than 1,000 mg/L) in thicker sandstones in the south-central portion of this triangle where greater permeability might have allowed more extensive flushing. Parts of western Gove County may also have more freshwater than previously thought.
Partially developed areas where additional withdrawals could be made are mainly in southwest Kansas (Suitability Area I), the portions of the aquifer not currently greatly stressed in the eastern outcrop/subcrop area (Suitability Area III), and the zone of the confined aquifer nearest the outcrop/subcrop belt (Suitability Area II) (fig. 30). In the confined aquifer, the thicker sandstones in the Upper Dakota aquifer will be the primary targets for possible new development because of their greater permeability and lower levels of salinity. Development in the fresh to slightly saline area in parts of Graham and Sheridan counties, as well as those areas in the undeveloped and very limited development region of Greeley, Wichita, Scott, Lane, Ness, Rush, Wallace, Logan, Gove, Trego, and Ellis counties will depend on the extent to which current water supplies can no longer meet future demands. Disadvantages of the Dakota aquifer in this region include the limited distribution of sandstones thick enough and of enough lateral extent to yield adequate amounts of water, the generally fine-grained nature of these sandstones, and the greater depth (and, thus, expense) of wells required to reach and extend through sufficient thickness of sandstone units for a viable well. In central Kansas, exploration for usable groundwater will be mainly limited to sandstones of the uppermost Upper Dakota aquifer in areas where the Upper Dakota confining layer is present and has slowed upward intrusion of saltwater into the Dakota aquifer from the underlying Cedar Hills Sandstone-upper Salt Plain aquifer. In southwest Kansas, the primary targets for exploration will be the sandstones in both the upper and lower Dakota aquifers and in the Morrison-Dockum aquifer. In the outcrop areas of central Kansas, the sandstones in the Upper Dakota and, near the eastern margin, the lower Dakota will be likely targets of exploration for new water supplies.
As shallower water supplies continue to become scarce, exploration for deeper usable waters in the confined Dakota aquifer will increase. Although the salinity of Dakota aquifer waters in much of the confined region is one of the most important factors limiting its use, the cost of desalinization methods is decreasing with time as more efficient systems are developed. Water availability and economic considerations caused the City of Hays to develop brackish water sources in the Dakota in west central Ellis County to mix with other freshwater sources. For a short time, Hays also experimented with advanced treatment technologies to reduce the level of salinity in the water coming from its new well field. The urgent need for water supplies in some areas of Kansas where supplies could become scarce may cause further consideration of treatment of brackish water from the Dakota aquifer.
Prev Page--Geochemistry || Next Page--Summary
Kansas Geological Survey, Geohydrology
Placed on web Nov. 12, 2014; originally published Fall 2014.
Comments to webadmin@kgs.ku.edu
The URL for this page is http://www.kgs.ku.edu/Publications/Bulletins/260/05_devel.html