Previous--High-resolution and Conventional-resolution Seismic Data || Next--Seismic Response of the East Flank of the Central Kansas Uplift
1Kansas Geological Survey and 2Department of Geology and Geophysics, University of Missouri-Rolla
This article available as an Acrobat PDF file (5 Mb).
High-resolution seismic images were obtained of Missourian (Middle Pennsylvanian) strata in Montgomery County, Kansas. The interval imaged included the Mound Valley Limestone through Quivira Shale(?) (Kansas City Group). The length of the seismic line was approximately 400 m (0.25 mi). The 12-fold CDP production line was acquired using an end-on source/receiver geometry. Ground truth was determined using one core on the seismic line, several other cores taken near the line, and from nearby outcrops. A geologic model of the area and synthetic seismogram were used to confirm geologic interpretations. The seismic images revealed some known features, such as dramatic thinning of the Galesburg Shale, and some unknown features, such as channeling in what appears to be the upper part of the Nellie Bly Formation.
The Kansas City Group (Upper Pennsylvanian, Missourian) in Montgomery County, Kansas (figs. 1 and 2) consists of alternating siliciclastic and carbonate rocks. The cyclic alternation of lithologies probably resulted largely from glacio-eustatic sea-level oscillations. The Drum Limestone of the Kansas City Group in Montgomery County has been the focus of ongoing studies because it contains an oolite body analogous to oolitic reservoirs in the Kansas City Group in central and western Kansas. The purpose of these studies has been to develop a detailed model of deposition and diagenesis of the Drum Limestone in order to better understand the origin of analogous petroleum reservoirs. To this end we have studied the Drum Limestone and associated units using data from outcrops, cores, geophysical well logs, and high-resolution seismic. In this report we present results from the first of three seismic lines shot along depositional dip in an area southwest of Independence, Kansas. The Drum Limestone is apparently absent in the area of this seismic line; however, the line does show details of pre- and post-Drum stratigraphy that influenced the ultimate development of reservoir-type facies.
Figure 1--Map of Kansas showing Montgomery County. In the study area, the Missourian succession represents the transition from a shelf to basinal environment. The succession thickens dramatically from north to south into the Arkoma basin. The transition from a shelf to basinal environment is characterized by the thickening of the siliciclastic sediment into the Arkoma basin. The limestone units, in contrast, generally thin from north to south in the basinal direction.
During deposition of the Kansas City Group, the area that is now Montgomery County was situated at a critical transition from a slowly subsiding shelf to the north, and a more rapidly subsiding basin to the south. North of Montgomery County, the Kansas City Group consists of continuous alternating carbonate and siliciclastic units. Many of the carbonate units contain localized thickenings due to oolitic buildups or phylloid algal reefs. South of the study area, the Kansas City Group thickens dramatically into the Arkoma basin. Limestones generally pinch out to the south as the siliciclastic units thicken.
The stratigraphic interval of interest in the study area extends from the Mound Valley Limestone to the Quivira Shale(?) (fig. 2). The Drum Limestone is generally under 5 m (16.5 ft) thick in the study area, but locally thickens to 20 m (66 ft) thick along a generally east-west trend (figs. 3 and 4). The thick zone of Drum Limestone is composed of porous oolite that is similar to petroleum reservoir facies. Thickness and facies changes in the Drum Limestone are interpreted to result from significant preDrum topography. Relief on the pre-Drum seafloor was apparently related to major thickness changes in the underlying sequence of rocks down to the Canville Limestone Member and possibly including the Galesburg Shale. The lowest unit that apparently influenced Drum deposition is the Galesburg Shale. In the area near the zone of thickened Drum, the Galesburg is thin (6.5 m; 21.5 ft) where the Drum is thickest, and thickens to a maximum of 19 m (63 ft) as the Drum thins to the north and south.
Figure 2--Generalized stratigraphy of the study interval.
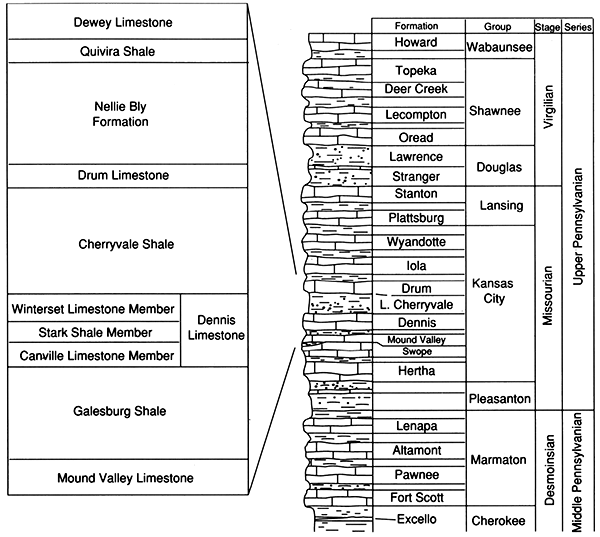
Figure 3--Maps of Montgomery County showing thickness of the Winterset Limestone (A), Cherryvale Shale (B), and Drum Limestone (C). Contour intervals are in feet.
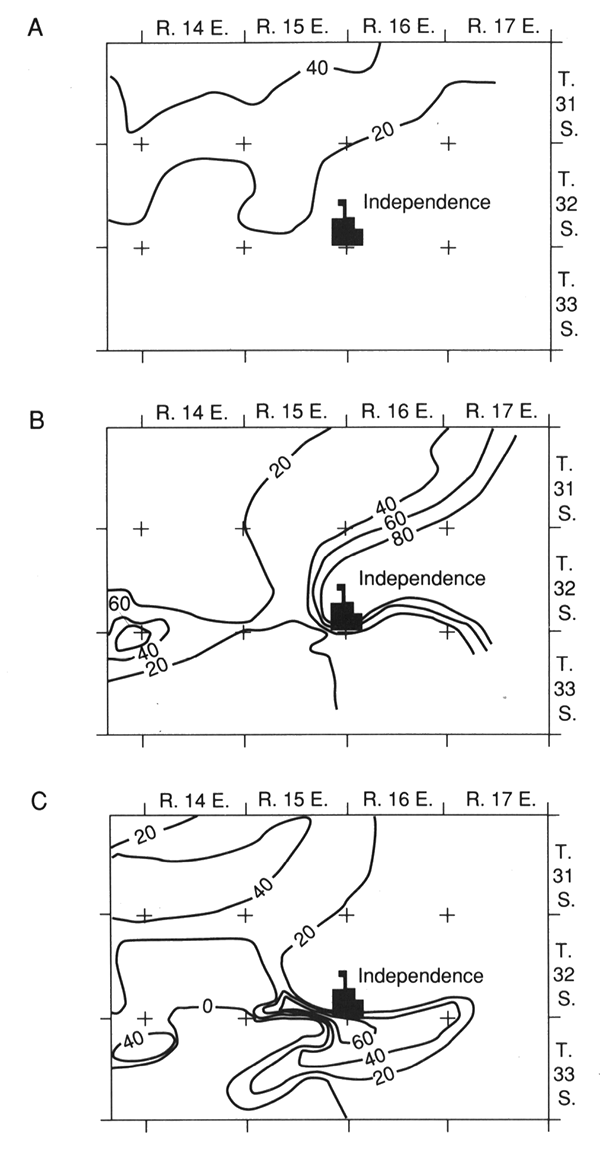
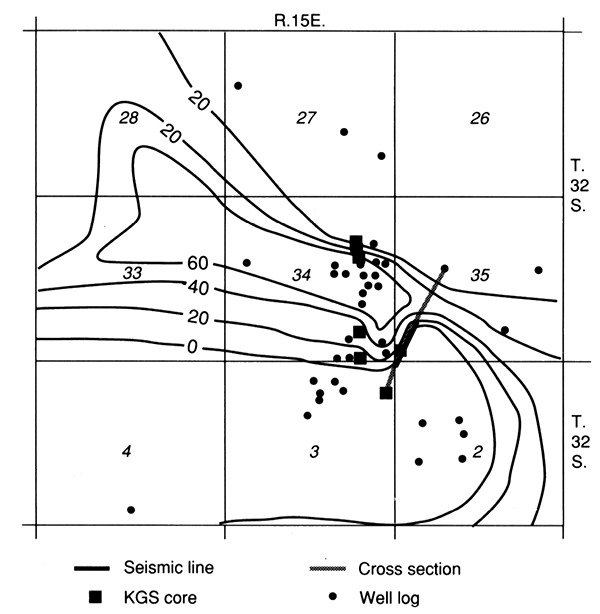
Figure 4--Map of study area showing thickness of Drum Limestone in feet and location of cross section and seismic line. Our preferred interpretation, based on outcrop, seismic, and shallow well control is that the Drum Limestone was deposited as several(?) lobes elongated perpendicular to the edge of the Cherryvale delta. In our opinion, the example seismic line was shot between Drum Limestone lobes in an area of shale deposition only (fig. 5).
Each of the next three significant units, the Winterset Limestone, Cherryvale Shale, and Drum Limestone, are thickest just basin ward of the thickest underlying unit. During the deposition of each unit the depositional basin edge stepped basinward. For example, during Winterset deposition, the depositional shelf edge was in the area that is now southern Wilson County a few miles north of the Montgomery County border. The Winterset thins from nearly 30 m (99 ft) thick in central Wilson County to under 6 m (20 ft) thick in central Montgomery County (Watney et al., 1989). The Cherryvale Shale apparently filled in some of the low areas left from Winterset deposition and extended the depositional shelf edge to central Montgomery County. The Drum Limestone is thin, generally under 6 m (20 ft), where either the Cherryvale Shale or Winterset Limestone are thick, and increases in thickness up to 22.5 m (74 ft) as the Cherryvale Shale thins to the south where the Winterset Limestone is thin. Thus, deposition of the Drum Limestone extended the depositional shelf a few miles south of the Cherryvale Shale platform (fig. 3). However, this may not be true progradation, because sea-level fluctuations at this time resulted in a complex history of flooding and exposure of much of the study area (French et al., 1992; Watney et al., 1989).
The Nellie Bly(?) Formation overlies the Drum Limestone and consists of interbedded sandstone, siltstone, shale, and coal, and includes thin limestones in the upper portion. Ripple crossbedding, starved ripples, sediment loading, and soft-sediment deformation structures are all common features in these strata. There is a sharp, irregular erosional contact near the middle to base of the Nellie Bly(?) that can be traced throughout the study area on well logs and high-resolution seismic lines. This erosion surface is overlain by a fining-upward sequence of conglomerate, sandstone, and shale.
A black, platy shale (the Quivira Shale?), up to 3 m (10 ft) thick, lies directly above the Nellie Bly(?) Formation.
The Cherryvale Shale was part of a marine deltaic system that generally prograded to the south and southwest. The Cherryvale is distributed in one major lobe in the study area (fig. 3B). This lobe has a NE-SW axis, parallel to one direction of basement structures in the area, although this relationship remains enigmatic. The lobe of Cherryvale Shale thins abruptly to the south from 30 m (99 ft) to 6.5 m (21.5 ft) over a distance of about 1.6 km (1 mi) in the subsurface southwest of Independence. The southern and western edge of the Cherryvale lobe is interpreted as the depositional slope that was left after cessation of delta progradation, although some minor erosion occurred prior to, or concomitant with, initial Drum deposition. Depositional environments of the Cherryvale are difficult to interpret because of the lack of sedimentary structures and the homogeneity of the shale. The relatively flat top of the Cherryvale lobe suggests that sediment accumulated up to local base level. It is likely that the sea was very shallow over the depositional shelf created by the Cherryvale delta.
The Drum Limestone marks the end of siliciclastic deposition and beginning of carbonate deposition in the study area. The lowest bed in the Drum Limestone is locally rich in fossils and shale clasts, and rests on an erosional surface on top of the Cherryvale Shale. This lowest limestone may represent deposition during a transgression and initial relative sea-level rise. Local scouring and/or channeling in lower Drum beds suggests relatively shallow-water conditions. Above the lowest limestone bed in the Drum are alternating shale and laminated carbonate mudstones. The paucity of bioturbation, fossils, and current structures all suggest a quiet, relatively deep-water environment of deposition. The alternating shale and laminated carbonate mudstone facies always occurs at the base of the Drum Limestone and gradually increases in thickness basin ward. Above this facies is the main portion of the Drum Limestone, and it is this upper part that shows rapid facies and thickness changes in the study area.
Where the combined thickness of the Winterset Limestone (fig. 3A) and Cherryvale Shale (fig. 3B) are over 17 m (56 ft) thick, the Drum is a thin (generally under 3.5 m; 11.5 ft), tight (low porosity/permeability) limestone. Outcrops of the Drum in this area are composed of laminated carbonate mudstone, stromatolitic wackestone, and fossiliferous wackestone. Deposition in mostly normal marine water is evidenced by the abundant and diverse fauna in the wackestone and packstone.
Near the basinward edge of the Cherryvale Shale (where the Winterset Limestone is generally thin), the Drum increases in thickness and becomes more oolitic. Near the Cherryvale depositional shelf edge, the Drum typically consists of three units: a lower unit of alternating carbonate mudstone and shale, a middle unit composed of mudstone to fossiliferous wackestone, and an upper cross bedded oolitic unit. Evidence of erosion prior to oolite deposition is common, and a possible karst surface has been recognized indicating possible local subaerial exposure on top of the fossiliferous wackestone (Feldman and Franseen, 1991). Basinward of the break in slope of the Cherryvale, the Drum thickens abruptly to a maximum of 25 m (82.5 ft) in the subsurface. On outcrop and in cores, most of the Drum in this area is composed of crossbedded, fossiliferous, oolitic grainstone. Hamblin (1969) interpreted bimodal crossbed orientations in the Kansas City Group oolites to be the result of tidal currents. Crossbed orientations in the Drum oolite are also bimodal, but are dominated by southwest orientations, suggesting a setting dominated by ebb currents. Oolites were probably being generated in shallow water near the edge of the Cherryvale depositional shelf and transported basin ward into lower-lying areas, possibly as a series of tidal deltas in some locations. The oolite is now preserved as several lobes extending basin ward from the depositional shelf edge (compare figs. 3C and 4).
In basinward locations, south of the major oolitic accumulations, the exposed Drum is represented predominantly by unfossiliferous, laminated micrite and peloidal wackestone possibly reflecting a relatively deep, oxygen-starved environment. The Drum is locally absent in basinal areas in the subsurface. The distance of the transition from thin shelf limestone to thick oolite to thin basinal limestone is as little as 1 km (0.62 mi) in the subsurface. On outcrop this transition occurs over a distance of about 25-30 km (15-25 mi).
Apparently a minor flooding event followed Drum Limestone deposition, resulting in widespread deposition of the crossbedded sandstones and intervening shales of the Nellie Bly(?) Formation. However, a fall in relative sea level may be the cause of the laterally extensive erosion surfaces and channels that occur within the Nellie Bly(?), although no subaerial exposure features have been identified to date. Locally, the upper portion of the Drum Limestone appears to have been erosionally truncated. Current ripples, the lack of fossils, low-diversity trace fossil assemblages, and possible rhythmic tidal bedding suggest deposition in a shallow, estuarine environment for the Nellie Bly(?) Formation.
Deposition of the overlying black, platy shale (Quivira Shale?) likely represents the next major marine transgression.
A high-resolution seismic-reflection study was conducted in the Drum Limestone study area in an effort to image geometric changes within Missourian stage strata at depths of up to 100 m (330 ft), These features are significant from both a geologic and geophysical perspective. Geologically, the nature of a truncation or pinch-out, either from erosion or a facies change, is important for determining the depositional history. Geophysically, a pinch-out or truncation represents an opportunity to quantify the practical thin-bed resolution of shallow high-resolution seismic reflection at this site.
This study highlights the geophysical aspects of quantifying practical thin-bed resolution. The data were acquired and processed to focus on a distinct shallow highresolution seismic reflection at approximately 65 msec within the Galesburg Shale where the shale thins from 19 m (63 ft) to 7 m (23 ft).
The thin-bed resolving power of the CDP seismic-reflection technique is dependent upon the dominant frequency of the recorded reflection wavelet (Widess, 1973). Increasing the dominant frequency of recorded reflection signal involves: 1) generating a high-frequency source pulse, 2) sensing the signal with receivers with high voltage output, low noise, and a flat frequency response over the desired high frequencies, 3) recording the signal digitally on a seismograph with a large instantaneous dynamic range and electronically quiet analog filter and gain capabilities, and 4) optimizing the spread interval and receiver spacing for the target of interest (Knapp and Steeples, 1986). Criteria for resolving converging thin-bed sequences relies on observations of interference as evidenced by distortion of reflection waveforms (Ricker, 1953).
Practical resolution limits are dependent not only on recorded reflection frequencies but also on wavelet characteristics and noise. Zero-phase wavelets possess the highest resolving potential (Knapp, 1990). A known theoretical wavelet can be phase-filtered to zero phase. Successful application of deconvolution requires a statistically large number of unique reflection wavelets and data with a large signal-to-noise ratio (Yilmaz, 1987). Shallow high-resolution reflection data sets rarely have more than four to six reflections and are notoriously noisy (Steeples and Miller, 1990). Practical optimization of shallow high-resolution data sets by phase filtering to zero phase is generally not possible.
Data for this study were acquired on an EG&G Geometries 2401 seismograph. The seismograph amplifies, filters (analog), digitizes the analog signal into a 15-bit word, and stores the digital information on magnetic media. The selected low-cut filters have an I8-dB/octave rolloff from their indicated -3-dB point. Production lines were acquired with loo-Hz analog low-cut and 500-Hz analog high-cut filters. The 1,024 samples recorded per trace were at a 1/2-msec sampling interval. The dynamic range of the seismograph was more than adequate to record high-quality reflection information in the presence of source-generated and cultural noise at this site.
A series of walkaway-noise tests was conducted prior to acquisition of the production seismic lines. The spectral and total energy characteristics of the downhole .50-cal seismic source made it the source of choice at this site for this geologic target. The receiver array consisted of three 40-Hz geophones equally spaced over approximately 1 m (3.3 ft) and centered on each station. The receiver array was designed in an attempt to attenuate some of the source-generated noise (Steeples and Miller, 1990). Analysis of the noise tests allows acquisition parameters and equipment to be optimized for the site conditions.
The nominal 12-fold CDP production line was acquired using an end-on source/ receiver geometry. Analysis of the walkaway data allowed determination of an optimum source-to-nearest-receiver offset of 17 m (56 ft) and source-to-farthest-receiver offset of 75 m (247.5 ft). A large component of direct and refracted wave energy inhibited closer source-to-receiver offsets. Near vertically incident recording minimizes normal moveout corrections and the associated stretch allowing a higher frequency, less distorted reflection wavelet to be recorded (Miller et al., 1990). The target reflector is approximately 75 m (247.5 ft) deep, which is within the optimum recording offset as evidenced by the walkaway-noise tests and general rules of thumb (Knapp and Steeples, 1986).
The CDP data were processed at the Kansas Geological Survey (KGS) using a proprietary set of algorithms developed by the KGS (Eavesdropper). Extreme care was used during the editing process to ensure removal of all non-seismic energy that could either be misinterpreted as reflections on stacked data or that hampered interpretations of real reflection events. Velocity analysis incorporated iterative constant-velocity stacking with detailed 1I5-wavelength surface-consistent statics to improve both accuracy of velocity corrections and time/depth conversion on interpreted cross sections. The main distinctions between the shallow high-resolution processing flow used on these data and most routine petroleum sequences relate to conservative use and application of correlation statics, precision required during velocity and spectral analysis, extra care during muting operations, and lack of deconvolution.
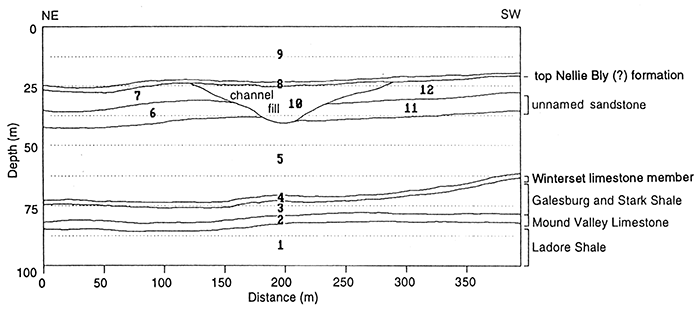
As an aid to the interpretation of the seismic line (fig. 5), a geologic cross section (fig. 6), a corresponding two-dimensional geologic model (fig. 7), and a synthetic seismogram were generated (fig. 8). The geologic cross section is structurally consistent with well control (Clarkson #2 core; fig. 6) at trace 494 (fig. 5). The velocities and densities incorporated into the model (fig. 7) are consistent with the lithologies encountered in the Clarkson core, check shot survey data at the same well site, and stacking velocity control. The cross section in fig. 7 is presented as a reasonable representation of that portion of the subsurface imaged by the seismic control and illustrates some of the geometric details which characterize the Missourian stage strata in the study area.
Figure 5--Uninterpreted and interpreted high-resolution seismic line. These data were acquired on an EG&G Geometries 2401 seismograph using a downhole .50-cal seismic source and receiver arrays consisting of three 40- Hz geophones equally spaced over approximately 1 m and centered on each station. 1,024 samples recorded per trace were at a 1/2-msec sampling interval. Length of seismic line is about 0.4 km (0.25 mi).
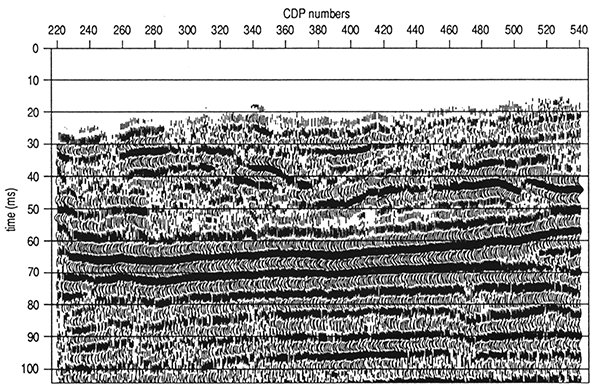
Figure 6--Geologic cross section along seismic line based on KGS cores and one oil-well log. Box indicates approximate location and thickness of interval models for the synthetic seismic line.
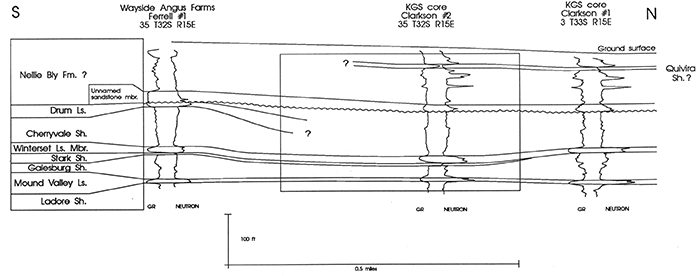
Figure 7--Two-dimensional geologic cross section. The geologic cross section is structurally consistent with well control (Clarkson #2 core) at trace 494 (fig 5). The velocities and densities incorporated into the model are consistent with the lithologies encountered in the Clarkson core, check shot survey data at the same well site, and stacking velocity control. This cross section is presented as a reasonable representation of that portion of the subsurface imaged by the seismic control and illustrates some of the geometric details which characterize the Missourian stage strata in the study area.
The two-dimensional synthetic seismogram (fig. 8) was generated for the geologic model using Geophysical Micro-Computer Ltd. diffraction modeling software. A 5-msec, zero-phase, normal-polarity Ricker wavelet was used. The more prominent events on the synthetic seismogram have been labelled in order to facilitate comparisons between the geologic model, synthetic seismogram, and seismic line.
Figure 8--Two-dimensional synthetic seismogram generated for the geologic cross section of Fig. 6 using Geophysical Microcomputer Ltd. diffraction modeling software. A 5-msec, zero-phase, normal-polarity Ricker wavelet was used. The more prominent events on the synthetic seismogram have been labelled in order to facilitate comparisons between the geologic model, synthetic seismogram, and seismic line.
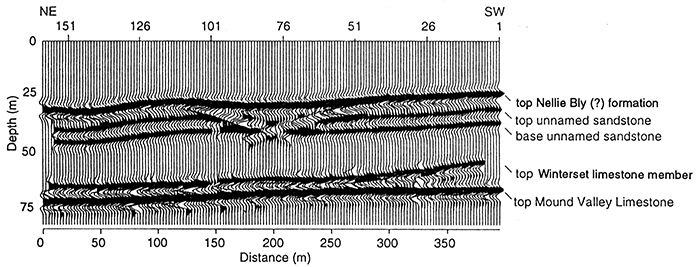
A comparison of the geologic model and the synthetic seismogram indicates that tops of the Mound Valley Limestone, Winterset Limestone, unnamed sandstone and a limestone in the upper Nellie Bly(?) Formation, and the base of the unnamed sandstone are manifested as relatively high-amplitude peaks on the synthetic seismogram (fig. 8). The base of the interpreted channel-fill, in contrast, is represented as a moderate-amplitude trough. Low-amplitude diffractions originate at the edges of these truncated horizons. The complexity of the central part of the synthetic seismogram is increased as a result of the non-vertical incident reflections from the base of the channel that collectively produce the observed classic "bow-tie" effect beneath the base of the channel.
The interpreted seismic line is presented as fig. 5. The labelled events were identified on the basis of the synthetic seismogram. The time-depths to the respective horizons are consistent with subsurface control at the Clarkson #2 well site, stacking velocities, and check shot survey control. The high degree of correlation between the geologic model, synthetic seismogram, and seismic line support the seismic interpretations presented.
As anticipated from the analysis of the synthetic seismogram, the tops of the Mound Valley Limestone, Winterset Limestone, unnamed sandstone and a limestone in the upper Nellie Bly(?) Formation, and the base of the unnamed sandstone correspond to relatively high-amplitude peaks on the seismic line. The Mound Valley Limestone, Winterset Limestone, unnamed sandstone, and Nellie Bly(?) Formation events appear to be correlatable across the seismic line. In contrast, the reflections from the top and base of the unnamed sandstone unit, as correlated, are truncated by an interpreted deeply incised and infilled channel. The base of the interpreted channel fill is correlated as a moderate-amplitude trough. The polarity of this event, and the subtle negative drape across the channel along the Nellie Bly(?) event, suggests that the channel fill is composed predominantly of compacted shales. This thesis has not been independently confirmed by drilling.
One striking feature on the example seismic line is the dramatic thinning of the Galesburg shale to the north (fig. 6; at about 65 msec, between the Winterset and Mound Valley Limestones). This is consistent with core and well-log data (fig. 6) and interpreted as confirmation of either the local depositional thinning or erosional thinning of the Galesburg Shale.
Also of significance is the apparent absence of the Drum Limestone along the entirety of the seismic line. (The absence of Drum Limestone at trace 494 has been confirmed by the Clarkson core.) Our preferred interpretation is that the Drum Limestone was not deposited in this part of the study area. Based on outcrop and shallow well control, we interpret the Drum Limestone to have been deposited as several(?) lobes elongated perpendicular to the edge of the Cherryvale delta. In our opinion, the example seismic line was shot between Drum Limestone lobes, in an area that received only shale deposition (fig. 4).
Analysis of cores and well logs in the study area suggests that the unnamed sandstone within the Nellie Bly(?) Formation rests unconformably on lower older units. The irregularity of this reflector on the seismic line and the interpreted channel are further evidence of the erosional nature of the lower contact and basal portion of the Nellie Bly(?) Formation.
The seismic line illustrates that stratigraphic complexity of the upper Nellie Bly(?) and overlying units indicated by lack of lateral continuity of events shallower than approximately 45 msec (fig. 5). This complexity is suggested in the geologic cross section by our inability to correlate the Quivira Shale(?) north of the Clarkson #2 core (fig. 6). A shale-filled channel is hypothesized as a partial explanation for the lack of continuity of shallow reflectors based on the similarity of the seismic line and synthetic model data (figs. 5, 7, and 8). Channeling in the Nellie Bly(?) Formation may explain the lateral discontinuity of thin limestone and sandstone beds shown on the well logs in fig. 6.
A 12-fold high-resolution seismic line was obtained along an 400-m-long (0.25-mi) line in central Montgomery County, Kansas. The interval from the Mound Valley Limestone to the Quivira Shale(?) was imaged. Ground truth was based on cores, well logs, and outcrops. These data in addition to interpretation of the seismic line were used to construct a simplified geologic model. The model was used to construct a synthetic seismic section. The synthetic section agrees well with the original seismic section. This technique revealed outcrop-scale features in the rocks, including one small channel in the Nellie Bly(?) Formation not previously suspected.
This paper was prepared with the support of the U.S. Department of Energy (DOE Grant #DE-FG07-90BC14434). However, any opinions, findings, conclusions, or recommendations expressed herein are those of the authors and do not necessarily reflect the views of the DOE. We thank Jesse Clarkson and Warren Ferrell for allowing access to their land for the purposes of coring and seismic acquisition. We thank Dennis Hedke and Bill Miller for critical reviews and suggestions that improved the final manuscript.
Feldman, H. R., and Franseen, E. K., 1991, Stratigraphy and depositional history of the Drum Limestone and associated strata (Pennsylvanian) in the Independence, Kansas, area--A field trip guidebook and road log: Kansas Geological Survey, Open-file Report 91-45, 29 p.
French, J. A., Feldman, H. R., Watney, W. L., and Franseen, E. K., 1992, Stratigraphic architecture and facies distribution of upper Middle Carboniferous cyclic depositional sequences (cyclothems), southeastern Kansas, USA: Geological Society of America, Abstracts with Programs, v. 24, no. 4, p. 15
Hamblin, W.K., 1969, Marine paleocurrent directions in limestones of the Kansas City Group (Upper Pennsylvanian) in eastern Kansas: Kansas Geological Survey, Bulletin 194, pt. 2, 25 p. [available online]
Knapp, R. W., 1990, Vertical resolution of thick beds, thin beds, and thin-bed cyclothems: Geophysics, v. 55, p. 1,183-1,190
Knapp, R. W., and Steeples, D. W., 1986, High-resolution common depth point seismic-reflection profiling-field acquisition parameter design: Geophysics, v. 51, p. 283-294
Miller, R. D., Steeples, D. W., and Myers, P. B., 1990, Shallow seismic-reflection survey across the Meers fault, Oklahoma: Geological Society of America, Bulletin, v. 102, p. 18-25
Ricker, N., 1953, Wavelet contraction, wavelet expansion, and the control of seismic resolution: Geophysics, v. 18, p. 769-792
Steeples, D. W., and Miller, R. D., 1990, Seismic-reflection methods applied to engineering, environmental, and ground-water problems: Society of Exploration Geophysics, Volumes on Geotechnical and Environmental Geophysics, Stan Ward, ed., v. 1--Review and Tutorial, p. 1-30
Watney, W. L., French, J. A., and Franseen, E. K., eds., 1989, Sequence stratigraphic interpretations and modeling of cyclothems in the Upper Pennsylvanian (Missourian), Lansing and Kansas City Groups in eastern Kansas: Kansas Geological Society, Guidebook, 211 p.
Widess, M. B., 1973, How thin is a thin bed?: Geophysics, v. 38, p. 1,176-1,180
Yilmaz, O., 1987, Seismic data processing; S. M. Doherty, ed: in, Series--Investigations in Geophysics, no. 2, Edwin B. Neitzel, series ed.: Society of Exploration Geophysics, Tulsa, OK, 526 p.
Previous--High-resolution and Conventional-resolution Seismic Data || Next--Seismic Response of the East Flank of the Central Kansas Uplift
Kansas Geological Survey
Comments to webadmin@kgs.ku.edu
Web version placed online Aug. 24, 2015. Original publication date 1995.
URL=http://www.kgs.ku.edu/Publications/Bulletins/237/Franseen1/index.html