Kansas Geological Survey, Bulletin 152, pt. 3, originally published in 1961
Originally published in 1961 as Kansas Geological Survey Bulletin 152, pt. 3. This is, in general, the original text as published. The information has not been updated. An Acrobat PDF version (5 MB) is also available.
Sources of information
Mineral Fuels and Related Products
Coal
Oil
Natural gas
Natural gas liquids
Helium
Carbon black
Asphalt
Cement (portland and masonry)
Clay and shale
Salt
Sand and gravel
Stone
Lime
Lead
Zinc
Uranium
Cement (natural)
Diatomaceous marl
Gypsum
Expanded perlite and vermiculite
Pumicite, or volcanic ash
Salt brine
Sandstone (dimension)
Water and soil
Kansas, in 1960, produced minerals worth $500,449,196, or $24,185,423 less than in 1959, a decrease of 4.6 percent. As in former years, the fuels and related products constituted the largest part, $426,968,186 or approximately 85.3 percent; $72,752,070 or 14 percent was contributed by the nonmetals excluding mineral fuels, and $728,940, less than 1 percent, by the metals. The year 1960 marks the fifth consecutive year in which Kansas mineral commodities were valued at more than $500,000,000. Coal, helium, lead, natural gas, salt, and zinc production and value in 1960 exceeded those for 1959; quantity and value of all other mineral commodities were less.
Five counties, as opposed to three in 1959, reported no mineral production in 1960; Brown, Lane, Mitchell, Ottawa, and Wichita. Oil, gas, or both were produced in 80 counties, sand and gravel in 66 counties, and stone in 40 counties. In 1960, each of 60 counties, 1 more than in 1959, produced minerals worth $1,000,000 or more. Ellis County led in the value of mineral production ($33,702,795), followed by Barton County ($30,790,851), Russell County ($24,852,926), and Butler County ($23,620,359). Producing minerals worth between $10,000,000 and $20,000,000 were 16 counties, 3 more than in 1959. Of the 100 counties reporting mineral production, 28 gained their wealth chiefly from the nonfuels, and of these, 9 produced minerals having a value of $1,000,000 or more. The counties that produced the greatest dollar value of minerals are those in which oil or gas are found, mainly western Kansas counties, although Allen, Butler, Greenwood, and Marion Counties, all in eastern Kansas, are included. Sedgwick County exploited the most different minerals, eight, followed by Grant and Reno with seven, and Barber, Cherokee, Kearny, Kingman, and Wilson Counties with six each. In 1960 Kansas refined and retained in the state 69.2 percent of all oil accounted for, or 1 percent more than in 1959. Crude oil reserves in 1960 are estimated at 883.8 million barrels or 3.7 percent less than in 1959. Natural gas reserves are estimated at 19,608,724 million cubic feet or 1.9 percent less than in 1959. Minerals produced in 1960 in order of value are oil, gas, cement, stone, salt, clay and clay products, sand and gravel, carbon black, natural gasoline, and coal. This report gives the amount and value of each mineral produced in the state in 1960 and compares them with 1959 statistics, and it also includes directories of mineral producers on record as of December 31, 1960.
For the fifth consecutive year, value of mineral production in Kansas exceeded $500,000,000. Total value of all minerals produced or processed in 1960 was $500,449,196, or $24,185,423 less than in 1959, a decrease of 4.6 percent. Since 1932 Kansas has ranked among the first 10 states in the value of mineral commodities produced annually. Within the state 22 minerals are produced commercially, 5 others are available but currently are not exploited, at least 6 others are known to occur but have not been studied sufficiently to determine their commercial possibilities, and at least 2 minerals are processed into useful mineral commodities from raw materials shipped into the state. Table 1 presents data on mineral production in Kansas for 1959 and 1960, together with the 1960 rank of each mineral with respect to the other minerals produced in the state.
Table 1—Quantity and value of Kansas mineral production, by commodities, 1959 and 1960
| Commodity | Unit | 1959 | 1960 | Rank, 1960 |
|||
|---|---|---|---|---|---|---|---|
| Quantity | Value ($) | Quantity | Value ($) | ||||
| Carbon black | Pound | 91,644,160 | 6,387,598 | 87,302,185 | 5,621,236 | 8 | |
| Cement (masonry) | 376-lb. bbl. | 349,265 | 1,393,350 | 284,669 | 1,178,522 | 14 | |
| Cement (natural) | 376-lb. bbl. | * | * | * | * | 24 | |
| Cement (portland) | 376-lb. bbl. | 10,055,944 | 30,889,337 | 7,876,834 | 25,194,299 | 3 | |
| Clay (raw) | Short ton | 1,020,560 | 1,270,341 | 893,176 | 1,223,718 | 13 | |
| Clay and clay products | Short ton | 11,500,000 | 11,500,000 | 6 | |||
| Coal | Short ton | 774,360 | 3,491,688 | 876,343 | 4,031,177 | 10 | |
| Diatomaceous marl | Short ton | * | * | * | * | 20 | |
| Gypsum (crude) | Short ton | * | * | * | * | 15 | |
| Helium—shipments | cu. ft. | 21,642,500 | 342,619 | 21,696,300 | 349,750 | 17 | |
| Lead (recoverable content of ores) | Short ton | 481 | 110,630 | 781 | 182,754 | 18 | |
| Natural gas | M cu. ft. | 595,244,836 | 65,476,932 | 632,609,850 | 69,587,083 | 2 | |
| Natural gas liquids | |||||||
| Butane | 42-gal. bbl. | 1,507,175 | 3,112,280 | 1,252,429 | 2,523,360 | 12 | |
| Natural gasoline | 42-gal. bbl. | 2,554,365 | 5,900,583 | 2,411,303 | 5,580,110 | 9 | |
| LPG | 42-gal. bbl. | 55,848 | 86,564 | 12,494 | 20,989 | 22 | |
| Propane | 42-gal. bbl. | 1,426,595 | 3,152,775 | 1,186,051 | 2,621,173 | 11 | |
| Perlitea | Short ton | * | * | * | * | 21 | |
| Petroleum (crude) | 42-gal. bbl. | 119,473,875 | 354,837,409 | 113,344,548 | 336,633,308 | 1 | |
| Pumicite (volcanic ash) | Short ton | * | * | * | * | 23 | |
| Salt | Short ton | 1,123,115 | 13,670,485 | 1,212,739 | 14,108,836 | 5 | |
| Sand and gravel | Short ton | 11,334,128 | 7,937,205 | 9,709,939 | 6,807,599 | 7 | |
| Sandstone (dimension) | Short ton | * | * | Included with stone in 1960 | |||
| Stone (limestone, sandstone, chat) | Short ton | 13,987,952 | 17,072,506 | 12,037,346 | 15,412,298 | 4 | |
| Vermiculitea | Short ton | * | * | * | * | 19 | |
| Zinc (recoverable content of ores) | Short ton | 1,017 | 233,910 | 2,117 | 546,186 | 16 | |
| Undistributed* | 2,169,866 | 1,132,892 | |||||
| Total value | $524,634,619b | $500,449,196" | |||||
| (a) Minerals processed but not mined in Kansas. (b) Totals adjusted to eliminate duplication in the value of clays and stone. (*) Quantity and value of individual commodities cannot be revealed. |
|||||||
Minerals are widely distributed in the state; oil, gas, or both were produced in 80 counties, 2 fewer than in the previous year; sand and gravel were obtained in 66 counties instead of 71 as in 1959; and stone in at least 40 counties. Coal is being mined in 7 eastern counties. Salt and gypsum, known to underlie at least 40 central and southwestern counties, are currently being produced in only 5 and 2 counties, respectively.
Of the 105 counties in Kansas, 100 (all but Brown, Lane, Mitchell, Ottawa, and Wichita) reported mineral production in 1960, two fewer than in 1959. Brown, Mitchell, and Wichita Counties reported mineral production in 1959 and Greeley County, which in 1959 reported no mineral production, joined the ranks of mineral producers in 1960. In 1960, each of 60 counties, 1 more than in 1959, produced minerals worth $1,000,000 or more. Ellis County, producing minerals having a total value of $33,702,795, advanced from second in importance in 1959 to first place in 1960. Barton County ranked second, with $30,790,851, and Russell County, with $24,852,926, again held third place, followed by Butler County, $23,620,359, and Grant County, $21,070,929. Graham County, which in 1959 placed in the $20,000,000 to $30,000,000 category, dropped down to $18,164,565 and became the top ranking county in the $10,000,000 to $20,000,000 group, which includes the following counties listed in order of rank, Grant, Stafford, Rooks, Rice. Greenwood, Stevens, Kingman, Morton, Reno, Cowley, Allen, Haskell, Barber, McPherson, Marion, and Sedgwick. Table 2 summarizes the range of value of the 1959 and 1960 mineral production per county.
Table 2—Range of value of 1959 and 1960 mineral production per county
| Value of annual production, millions of dollars |
Number of counties producing minerals valued in this range |
|
|---|---|---|
| 1959 | 1960 | |
| 30-40 | 2 | 2 |
| 20-30 | 4 | 3 |
| 10-20 | 14 | 16 |
| 1-10 | 39 | 39 |
| 0-1 | 43 | 40 |
| No production | 3 | 5 |
Counties that produced the greatest dollar value of minerals ($10,000,000 or more) are those in which oil is found. Most of these are western counties, but Allen, Butler, Cowley, Greenwood, and Marion, all eastern counties, are included. Of the 100 counties reporting mineral production, 28 gained their wealth chiefly from the nonfuels and of these, 9 produced minerals having a value of $1,000,000 or more. Sedgwick County exploited the most different minerals, eight, followed by Grant and Reno with seven minerals each and Barber, Cherokee, Kearny, Kingman, and Wilson Counties with six each (Fig. 1). A summary evaluation of mineral fuels and nonfuel minerals for Kansas counties in 1960 is presented in Table 3 and Figure 2.
Figure 1—Map of Kansas showing mineral commodities produced in each county in 1960. Minerals are listed in order of value within counties. Bu—butane. C—cement. CB—carbon black. Cl—clay. Co——coal. Dm—diatomaceous marl. G—natural gas. Gp—gypsum. H—helium. LP—liquefied petroleum gases. NC—natural cement. NG—natural gasoline. O—oil. P—pumicite or volcanic ash. Ph—lead. Pe—perlite. Pr—e—propane. S—salt. SG—sand and gravel. St—stone. V—vermiculite. Zn—zinc.
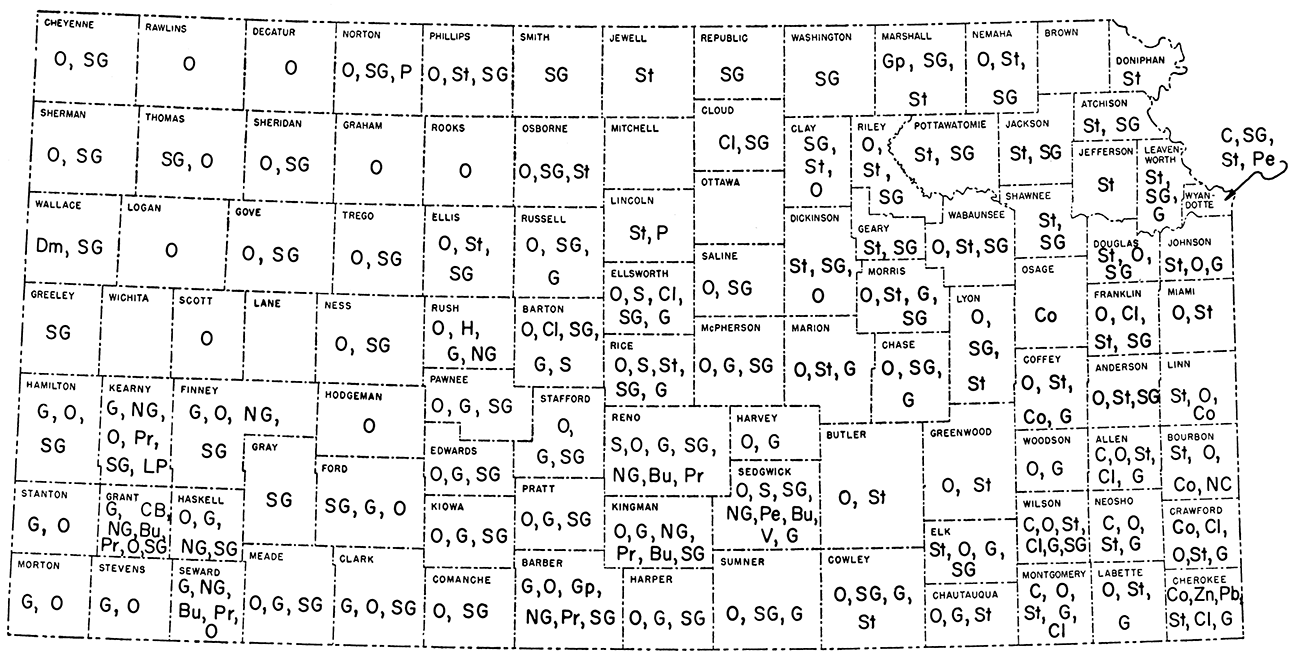
Figure 2—Map of Kansas showing range of value of 1960 mineral production by county.
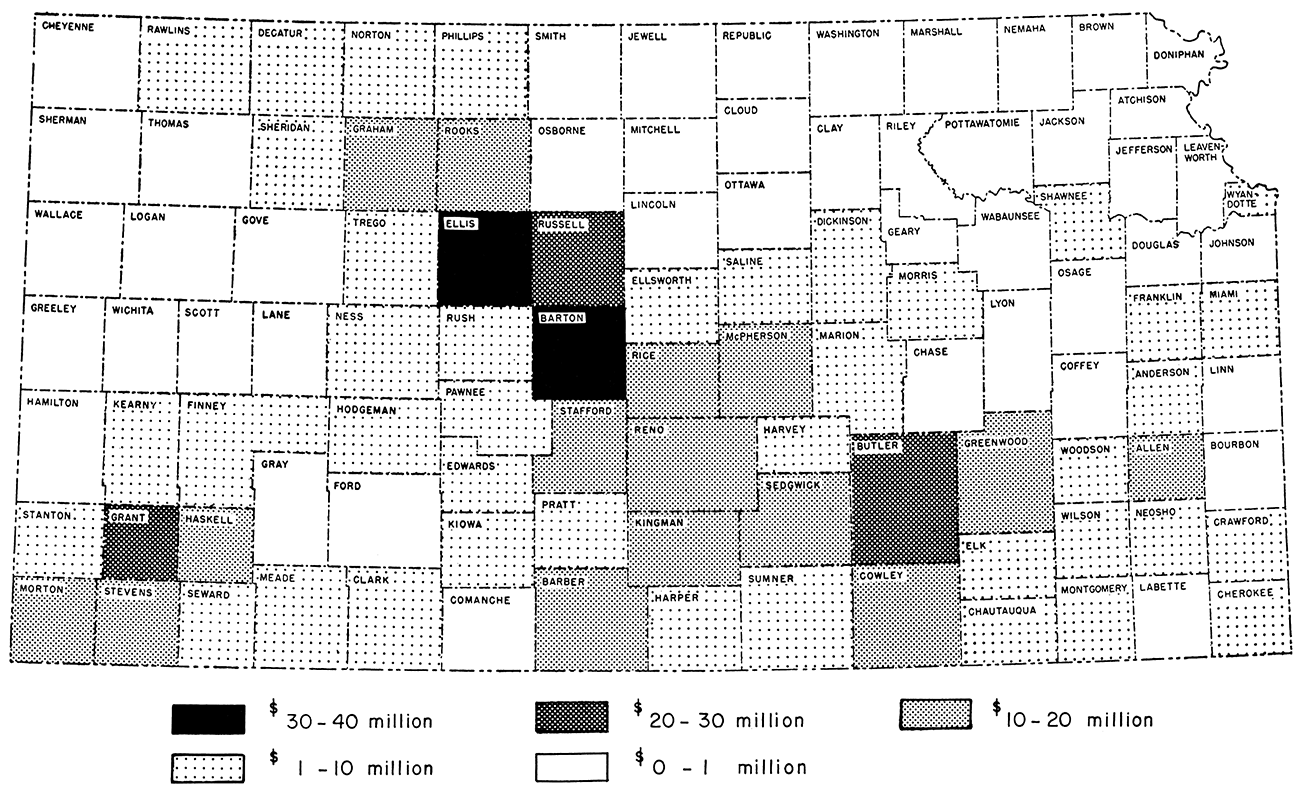
Table 3—Value of mineral production in Kansas, by county, in 1960
| County | Value of mineral production ($) | Commoditiesb in decreasing order of value |
||
|---|---|---|---|---|
| Fuelsa | Nonfuels | Total | ||
| Allen | 2,772,406 | 8,440,055 | 11,212,461 | C, O, St, Cl, G |
| Anderson | 1,199,990 | 130,410 | 1,330,400 | O, St, SG |
| Atchison | 265,172 | 265,172 | St, SG | |
| Barber | 10,209,068 | 796,708 | 11,005,776 | G, O, Gp, NG, Pr, SG |
| Barton | 30,509,270 | 281,581 | 30,790,851 | O, Cl, SG, G, S |
| Bourbon | 93,309 | 369,372 | 462,681 | St, O, Co, NC |
| Brown | ||||
| Butler | 23,164,759 | 455,600 | 23,620,359 | O, St |
| Chase | 311,889 | 7,975 | 319,864 | O, SG, G |
| Chautauqua | 2,514,871 | 10,000 | 2,524,871 | O, G, St |
| Cherokee | 2,671,944 | 886,664 | 3,558,608 | Co, Zn, Pb, St, Cl, G |
| Cheyenne | 39,112 | 15,131 | 54,243 | O,SG |
| Clark | 1,333,288 | 21,329 | 1,354,617 | G, O, SG |
| Clay | 29,469 | 337,018 | 366,487 | SG, St, O |
| Cloud | 298,231 | 298,231 | Cl, SG | |
| Coffey | 272,245 | 52,694 | 324,939 | O, St, Co, G |
| Comanche | 68,657 | 9,438 | 78,095 | O, SG |
| Cowley | 11,062,301 | 259,734 | 11,322,035 | O, SG, G, St |
| Crawford | 1,411,638 | 240,329 | 1,651,967 | Co, Cl, O, St, G |
| Decatur | 1,118,297 | 1,118,297 | O | |
| Dickinson | 184,155 | 1,075,664 | 1,259,819 | St, SG, O |
| Doniphan | 376,767 | 376,767 | St | |
| Douglas | 117,338 | 169,106 | 256,444 | St, O, SG |
| Edwards | 2,505,528 | 17,469 | 2,522,997 | O, G, SG |
| Elk | 688,690 | 714,235 | 1,402,925 | St, O, G, SG |
| Ellis | 33,654,995 | 47,800 | 33,702,795 | O, St, SG |
| Ellsworth | 5,215,790 | 937,862 | 6,153,652 | O, S, Cl, SG, G |
| Finney | 7,239,244 | 11,450 | 7,250,694 | G, O, NG, SG |
| Ford | 67,625 | 133,850 | 201,475 | SG, G, O |
| Franklin | 925,108 | 250,871 | 1,175,979 | O, Cl, St, SG |
| Geary | 549,175 | 549,175 | St, SG | |
| Gove | 30,451 | 5,012 | 35,463 | O, SG |
| Graham | 18,164,565 | 18,164,565 | 0 | |
| Grant | 21,062,929 | 8,000 | 21,070,929 | G, CB, NG, Bu, Pr, O, SG |
| Gray | * | * | SG | |
| Greeley | 11,090 | 11,090 | SG | |
| Greenwood | 14,228,029 | 146,500 | 14,374,529 | O, St |
| Hamilton | 539,641 | 8,709 | 548,350 | G, O, SG |
| Harper | 4,134,708 | 48,326 | 4,183,034 | O, G, SG |
| Harvey | 1,993,847 | 1,993,847 | O, G | |
| Haskell | 11,162,445 | 9,720 | 11,172,165 | O, G, NG, SG |
| Hodgeman | 1,207,361 | 1,207,361 | O | |
| Jackson | 113,999 | 113,999 | St, SG | |
| Jefferson | * | * | St | |
| Jewell | * | * | St | |
| Johnson | 22,742 | 213,287 | 236,029 | St, 0, G |
| Kearny | 8,598,393 | 35,144 | 8,633,537 | G, NG, O, Pr, SG, LP |
| Kingman | 12,613,299 | 11,000 | 12,624,299 | O, G, NG, Pr, Bu, SG |
| Kiowa | 2,831,283 | 29,974 | 2,861,257 | O, G, SG |
| Labette | 298,269 | 126,503 | 424,772 | O, St, G |
| Lane | ||||
| Leavenworth | 465 | 496,473 | 496,938 | St, SG, G |
| Lincoln | * | * | St, P | |
| Linn | 189,091 | 335,731 | 524,822 | St, O, Co |
| Logan | 11,589 | 11,589 | O | |
| Lyon | 466,765 | 200,662 | 667,427 | O, SG, St |
| McPherson | 10,431,945 | 8,411 | 10,440,356 | O, G, SG |
| Marion | 9,902,094 | 445,884 | 10,347,978 | O, St, G |
| Marshall | 494,314 | 494,314 | Gp, SG, St | |
| Meade | 4,599,546 | 4,750 | 4,604,296 | O, G, SG |
| Miami | 1,110,542 | 203,372 | 1,313,914 | O, St |
| Mitchell | ||||
| Montgomery | 1,406,441 | 3,374,773 | 4,781,214 | C, O, St, G, Cl |
| Morris | 1,292,492 | 96,668 | 1,389,160 | O, St, G, SG |
| Morton | 12,445,844 | 12,445,844 | G, O | |
| Nemaha | 28,631 | 10,662 | 39,293 | O, St, SG |
| Neosho | 1,345,771 | 6,172,823 | 7,518,594 | C, O, St, G |
| Ness | 1,743,224 | 48,000 | 1,791,224 | O, SG |
| Norton | 2,443,542 | 4,390 | 2,447,932 | O, SG, P |
| Osage | 24,831 | 24,831 | Co | |
| Osborne | 182,954 | 31,298 | 214,252 | O, SG, St |
| Ottawa | ||||
| Pawnee | 4,181,328 | 78,729 | 4,260,057 | O, G, SG |
| Phillips | 5,605,864 | 26,436 | 5,632,300 | O, St, SG |
| Pottawatomie | 220,463 | 220,463 | St, SG | |
| Pratt | 5,623,288 | 36,588 | 5,659,876 | O, G, SG |
| Rawlins | 1,169,883 | 1,169,883 | O | |
| Reno | 2,830,970 | 9,165,477 | 11,996,447 | S, O, G, SG, NG, Bu, Pr |
| Republic | * | * | SG | |
| Rice | 13,340,626 | 2,327,811 | 15,668,437 | O, S, St, SG, G |
| Riley | 613,359 | 180,425 | 793,784 | O, St, SG |
| Rooks | 16,058,630 | 16,058,630 | O | |
| Rush | 1,452,308 | 1,452,308 | O, H, G, NG | |
| Russell | 24,790,610 | 62,316 | 24,852,926 | O, SG, G |
| Saline | 1,925,285 | 514,337 | 2,439,622 | O, SG |
| Scott | 125,040 | 125,040 | O | |
| Sedgwick | 6,994,565 | 3,014,608 | 10,009,173 | O, S, SG, NG, Pe, Bu, V, G |
| Seward | 5,757,938 | 5,757,938 | G, NG, Bu, Pr, O | |
| Shawnee | 1,075,343 | 1,075,343 | St, SG | |
| Sheridan | 1,330,429 | 7,500 | 1,337,929 | O, SG |
| Sherman | 358,467 | 23,500 | 381,967 | O, SG |
| Smith | 5,850 | 5,850 | SG | |
| Stafford | 17,165,467 | 20,902 | 17,186,369 | O, G, SG |
| Stanton | 2,495,716 | 2,495,716 | G, O | |
| Stevens | 13,447,800 | 13,447,800 | G, O | |
| Sumner | 9,156,639 | 92,699 | 9,249,338 | O, SG, G |
| Thomas | 5,696 | 96,750 | 102,446 | SG, O |
| Trego | 4,705,790 | 279,857 | 4,985,647 | O, SG |
| Wabaunsee | 754,085 | 52,759 | 806,844 | O, St, SG |
| Wallace | 67,560 | 67,560 | Dm,SG | |
| Washington | * | * | SG | |
| Wichita | ||||
| Wilson | 554,494 | 4,265,749 | 4,820,243 | C, O, St, Cl, G, SG |
| Woodson | 2,193,377 | 2,193,377 | O, G | |
| Wyandotte | 7,501,243 | 7,501,243 | C, SG, St, Pe | |
| Unassigned | 12,513,000 | 12,513,000 | Cl prod., St, SG | |
| Undistributed | $ 1,710,997c | $ 1,710,997c | ||
| * Undistributed values may not be revealed. (a) The new minimum price of 11 cents per 1000 cubic feet of natural gas measured at 14.65 psia (pounds per square inch absolute) established by the Kansas Corporation Commission for the Hugoton Gas Area has been applied to all Kansas gas production, including minor amounts of unprorated production, much of which probably brought a higher price. (b) Commodities: Bu, butane; C, cement; CB, carbon black; CL clay; Co, coal; Dm, diatomaceous marl; G, natural gas; Gp, gypsum; H, helium; LP, liquefied petroleum gases; NC, natural cement; NG, natural gasoline; O, oil; P, pumicite (volcanic ash); Pb, lead; Pe, perlite; Pr, propane; S, salt; SG, sand and gravel; St, stone; V, vermiculite; Zn, zinc. (c) Adjusted to eliminate duplication in value of clays and stone. |
||||
Much of the information compiled in this report was obtained from the tabulation sheets provided by the United States Bureau of Mines, with which the State Geological Survey of Kansas has been cooperating for many years in collecting mineral statistics for the state. Coal statistics were derived from the reports of Mr. John Delplace, Chief Mine Inspector of the Mine Inspection Section and Mine Rescue Station of the Kansas Labor Department at Pittsburg, Kansas. Data pertaining to petroleum, natural gas, and related products were summarized from reports by Goebel and others on oil and gas developments in Kansas published as State Geological Survey Bulletins 147 and 155. Many of the data on oil and gas production in these bulletins were supplied by the Kansas Corporation Commission, Conservation Division. Other data (pertaining to expansion, modernization, and organization of new mineral producing companies) were obtained from Midwest Industry Magazine and Kansas!, the latter a publication of the Kansas Industrial Development Commission, Topeka.
The mineral fuels—coal, oil, natural gas, the natural gas liquids, and related products (helium and carbon black)—contributed, as in former years, the greatest share to the mineral wealth produced in Kansas. In 1960 it amounted to $426,968,186, or approximately 85.32 percent of the total value, as compared to $442,788,460, or 84.4 percent in 1959 (Table 4, Fig. 3).
Figure 3—Percent and value of mineral production in Kansas, 1960.
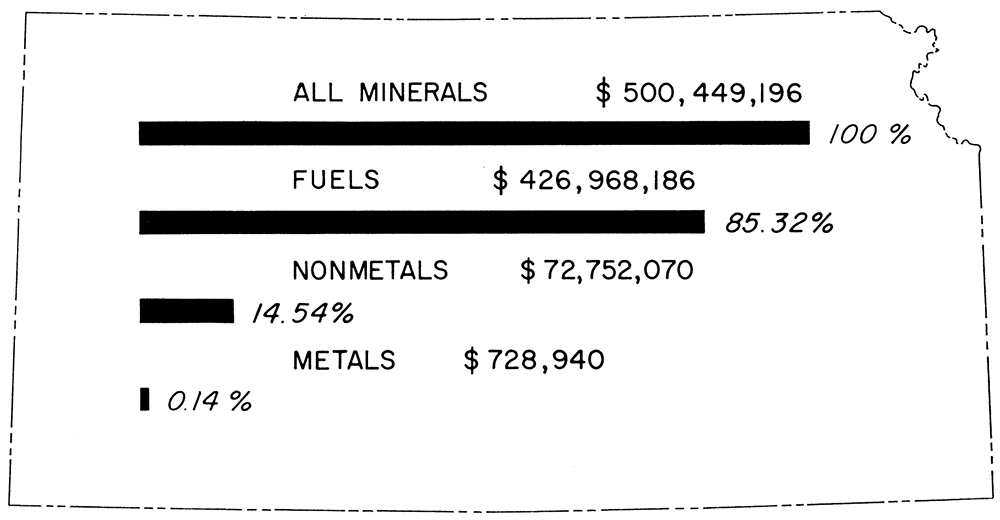
Table 4—Value of minerals produced in Kansas in 1959 and 1960
| Year | Mineral fuels and associated products |
Percent of total |
Nonmetals (excluding mineral fuels) |
Percent of total |
Metals | Percent of total |
All minerals |
|---|---|---|---|---|---|---|---|
| 1959 | $442,788,460 | 84.39 | $81,501,619 | 15.54 | $344,540 | 0.07 | $524,634,619 |
| 1960 | 426,968,186 | 85.32 | 72,752,070 | 14.54 | 728,940 | 0.14 | 500,449,196 |
For the second consecutive year, coal production in Kansas increased. In 1960, Kansas produced 876,343 tons of coal as compared to 774,360 tons in 1959, an increase of 13.1 percent. Of the coal produced in 1960, approximately 99.5 percent or 872,742 tons came from strip mines, whereas only 0.5 percent or 3,601 tons was deep or shaft-mined coal. In 1960, 18 coal companies operating in six counties produced coal from 18 mines of which 16 were strip mines and 2 were shaft mines. In 1959, the total of 19 mines included 17 strip and 2 shaft mines.
Of the six counties producing coal in 1960, Cherokee County (580,812 tons) was foremost, as it has been since 1953. Next in importance was Crawford County (282,717 tons) followed by Osage, Bourbon, Coffey, and Linn Counties, none of which produced as much as 6,000 tons. Franklin County, active in 1959, produced no coal in 1960.
The average price per ton of coal in 1960 was about $4.60. On this basis, value of coal mined in Kansas in 1960 amounted to $4,031,177 or $539,477 more than in 1959, a gain of 15.4 percent. Production, value, and number of mines in Kansas by counties in 1960 are presented in Table 5.
Table 5—Kansas coal production by type of mine and by county, value of coal, rank of counties, and number of mines, 1959 and 1960
| County | 1959 | 1960 | Rank | Number of mines, 1960 |
||||||||
|---|---|---|---|---|---|---|---|---|---|---|---|---|
| Production, short tons | Value ($) | Production, short tons | Value ($) | |||||||||
| Strip | Deep | Total | Strip | Deep | Total | 1959 | 1960 | Strip | Deep | |||
| Bourbon | 4,551 | 4,551 | 22,755 | 4,206 | 4,206 | 19,347 | 4 | 3 | 1 | |||
| Cherokee | 484,096 | 484,096 | 2,178,432 | 580,812 | 580,812 | 2,671,735 | 1 | 1 | 4 | |||
| Coffey | 2,230 | 2,230 | 11,150 | 2,046 | 2,046 | 9,412 | 5 | 6 | 1 | |||
| Crawford | 273,344 | 2,784 | 276,128 | 1,242,576 | 281,633 | 1,084 | 282,717 | 1,300,498 | 2 | 2 | 6 | 1 |
| Franklin | 157 | 157 | 785 | 7 | ||||||||
| Linn | 1,303 | 1,303 | 6,515 | 1,164 | 1,164 | 5,354 | 6 | 5 | 2 | |||
| Osage | 2,951 | 2,944 | 5,895 | 29,475 | 2,881 | 2,517 | 5,398 | 24,831 | 3 | 4 | 2 | 1 |
| All counties | 768,632 | 5,728 | 774,360 | 3,491,688 | 872,742 | 3,601 | 876,343 | 4,031,177 | 16 | 2 | ||
| Percent | 99.2 | 0.8 | 100 | 99.5 | 0.5 | 100 | ||||||
| Percent change from 1959 | +13.5 | -37.2 | +13.1 | +15.4 | ||||||||
The Pittsburg-Midway, Clemens, and Apex-Compton coal companies produced approximately 94 percent of Kansas' total coal output of 876,343 tons. The Blue Ribbon Coal Company's mine in Crawford County and the Bell Mine in Osage County were the only two shaft mines in operation in 1960.
Measured and indicated coal reserves in Kansas at the end of 1960 are estimated at 1,114,550,000 tons, of which approximately 835,912,000 tons is judged to be recoverable coal.
Coal companies operating in Kansas on record December 31, 1960, are listed in Table 6.
Table 6—Directory of Kansas coal mining companies on record as of December 31, 1960
| County | Coal company | Office address |
|---|---|---|
| Bourbon | Garrett | Route 2, Garland |
| Bourbon | Pellett | Route 5, Fort Scott |
| Cherokee | Black Diamond | Weir |
| Cherokee | Pittsburg-Midway Coal Mining | P. O. Box 269, Pittsburg |
| Cherokee | S & M | Route 1, Scammon |
| Cherokee | Wilkinson | Weir |
| Coffey | S. L. Rogers | Lebo |
| Crawford | Apex-Compton† | P. O. Box 211, Pittsburg |
| Crawford | Blue Ribbon*† | Girard |
| Crawford | Cliff Carr | Route 1, Mulberry |
| Crawford | Davis | Cherokee |
| Crawford | Morriss | Route 1, Arcadia |
| Crawford | Palmer & Son | Mulberry |
| Linn | Fyock | Prescott |
| Linn | Wood | Route 1, Pleasanton |
| Osage | Bell* | Burlingame |
| Osage | Graham | Reading |
| Osage | Johnson | Scranton |
| * Operators of shaft mines, all others strip mines. † Ceased operations in 1960. |
||
Oil production in 1960 amounted to 113,344,548 barrels compared to ]19,473,875 barrels in 1959, a decrease of 6,129,327 barrels or 5.1 percent. In 1960 value of the oil was $336,633,308 or $18,204,101 (5.1 percent) less than in 1959, when oil produced was valued at $354,837,409. The price of oil per barrel in 1960 was $2.97, the same as in 1959 (Table 7). Of the total oil produced in 1960, approximately 17 percent or 19.3 million barrels was obtained by secondary recovery methods. Kansas ranked sixth among the oil producing states as in 1959, and oil ranked first among the mineral commodities produced in the state (Table 1).
Table 7—Crude oil production, value, and reserves, and number of oil fields named and revived in Kansas, 1959 and 1960
| 1959 | 1960 | Percent change from 1959 |
||
|---|---|---|---|---|
| Production, bbl. | 119,473,875a | 113,344,548a | -5.1 | |
| Value | $354,837,409 | $336,633,308 | -5.1 | |
| Price per bbl. | $ 2.97 | $ 2.97 | ||
| Reserves, million bbl. | 917.5 | 883.8 | -3.7 | |
| Oil fields: | ||||
| Named | 159b | 78c | ||
| Revived | 8b | 7 | ||
| (a) Figures supplied by State Corporation Commission, Conservation Division. (b) Two fields produced both oil and gas. (c) One field produced both oil and gas. |
||||
Kansas has produced to the end of 1960 a recorded cumulative total of at least 3,243.3 million barrels of crude oil valued at $6,686.6 million.
The number of counties actually reporting production of oil was 78, or 2 fewer than in 1959. Among the 10 leading oil-producing counties (Table 8) several changes from 1959 are to be noted. Ellis County, which ranked second in 1959, moved to first place; Barton County, ranked first in 1959, was second in 1960; and Stafford County exchanged places with Rooks County (sixth and seventh places respectively) .
Table 8—Ten leading oil producing counties in Kansas, 1959 and 1960
| County | Production, bbl. | Rank | ||
|---|---|---|---|---|
| 1959 | 1960 | 1959 | 1960 | |
| Ellis | 11,222,654 | 11,2311,495 | 2 | 1 |
| Barton | 11,404,683 | 10,245,807 | 1 | 2 |
| Russell | 8,922,064 | 8,336,647 | 3 | 3 |
| Butler | 7,929,366 | 7,799,582 | 4 | 4 |
| Graham | 6,889,023 | 6,116,015 | 5 | 5 |
| Stafford | 5,845,204 | 5,737,031 | 7 | 6 |
| Rooks | 6,066,361 | 5,634,607 | 6 | 7 |
| Greenwood | 5,844,543 | 4,758,538 | 8 | 8 |
| Rice | 4,666,987 | 4,474,824 | 9 | 9 |
| Cowley | 3,858,450 | 3,672,337 | 10 | 10 |
Sixteen counties (one more than in 1959) had a recorded and estimated cumulative production of 50 million barrels or more of oil at the end of 1960 (Table 9). Of these, Butler County, in eastern Kansas, ranked first, having produced 445,315,949 bbl. of oil, 102,853,738 bbl. more than second place Barton County. Russell County ranked third in both 1959 and 1960, but Ellis County, fifth in 1959, displaced Greenwood County in fourth place. All other counties held their respective places. Chautauqua County in 1960 became the 16th county to attain cumulative oil production of 50,000,000 bbl.
Table 9—Leading oil producing counties in Kansas based on estimated and recorded cumulative production to end of 1960
| County | Cumulative production, bbl. | Rank | ||
|---|---|---|---|---|
| 1959 | 1960 | 1959 | 1960 | |
| Butler | 437,516,367 | 445,315,949 | 1 | 1 |
| Barton | 332,190,198 | 342,462,571 | 2 | 2 |
| Russell | 306,454,155 | 314,790,802 | 3 | 3 |
| Ellis | 226,888,085 | 238,121,434 | 5 | 4 |
| Greenwood | 228,886,912 | 233,645,450 | 4 | 5 |
| Rice | 225,846,069 | 230,330,843 | 6 | 6 |
| McPherson | 148,269,306 | 151,772,104 | 7 | 7 |
| Stafford | 138,426,185 | 144,205,806 | 8 | 8 |
| Cowley | 100,346,582 | 104,018,919 | 9 | 9 |
| Ellsworth | 93,924,791 | 95,679,582 | 10 | 10 |
| Rooks | 86,537,643 | 92,172,250 | 11 | 11 |
| Sumner | 72,893,539 | 75,964,022 | 12 | 12 |
| Sedgwick | 70,470,157 | 72,760,931 | 13 | 13 |
| Reno | 63,896,384 | 64,674,301 | 14 | 14 |
| Graham | 57,444,711 | 63,560,726 | 15 | 15 |
| Chautauqua | 50,582,892 | 16 | ||
Of the 1979 producing oil fields in Kansas, most of the larger ones are in western Kansas (Table 10). Of the six major oil fields, only the El Dorado field in Butler County lies east of the Sixth Principal Meridian, which is the division line between eastern and western Kansas insofar as oil and gas are concerned. All of the six leading oil fields produced less oil in 1960 than they did in 1959. The only change in rank was that the Hall-Gurney field in Russell and Barton Counties advanced from fourth to third position, displacing the Chase-Silica field of Rice-Barton-Stafford Counties.
Table 10—Leading oil fields in Kansas, 1959 and 1960
| Field | Rank | County | Annual production, bbl. | ||
|---|---|---|---|---|---|
| 1959 | 1960 | 1959 | 1960 | ||
| Bemis-Shutts | 1 | 1 | Ellis-Rooks | 4,867,675 | 4,471,955 |
| El Dorado | 2 | 2 | Butler | 4,443,182 | 4,291,069 |
| Hall-Gurney | 4 | 3 | Russell-Barton | 3,253,461 | 3,228,587 |
| Chase-Silica | 3 | 4 | Rice-Barton-Stafford | 3,689,358 | 3,219,167 |
| Trapp | 5 | 5 | Russell- Barton | 3,120,143 | 2,752,269 |
| Kraft-Prusa | 6 | 6 | Barton-Ellsworth | 2,889,685 | 2,526,426 |
Following the trend of recent years, Kansas in 1960 continued to import more and export less crude oil than it did in 1959 but refined and retained in the state a larger percentage of the oil than in the previous year. Imports of oil increased from 41,884,139 bbl. in 1959 to 43,697,343 bbl. in 1960, an increase of 4.3 percent, whereas exports decreased to 47,355,966 bbl. in 1960 from 51,258,050 bbl. in 1959, a decrease of 7.7 percent. Total quantity of oil accounted for in 1960 was 157,041,891 bbl. compared to 161,358,014 bbl. in 1959, a decrease of 2.1 percent. Crude oil refined and retained in Kansas amounted to 109,685,925 bbl. in 1960 and 110,099,964 bbl. in 1959. Although the actual amount of oil refined and retained in Kansas in 1960 was less than it was in 1959, the percentage of the total quantity of oil accounted for was greater. Data on production, imports, exports, total quantity of oil accounted for, and amount and percent of crude oil refined and retained in Kansas in 1959 and 1960 are listed in Table 11.
Table 11—Production, imports, and exports of crude oil, and quantity refined and retained in Kansas, 1959 and 1960. [Adapted from Conservation Division, State Corporation Commission.]| Year | Production, bbl. |
Imports, bbl. |
Exports, bbl. |
Total quantity accounted for, production plus imports, bbl. |
Refined and retained | |
|---|---|---|---|---|---|---|
| Quantity, bbl. |
Percent of oil accounted for |
|||||
| 1959 | 119,473,875 | 41,884,139 | 51,258,050 | 161,358,014 | 110,099,964 | 68.2 |
| 1960 | 113,344,548 | 43,697,343 | 47,355,966 | 157,041,891 | 109,685,925 | 69.2 |
Table 12—Number of oil and gas fields named, revived, and abandoned, by county, in 1960
| County | New | Old | Revived | |||||
|---|---|---|---|---|---|---|---|---|
| Oil | Gas | Oil and gas |
Dry and abandoned* |
Abandoned | Oil | Gas | Total | |
| Barton | 9 | 1 | 1 | 11 | ||||
| Butler | 6 | 1 | 7 | |||||
| Chautauqua | 1 | 1 | 2 | |||||
| Clark | 1 | 1 | ||||||
| Comanche | 1 | 1 | ||||||
| Cowley | 3 | 2 | 5 | |||||
| Edwards | 1 | 1 | 2 | |||||
| Elk | 1 | 1 | ||||||
| Ellis | 4 | 2 | 2 | 8 | ||||
| Ellsworth | 1 | 1 | ||||||
| Ford | 1 | 1 | ||||||
| Graham | 1 | 1 | ||||||
| Harper | 1 | 1 | 2 | |||||
| Harvey | 1 | 1 | ||||||
| Haskell | 4 | 4 | ||||||
| Hodgeman | 2 | 1 | 3 | |||||
| Kingman | 3 | 1 | 2 | 1 | 7 | |||
| Kiowa | 2 | 2 | ||||||
| McPherson | 2 | 2 | ||||||
| Marion | 2 | 1 | 1 | 4 | ||||
| Morton | 1 | 1 | 2 | |||||
| Ness | 1 | 1 | ||||||
| Norton | 1 | 1 | ||||||
| Pratt | 2 | 2 | 4 | |||||
| Rawlins | 1 | 1 | ||||||
| Reno | 1 | 1 | 2 | |||||
| Rice | 2 | 3** | 5 | |||||
| Rooks | 6 | 6 | ||||||
| Rush | 2 | 2 | ||||||
| Russell | 1 | 1 | 2 | |||||
| Saline | 2 | 2 | ||||||
| Scott | 1 | 1 | ||||||
| Sedgwick | 1 | 1 | ||||||
| Seward | 4 | 1 | 5 | |||||
| Stafford | 6 | 1 | 1 | 1 | 9 | |||
| Stevens | 1 | 1 | ||||||
| Sumner | 6 | 1 | 7 | |||||
| Trego | 1 | 1 | ||||||
| Total | 77 | 12 | 5 | 5 | 10 | 7 | 3 | 119 |
| * Discovered and abandoned in same year. ** One gas and oil, two oil fields. |
||||||||
Crude oil reserves in 1960 are estimated at 883.8 million bbl. or 3.7 percent less than in 1959 (Table 7). Crude oil reserves have gradually declined since 1955. Of the 99 new fields, 82 were oil fields, 5 of which were later abandoned, 12 were gas fields, and 5 were oil and gas fields. Counties in which new oil fields were named in 1960 are listed in Table 12.
In 1960, expansion and new construction in the oil industry in Kansas were minor. As in 1959, 13 petroleum refineries operated in 1960; they processed a total of 109,685,925 bbl. of crude oil (Table 13). [Note: For names of oil companies, independent operators, and consulting geologists, see Kansas Geological Society Directory published by the Society at 508 East Murdock Street, Wichita 5, and Morrison Petroleum Directory of Kansas, published annually by John H. Morrison, Box 191, Wichita]
Table 13—Directory of petroleum refineries in Kansas as of December 31, 1960
| Company | Office address | County |
|---|---|---|
| American Oil Co. (a) | Neodesha | Wilson |
| American Petrofina Co. of Texas | El Dorado | Butler |
| Anderson-Prichard Oil Corp. | Arkansas City | Cowley |
| Century Refinery Go. | Great Bend (c) | Finney |
| Cooperative Refinery Assoc. | Coffeyville | Montgomery |
| Cooperative Refinery Assoc. | P.O. Box 570, Phillipsburg | Phillips |
| Derby Refining Co. (b) | 420 W. Douglas, Wichita | Sedgwick |
| Mid-America Refining Co., Inc. | Chanute | Neosho |
| Mobil Oil Co. | Augusta | Butler |
| National Coop. Refinery Assoc. | P.O. Box 770, McPherson | McPherson |
| Phillips Petroleum Co. | 2209 Fairfax Trafficway, Kansas City |
Wyandotte |
| Skelly Oil Co. | 1401 S. Douglas Road, El Dorado |
Butler |
| Vickers Petroleum Co., Inc. | Wichita (d) | Sedgwick |
| (a) Formerly Standard Oil Co. of Indiana (b) Shut down. (c) Refinery at Shallow Water. (d) Refinery at Potwin, Butler County. |
||
The refinery of the Standard Oil Company of Indiana at Neodesha in Wilson County was renamed the American Oil Company refinery. Expansion will increase its capacity from 23,000 bbl. a day to 30,000 bbl. The National Cooperative Refinery Association began an improvement and expansion program at its McPherson plant, McPherson County, including a revamping of its petroleum coking facilities and installation of new treating equipment used in refining petroleum products.
Production of natural gas, the second most important mineral commodity recovered in the state, amounted to 632,609,850 M cu. ft. or 37,365,014 M cu. ft. (6.3 percent) more than in 1959, when production amounted to 595,244,836 M cu. ft. The value of the 1960 production, $69,587,083, likewise was greater by 6.3 percent than the 1959 value, $65,476,932, because the same estimated minimum price of natural gas (11 cents per thousand cubic feet) was used in the computation of value (Table 14). Of the total 1960 production of natural gas in Kansas, 71 percent or 451,820,153 M cu. ft. was recovered from the Hugoton Gas Area, comprising all or part of Finney, Grant, Hamilton, Haskell, Kearny, Morton, Seward, Stanton, and Stevens Counties, in southwestern Kansas (Table 15). Cumulative natural gas production in Kansas to the end of 1960 is estimated at 8.6 trillion cubic feet, of which about 63 percent (5,466,301,595 M cu. ft.) has been obtained from the Hugoton Gas Area.
Table 14—Natural gas production, value, and reserves, and gas fields named and revived in Kansas, 1959 and 1960
| 1959 | 1960 | Percent change from 1959 |
||
|---|---|---|---|---|
| Production, M cu. ft. (14.65 psia) | 595,244,836 | 632,609,850 | +6.3 | |
| Value | $65,476,932 | $69,587,083 | +6.3 | |
| Reserves, million cu. ft. | 19,981,403 | 19,608,724 | -1.9 | |
| Gas fields: | ||||
| Named | 41a | 12 | ||
| Revived | 2a | 3 | ||
| (a) Two fields produced both oil and gas. | ||||
Table 15—Production and value of natural gas in Hugoton Gas Area, Kansas, 1959 and 1960
| Year | Production, M cu. ft. (14.65 psia) |
Value | Percent of state total production |
Cumulative production to end of 1960, M cu. ft. |
|---|---|---|---|---|
| 1959 | 404,764,021 | $44,524,042 | 68.0 | 5,014,481,442 |
| 1960 | 451,820,153 | $49,700,217 | 71.0 | 5,466,301,595 |
| Percent change from 1959 |
+11.6 | +11.6 |
Natural gas was produced in 1960 in 47 counties, 3 fewer than ill 1959. Each of 17 counties, one fewer than in 1959 (Table 16), produced 2 billion cubic feet or more of gas in 1960. Of these counties. Morton, Barber, Stanton, Clark, Reno, and Hamilton produced less natural gas in 1960 than in 1959. Kiowa County surpassed Pawnee County in gas production in 1960.
Table 16—Production of natural gas in Kansas counties producing 2 billion cubic feet or more annually, 1959 and 1960
| County | Production, M cu. ft. (14.65 psia) |
Rank | ||
|---|---|---|---|---|
| 1959 | 1960 | 1959 | 1960 | |
| Stevens (a) | 103,479,190 | 122,005,132 | 1 | 1 |
| Grant (a) | 90,869,682 | 91,748,893 | 2 | 2 |
| Morton (a, b) | 85,803,592 | 76,950,127 | 3 | 3 |
| Kearny (a) | 69,576,597 | 69,931,846 | 4 | 4 |
| Barber | 55,081,079 | 53,961,070 | 5 | 5 |
| Finney (a) | 44,201,434 | 53,315,227 | 6 | 6 |
| Haskell (a) | 28,702,647 | 35,945,374 | 7 | 7 |
| Seward (a, b) | 26,228,374 | 33,009,597 | 8 | 8 |
| Stanton (a) | 23,846,214 | 21,848,436 | 9 | 9 |
| Kingman | 15,351,781 | 18,982,088 | 10 | 10 |
| Meade | 12,738,162 | 14,312,613 | 11 | 11 |
| Clark | 6,897,840 | 6,811,276 | 12 | 12 |
| Harper | 4,839,145 | 4,860,913 | 13 | 13 |
| Reno | 4,653,637 | 4,548,756 | 14 | 14 |
| Hamilton (a) | 4,254,341 | 3,963,203 | 15 | 15 |
| Kiowa | 2,617,650 | 3,384,213 | 17 | 16 |
| Pawnee | 2,744,249 | 2,869,283 | 16 | 17 |
| Rush | 2,401,929 | 18 | ||
| (a) Hugoton Gas Area counties. b Not all gas produced in Morton and Seward Counties is from the Hugoton Gas Area. |
||||
By the end of 1960, each of 23 counties had a cumulative production of natural gas (based on estimated and recorded data) of 10 billion cubic feet or more (Table 17). Harvey County in 1960 attained a cumulative production of 10,087,816 M cu. ft. of gas. Although complete production records are not available, it is certain that four eastern counties, Allen, Cowley, Montgomery, and Wilson, have each produced 10 billion cubic feet or more of gas since production started.
Table 17—Leading gas producing counties in Kansas based on estimated and recorded cumulative production to end of 1960*
| County | Cumulative production, M cu. ft. (14.65 psia) |
Rank | |
|---|---|---|---|
| 1959 | 1960 | ||
| Stevens (a) | 1,900,356,110 | 1 | 1 |
| Grant (a) | 1,112,690,744 | 2 | 2 |
| Kearny (a) | 795,991,282 | 3 | 3 |
| Morton (a, b) | 686,751,000 | 4 | 4 |
| Barber | 505,300,301 | 5 | 5 |
| Finney (a) | 431,041,398 | 6 | 6 |
| Haskell (a) | 402,946,645 | 7 | 7 |
| Seward (a, b) | 326,676,381 | 8 | 8 |
| Stanton (a) | 193,008,238 | 9 | 9 |
| Kingman | 69,758,050 | 11 | 10 |
| Meade | 65,856,833 | 10 | 11 |
| Pawnee | 43,415,354 | 12 | 12 |
| Hamilton (a) | 39,334,516 | 14 | 13 |
| Rice | 36,011,360 | 13 | 14 |
| Clark | 26,584,966 | 17 | 15 |
| Barton | 25,038,885 | 15 | 16 |
| Pratt | 23,141,982 | 16 | 17 |
| Harper | 18,848,000 | 19 | 18 |
| Reno | 15,923,683 | 21 | 19 |
| Edwards | 15,846,143 | 18 | 20 |
| Stafford | 14,740,590 | 20 | 21 |
| Kiowa | 13,825,253 | 22 | 22 |
| Harvey | 10,087,816 | 23 | |
| (a) Hugoton Gas Area counties. (b) Not all gas produced in Morton and Seward Counties is from the Hugoton Gas Area. * Several eastern Kansas counties, although no longer important gas producers. formerly yielded great quantities of gas. Published cumulative production data on gas production for eastern counties are not available. It is reasonably certain, however, from data that are extant, that Allen, Cowley, Montgomery, and Wilson Counties have each produced 10 billion cubic feet of gas or more. |
|||
Reserves of natural gas in 1960 were estimated at 19,608,724 million cubic feet or 1.9 percent less than in 1959 when the estimated reserves were listed at 19,981,403 million cubic feet (Table 14). Only 12 new gas fields were discovered in 1960, compared to 41 new gas fields (39 gas and 2 gas and oil fields) named in 1959. Three gas fields were revived in 1960, however, as compared to two in 1959 (Table 12).
Mobil Oil Company installed two compressors in the newly completed addition to its Hickok natural gasoline plant in Grant County. Cities Service Gas Company constructed a total of 32 miles of 16-inch natural gas pipeline, 13 miles between the Alden field in Rice County and the Lyons Station, 10 miles between Lyons and Hutchinson, and 9 miles near Wichita. The Kansas-Nebraska Natural Gas Company enlarged its facilities in the Hugoton Gas Area by adding 10 miles of 8-inch pipeline, 10 miles of 20-inch pipeline, and about 2 miles of 26- and 30-inch pipeline. In addition, the company laid 56 miles of 2-inch pipe to various communities. The Kansas Gas Supply Corporation had 105 miles of 4- and 16-inch pipeline under construction in the Pratt area. Panhandle Eastern Pipe Line Company completed 141 miles of 4- to 16-inch gathering lines in southwestern Kansas. The Northern Natural Gas Company had underway in 1960, in Kansas, 100 miles of 30-inch loop line and 14 miles of 24-inch pipeline between Beaver, Oklahoma, and Minneapolis, Minnesota. Several companies, including Michigan-Wisconsin Pipeline, Panhandle Eastern Pipe Line Co., Northern Natural Gas Co., and Natural Gas Pipeline Co., have projects planned and pending approval.
Kansas production of natural gas liquids—natural gasoline, propane, butane, and other liquefied gases—totaled 4,862,277 bbl. valued at $10,745,632, a decline of 12.3 percent in both quantity and value from 1959 (Table 18). Production of all the gas liquids decreased in 1960, but the greatest reduction was in the other liquefied gases group (77.7 percent less than in 1959). The price of natural gasoline was $2.31, the same as in the two previous years. Propane sold for $2.21, the same as in 1959. The price of butane was $2.01, or 5 cents less than in 1959. Other LPG commanded $1.68 a barrel, or 13 cents more than in the previous year.
Table 18—Production, value, and reserves of natural gas liquids in Kansas, 1959 and 1960*
| 1959 | 1960 | Price per bbl., 1960 |
|||
|---|---|---|---|---|---|
| Quantity, bbl.** | Value ($) | Quantity, bbl.** | Value ($) | ||
| Natural gasoline | 2,554,365 | 5,900,583 | 2,411,303 | 5,580,110 | 2.31 |
| Propane | 1,426,595 | 3,152,775 | 1,186,051 | 2,621,173 | 2.21 |
| Butane | 1,507,175 | 3,112,280 | 1,252,429 | 2,523,360 | 2.01+ |
| Other LPG | 55,848 | 86,564 | 12,494 | 20,989 | 1.68 |
| Total | 5,543,983 | $12,252,202 | 4,862,277 | $10,745,632 | |
| Percent change from 1959 | -12.3 | -12.3 | |||
| Reserves, all LPG | 196,912,000 | 198,403,000 | +0.8% change from 1959 |
||
| * Data adapted from Goebel and others, 1961. Production figures supplied by State Corporation Commission. ** 42-gallon bbl. |
|||||
Proved reserves of natural gas liquids, 198,403,000 bbl., were 0.8 percent more than in 1959, when reserves were estimated to be 196,912,000 bbl.
The plant owned by Dunn-Mar Oil & Gas Company at Otis, Rush County, was sold to Independent Lease Management Company and the plant owned by Plateau Natural Gas Company at Cheney, Sedgwick County, was sold to Kansas Hydrocarbon Company in 1960. Tuloma Gas Products Company expanded its underground facilities for storing liquefied petroleum gas in salt beds south of Hutchinson, Reno County. Likewise, the National Cooperative Refinery Association is including in its expansion program at McPherson, McPherson County, 12 new underground storage areas, each of 50,000-bbl. capacity, in underlying salt beds. The Mid-America Pipeline Company is constructing a liquid petroleum gas pipeline from Eunice, New Mexico, through McPherson to Minnesota and Wisconsin. Two booster stations are being built at the McPherson station at Conway. In addition, the company is also washing out storage tanks 400 feet below the surface in salt beds to increase storage capacity from 75,000 bbl. to 150,000 bbl.
In 1960, natural gasoline and liquefied petroleum gas were produced by 11 companies at 14 plants in 10 counties (Table 19).
Table 19—Directory of Kansas plants producing natural gasoline and liquefied petroleum gas on record as of December 31, 1960
| Plant location | Company | |
|---|---|---|
| County | Town | |
| Barber | Medicine Lodge | Skelly Oil Company |
| Finney | Holcomb | Northern Natural Gas Company |
| Grant | Ulysses | Hugoton Production Company |
| Grant | Ulysses | Pan American Petroleum Corporation |
| Grant | Ulysses | Socony Mobil Oil Company, Inc. |
| Haskell | Sublette | Northern Natural Gas Company |
| Kearny | Lakin | Colorado Interstate Gas Company |
| Kearny | Deerfield | Kansas-Nebraska Natural Gas Company |
| Kingman | Spivey | Socony Mobil Oil Company, Inc. |
| Reno | Burrton | Cities Service Oil Company |
| Rush | Otis | Independent Lease Management Company |
| Sedgwick | Wichita | Cities Service Oil Company |
| Sedgwick | Cheney | Kansas Hydrocarbon Company |
| Seward | Liberal | Panhandle Eastern Pipeline Company |
Production of helium in Kansas in 1960 was less by 2,073,700 cu. ft. than in 1959. Production in 1960 amounted to 21,930,600 cu. ft. and shipments were 21,696,300 cu. ft., whereas in 1959 production was 24,004,300 cu. ft. and shipments were 21,642,500 cu. ft. The 1960 shipments were valued at $349,750 or 2 percent more than the $342,619 in the previous year. Production and price are controlled by the Federal Government. Federal agencies pay $15.50 per 1000 cu. ft. at the production plants plus 45 cents per cylinder filling charge for shipment in cylinders. Other users pay $19.00 at the plant and an additional $2.00 per 1000 cu. ft. for helium supplied in standard cylinders.
Helium was produced at the United States Bureau of Mines plant at Otis, Rush County. The gas is extracted from helium-bearing natural gas from about 80 wells distributed in Barton, Pawnee, and Rush Counties. Helium-contributing gas fields include the Otis-Albert field in Rush and Barton Counties, the Ryan field in Rush and Pawnee Counties, the Pawnee Rock field in Pawnee County, the Reichel field in Rush County, and the Behrens and Unruh fields in Barton County. The Ash Creek field in Pawnee County and the Bergtal and Dundee fields in Barton County are no longer producing helium, as they have been abandoned.
Carbon black production and value in Kansas in 1960 were 4.8 and 12 percent respectively less than in 1959. An estimated 3.91 billion cubic feet of natural gas and 0.40 million barrels of natural gas liquids were consumed in the manufacture of carbon black in 1960. Carbon black was produced by the Columbian Carbon Company at Hickok and by the United Carbon Company at Ryus, both in Grant County.
The Inland Asphalt Company established an asphalt production plant of 1,000-ton daily capacity in Kansas City, Wyandotte County. A second new asphalt plant, of 300-ton capacity, has been built at Hays, Ellis County, to serve an area within a 40-mile radius of Hays.
In 1960, the nonmetallic minerals exclusive of the mineral fuels and associated products contributed about 14 percent or $72,752,070 of the state's total mineral wealth, $518,653,297, produced during the year (Table 4, Fig. 3). The most important nonmetallic minerals produced, listed in order of rank in the state, are cement third, stone fourth, salt fifth, clay and clay products sixth, and sand and gravel seventh. In addition, diatomaceous marl, gypsum, pumicite or volcanic ash, perlite and vermiculite products, and salt brine are included among the nonmetallic mineral commodities.
Total production and total shipments of cement, excluding natural cement, in Kansas in 1960 were 8,287,686 bbl. and 8,161,503 bbl. respectively; whereas in 1959, total cement production amounted to 10,525,063 bbl. and total shipments to 10,405,209 bbl. The decline in production amounted to 21.3 percent, and shipments decreased 21.6 percent. Value of shipments in 1960 was $26,372,821, or $5,909,866 less than in 1959, a decrease of 18.3 percent. Of the total quantity of cement produced, 7,996,282 bbl. or 96.3 percent was portland cement and 291,404 bbl. or 3.7 percent was masonry cement. Production of portland cement in 1960 was less by 2,180,901 bbl. (21.4 percent) than it was in 1959. Shipments of portland cement in 1960 were 21.7 percent less in quantity and 18.4 percent less in value than shipments in 1959. Quantity and value of portland cement shipped in 1960 were respectively 7,876,834 bbl. and $25,194,299, whereas in 1959 the quantity and value were 10,055,944 bbl. and $30,889,337. The average price of portland cement in 1960 was $3.20 per barrel, 13 cents more than in the previous year. Kansas produced 291,404 bbl. of masonry cement in 1960, or 16.2 percent less than in 1959. Shipments and value of masonry cement in 1960 were 284,669 bbl. and $1,178,522 respectively, representing an 18.5 percent decrease in quantity and a 15.4 percent decrease in value from 1959, when shipments of 349,265 bbl. were valued at $1,393,350. The average price per barrel of masonry cement in 1960 was $4.14 or 15 cents more than in 1959. Data on production, shipments, and value of portland and masonry cement are presented in Table 20.
Table 20—Production, shipments, and value of portland and masonry cement in Kansas, 1959 and 1960, 376-lb. bbl.
| Commodity | Production, bbl. | Shipments | |||||
|---|---|---|---|---|---|---|---|
| 1959 | 1960 | ||||||
| 1959 | 1960 | Bbl. | Value | Bbl. | Value | ||
| Portland | 10,177,183 | 7,996,282 | 10,055,944 | $30,889,337 | 7,876,834 | $25,194,299 | |
| Ave. price/bbl. | 3.07 | 3.20 | |||||
| Percent change from 1959 | -21.4 | -21.7 | -18.4 | ||||
| Masonry | 347,880 | 291,404 | 349,265 | $1,393,350 | 284,669 | $1,178,522 | |
| Ave. price/bbl. | 3.99 | 4.14 | |||||
| Percent change from 1959 | -16.2 | -18.5 | -15.4 | ||||
| Total | 10,525,063 | 8,287,686 | 10,405,209 | $32,282,687 | 8,161,503 | $26,372,821 | |
| Percent change from 1959 | -21.3 | -21.6 | -18.3 | ||||
Allen County, which includes two of the seven cement plants in the state, led in production and shipments in 1960. Neosho County was second, followed by Wyandotte, Wilson, and Montgomery Counties. Bourbon County, represented by the only natural-cement-producing company in the state, the Fort Scott Hydraulic Cement Company, Fort Scott, produced some masonry cement. Stocks on hand at year's end were 1,093,926 bbl. as compared to 1,001,142 bbl. on December 31, 1959, an increase of 9.1 percent.
Value of natural cement production is included under "Undistributed" minerals in Table 1 and is discussed later.
Kansas cement is exported to Arkansas, Illinois, Iowa, Minnesota, Missouri, Nebraska, Oklahoma, South Dakota, Texas, Wyoming, and several foreign countries. Portland cement is third in importance among the minerals produced in the state.
During 1960, the Ash Grove Lime and Portland Cement Company, at Chanute, Neosho County, completed a building 420 feet long and 90 feet high for storage of 60,000 tons of materials, including limestone, shale, clinker, gypsum, and coal. Monarch Cement Company is expanding its facilities by constructing six new storage silos to house an additional 128,000 bbl. of cement.
The seven cement producers on record as of December 31, 1960, are listed in Table 21.
Table 21—Directory of cement producers in Kansas, 1960
| County | Company | Office address | Quarry | Type |
|---|---|---|---|---|
| Allen | Lehigh Portland Cement Co. | Young Bldg., 718 Hamilton St., Allentown, Pennsylvania |
Iola | Portland and masonry |
| Allen | Monarch Cement Co. | Humboldt | Humboldt | Portland and masonry |
| Bourbon | Fort Scott Hydraulic Cement Co. | P.O. Box 267, Fort Scott | Fort Scott | Natural and masonry |
| Montgomery | Universal Atlas Cement Co. | 100 Park Ave., New York 17, New York |
Independence | Portland and masonry |
| Neosho | Ash Grove Lime & Portland Cement Co. |
101 W. 11th, Kansas City 6, Missouri |
Chanute | Portland and masonry |
| Wilson | Consolidated Cement Corp. | Fredonia | Fredonia | Portland and masonry |
| Wyandotte | Lone Star Cement Corp. | 1006 Grand Ave., Kansas City 6, Missouri |
Bonner Springs | Portland and masonry |
Total clay and shale production and value in 1960 in Kansas were somewhat less than in 1959, greatest decline being sustained in clay and shale used for the manufacture of cement; tonnages of clay and shale produced for brick, tile, and lightweight aggregate were almost the same as in 1959, although value was greater by 9.5 percent—$939,717 as compared to $858,476 in 1959. Fire clay production, chiefly in Barton, Cloud, Crawford, and Ellsworth Counties, continued to increase, being 7 percent greater in tonnage and 19.2 percent more in value than in the previous year. Clay other than fire clay, on the other hand, declined by 5.3 percent in both amount and value, chiefly because of a 31.1 percent decrease in amount and value of clay and shale used for cement, generally valued at $1.00 per ton. Quantity declined to 284,001 tons in 1960 from 411,865 tons in 1959.
Disregarding clay used for cement, Cloud, Crawford, Barton, and Franklin Counties led in 1960 in clay and shale production and value. Kansas clay and shale is used primarily for the manufacture of brick (121,779,000 were produced in 1960, or 14,978,000 fewer than in 1959), tile, cement, and lightweight aggregate (Table 22). Raw clay and shale ranked 13th among mineral commodities produced in 1960, and 6th if clay products are included.
Table 22—Clay and shale sold or used by producers in Kansas, 1959 and 1960
| Year | Brick, tile, lightweight aggregate |
Cement | Total | Clay and clay products |
|||
|---|---|---|---|---|---|---|---|
| Tons | Value | Tons | Value | Tons | Value | ||
| 1959 | 608,695 | $858,476 | 411,865 | $411,865 | 1,020,560 | $1,270,341 | $11,500,000 |
| 1960 | 609,175 | 939,717 | 284,001 | 284,001 | 893,176 | 1,223,718 | 11,500,000 |
| Percent change from 1959 | +.08 | +9.5 | -31.1 | -31.1 | -12.5 | -3.7 | |
Reserves of clay and shale are almost without limit. The most valuable clays are found in the central and north-central parts of Kansas, where reserves of strippable high-grade clays are estimated to be at least 125 billion tons.
A new shale-expanding plant having an estimated capacity of 125,000 cubic yards of lightweight aggregate per year is being planned for construction at Marquette, McPherson County, by Buildex, Inc., of Pittsburg, whose present plant is at Ottawa, Franklin County.
A directory of clay and shale producers in Kansas in 1960 is given in Table 23.
Table 23—Directory of clay and shale producers in Kansas in 1960
| County | Company | Office address | Pit location | Type plant* | ||
|---|---|---|---|---|---|---|
| Allen | Humboldt Shale Mining Co. | P.O. Drawer 97, Humboldt | Humboldt | B | ||
| Allen | Lehigh Portland Cement Co. | Young Bldg., 718 Hamilton St., Allentown, Pa. | Iola | C | ||
| Allen | Monarch Cement Co. | Humboldt | Humboldt | C | ||
| Allen | United Brick & Tile Co. | 207 Pickwick Bldg., Kansas City 42, Mo. | Iola | B | ||
| Barton | Acme Brick Co. | P.O. Box 425, Fort Worth, Texas | Great Bend | B | ||
| Barton | Kansas Brick & Tile Co. | Hoisington | Hoisington | B | ||
| Cherokee | United Brick & Tile Co. | 207 Pickwick Bldg., Kansas City 42, Mo. | Wier | B | ||
| Cloud | Cloud Ceramics | Concordia | Concordia | B | ||
| Crawford | W. S. Dickey Clay Mfg. Co. | 607-617 Commerce Trust Bldg., Kansas City 6, Mo. | Pittsburg | B | ||
| Ellsworth | Acme Brick Co. | P.O. Box 425, Fort Worth, Texas | Kanopolis | B | ||
| Franklin | Buildex, Inc. | P.O. Box 299, Pittsburg | Ottawa | A | ||
| Montgomery | United Brick & Tile Co. | 207 Pickwick Bldg., Kansas City 42, Mo. | Coffeyville | B | ||
| Montgomery | Universal Atlas Cement Co. | 100 Park Ave., New York 17, N.Y. | Independence | C | ||
| Neosho | Ash Grove Lime & Portland Cement Co. |
101 W. 11th St., Kansas City 6, Mo. | Chanute | C | ||
| Wilson | Acme Brick Co. | P.O. Box 425, Fort Worth, Texas | Buffalo | B | ||
| Wilson | General Portland Cement Co. | Ill-West Monroe St., Chicago, Ill. | Fredonia | C | ||
| Wilson | Excelsior Brick Co. | P.O. Box 32, Fredonia | Fredonia | B | ||
| * A, aggregate; B, brick; C, cement. | ||||||
Salt production and value in Kansas in 1960 exceeded production and value in 1959 by 8.0 and 3.2 percent, respectively. In 1960, seven companies in Kansas produced a total of 1,212,739 tons of salt valued at $14,108,836 (Table 24). Of the salt produced, 680,980 tons or 56.1 percent was evaporated salt, and 531,759 tons or 43.9 percent was rock salt. The quantity of rock salt was 4.2 percent greater than in the previous year but its value was 5.2 percent less. Production of evaporated salt in 1960 exceeded that of 1959 by 11.1 percent and value increased by 5.2 percent. In 1960, salt ranked fifth in value among mineral commodities produced in the state.
Table 24—Salt sold or used by producers in Kansas, 1959 and 1960, short tons
| Year | Evaporated salt | Rock salt | Total | |||
|---|---|---|---|---|---|---|
| Tons | Value | Tons | Value | Tons | Value | |
| 1959 | 612,823 | $11,017,798 | 510,292 | $2,652,687 | 1,123,115 | $13,670,485 |
| 1960 | 680,980 | 11,594,128 | 531,759 | 2,514,708 | 1,212,739 | 14,108,836 |
| Percent change from 1959 |
+11.1 | +5.2 | +4.2 | -5.2 | +8.0 | +3.2 |
| Percent of total 1960 |
56.1 | 82.2 | 43.9 | 17.8 | 100 | 100 |
Commercial salt was produced by six companies, one more than in 1959. Pawnee Salt Corporation, having headquarters at Great Bend but operating just north of Pawnee Rock in Barton County, completed an evaporating plant and began producing salt in 1960. Currently, commercial salt is produced in Barton, Ellsworth, Reno, and Rice Counties. In 1960, one of the six companies produced rock salt only, three produced evaporated salt only, and two produced both (Table 25) .
Table 25—Directory of salt companies in Kansas in 1960
| County | Company | Office address | Location of mine or well |
Type of plant |
|---|---|---|---|---|
| Barton | Pawnee Salt Corp. | Great Bend | Pawnee Rock | Evaporated |
| Ellsworth | Independent Salt Co. | 4115 Parkers Ave., Chicago 9, Illinois |
Kanopolis | Rock |
| Reno | The Barton Salt Co. | Hutchinson | Hutchinson | Evaporated |
| Reno | The Carey Salt Co. | Hutchinson | Hutchinson | Rock and evaporated |
| Reno | Morton Salt Co. | 120 S. LaSalle, Chicago 3, Illinois |
Hutchinson | Evaporated |
| Rice | American Salt Co. | 630 New York Life Bldg., K.C. 6, Mo. |
Lyons | Rock and evaporated |
| Sedgwick | Frontier Chemical Co. of Kansas, Inc.* |
P.O. Box 545, Wichita, Kansas |
Wichita | Brine |
| * Uses all salt produced to make industrial chemicals. | ||||
In addition to the commercial salt producing companies, the Frontier Chemical Company of Kansas, Inc., Wichita, a division of Vulcan Materials Company of Birmingham, Alabama, recovered salt from brine wells in Sedgwick County for use in the manufacture of industrial inorganic chemicals.
Underground storage in salt beds has been increasing. The Underground Vaults and Storage, Inc., is utilizing storage centers in the Carey Salt Company's mine at Hutchinson, Reno County. Space available for customer needs is 128 acres, all about 650 feet below the surface. Other underground storage space used by petroleum companies is listed elsewhere in this bulletin.
Sand and gravel production and value in Kansas in 1960, 9,709,939 tons valued at $6,807,599, were less than 1959 production of 11,334,128 tons valued at $7,937,205 by 14.3 percent and 14.2 percent, respectively (Table 26).
Table 26—Sand and gravel sold or used by commercial and noncommerical producers in Kansas, 1959 and 1960
| Year | Commercial | Noncommercial | Total sand and gravel | Avg. price per ton |
|||
|---|---|---|---|---|---|---|---|
| Short tons | Value | Short tons | Value | Short tons | Value | ||
| 1959 | 9,256,747 | $6,661,483 | 2,077,381 | $1,275,722 | 11,334,128 | $7,937,205 | .70 |
| 1960 | 8,177,757 | 6,147,367 | 1,532,182 | 660,232 | 9,709,939 | 6,807,599 | .70 |
| Percent change from 1959 |
-11.7 | -7.7 | -26.3 | -48.2 | -14.3 | -14.2 | |
Of the 9,709,939 tons of sand and gravel produced in 1960, 84.2 percent or 8,177,757 tons was classified as commercial sand and gravel and 15.8 percent or 1,532,182 tons as noncommercial sand and gravel. Value of the commercially produced sand and gravel was $6,147,367 or 90.3 percent, and value of the noncommercial sand and gravel was $660,232 or 9.7 percent of total value. Sand and gravel were produced in 66 counties by 122 commercial operators and at least 38 noncommercial producers, a total of 160 agencies. In 1960, sand and gravel ranked seventh in value among the minerals produced in the state. Most of the sand and gravel was used for paving and construction. Other uses include fill, filter, engine, railroad ballast, blast, molding, grinding and polishing, and miscellaneous (Table 27). Counties producing the most sand and gravel were Wyandotte and Sedgwick, which supplied 3,015,612 tons or 31 percent of the total production.
Table 27—Production of sand and gravel in Kansas, 1959 and 1960, by use
| Use | 1959 | 1960 | |||
|---|---|---|---|---|---|
| Tons | Value | Tons | Value | ||
| Sand | |||||
| Building (structural) | 3,642,410 | $2,631,741 | 3,135,841 | $2,389,579 | |
| Paving | 3,295,774 | 2,032,376 | 3,620,293 | 2,411,258 | |
| Fill | 666,318 | 352,504 | 559,166 | 258,608 | |
| Filter | 5,616 | 9,126 | |||
| Engine | 40,583 | 70,273 | 29,730 | 55,257 | |
| Miscellaneous (constr.) | 34,673 | 29,830 | |||
| Railroad ballast | 79,109 | 29,031 | 19,765 | 14,557 | |
| Blast | 18,140 | 8,138 | 1,627 | 974 | |
| Other | 362,031 | 211,723 | 35,032 | 29,239 | |
| Total | 8,139,038 | $5,365,616 | 7,407,070 | $5,168,598 | |
| Gravel | |||||
| Paving | 2,664,244 | 2,178,711 | 1,861,223 | 1,275,820 | |
| Structural | 325,314 | 258,135 | 246,341 | 231,431 | |
| Other | 205,532 | 134,743 | 195,305 | 131,750 | |
| Total | 3,195,090 | $2,571,589 | 2,302,869 | $1,639,001 | |
| Total sand and gravel | 11,334,128 | $7,937,205 | 9,709,939 | $6,807,599 | |
Sand and gravel reserves are regarded as inexhaustible because the present demand for sand and gravel is insignificant compared to the quantity available. Furthermore, sand especially is continually being replaced by new deposits brought in by streams.
A new sand company, Central Kansas Sand, Inc., located southeast of Salina, Saline County, is supplying the Salina area with commercial sand, approximately 1,100 tons per day, for industrial construction.
Sand and gravel producers that operated in 1960 are listed in Table 28.
Table 28—Directory oj sand and gravel producers on record as of December 31, 1960
| County | Company or operator | Address |
|---|---|---|
| Anderson | Anderson Co. Highway Dept. | Garnett |
| Atchison | George W. Kerford | Atchison |
| Barber | Barber Co. Highway Dept. | Medicine Lodge |
| Barton | Arkansas Sand and Gravel Co. | 1423 Second St., Great Bend |
| Barton | DuBois Sand Co. | P.O. Box 172, Great Bend |
| Barton | James Dirks | Pawnee Rock |
| Barton | Moos Bros. Sand Co. | P.O. Box 406, Great Bend |
| Barton | Klepper Sand Co. | Claflin |
| Chase | Chase Co. Highway Dept. | Cottonwood Falls |
| Cheyenne | New Era Sand and Gravel Co. | St. Francis |
| Clark | Clark Co. Highway Dept. | Ashland |
| Clay | Alsop Sand Co. | Wakefield |
| Clay | Clay Center Concrete and Sand Co., Inc. | Clay Center |
| Clay | Ernest R. Fyfe | Wakefield |
| Cloud | Earl Beaver Sand Co., Inc. | Glasco |
| Cloud | Fyfe Sand and Gravel Co. | Concordia |
| Comanche | Comanche Co. Road Dept. | Coldwater |
| Cowley | Andrews Sand and Gravel, Inc. | P.O. Box 314, Arkansas City |
| Cowley | Cowley Co. Highway Dept. | Winfield |
| Cowley | McFarland Gravel Co. | 730 N. D. St., Arkansas City |
| Cowley | Myers Materials Inc. | P.O. Box 911, El Dorado |
| Cowley | Oxford Sand and Gravel Co. | P.O. Box 266, Oxford |
| Cowley | Warren R. Phillips | P.O. Box 50, Winfield |
| Cowley | Wilson Bros. | P.O. Box 59, Arkansas City |
| Dickinson | Shoffner Sand and Gravel Co. | 134 E. Jewell St., Salina |
| Douglas | Bowersock Mills Power Co. | 546 Mass. St., Lawrence |
| Edwards | Kinsley Sand and Gravel Co. | Kinsley |
| Edwards | Showalter Sand and Gravel Co. | Garfield |
| Elk | Elk Co. Highway Dept. | Howard |
| Ellis | Lewis C. Schmidtberger | P.O. Box 93, Victoria |
| Ellsworth | Ellsworth Co. Highway Dept. | Ellsworth |
| Ellsworth | Stoppel Construction Co. | Wilson |
| Finney | Sam Alsop Construction Co. | 1207 Pinecrest St., Garden City |
| Finney | Finney Co. Road Dept. | Garden City |
| Ford | Davis and Sons Sales | Dodge City |
| Ford | Dodge City Sand Co. | P.O. Box 430, Dodge City |
| Ford | Miller Sand and Gravel Co. | Dodge City |
| Geary | Junction City Sand and Gravel Co. | Route 3, Junction City |
| Geary | More Sand Co. | 626 W.6th St., Junction City |
| Gove | Boyd Blair Construction Co. | Quinter |
| Gove | Dave Bollinger | Quinter |
| Gove | Gove Co. Highway Dept. | Gove |
| Grant | Grant Co. Highway Dept. | Ulysses |
| Gray | Kerr Sand Co. | Cimarron |
| Gray | San Ore Construction Co., Inc. | McPherson |
| Greeley | Harry Henery Inc. | P.O. Box 15, Ottawa |
| Hamilton | Hamilton Co. Highway Dept. | Syracuse |
| Hamilton | Syracuse Sand and Gravel Co. | 107 N. Elizabeth St., Syracuse |
| Harper | Harper Co. Highway Dept. | Anthony |
| Haskell | Haskell Co. Highway Dept. | Sublette |
| Jackson | George W. Kerford | Atchison |
| Kearny | Kearny Co. Highway Dept. | Lakin |
| Kearny | Popejoy Sand and Gravel Co. | Ulysses |
| Kingman | Ray Wells | Route 1, Kingman |
| Kiowa | Kiowa Co. Highway Dept. | Greensburg |
| Kiowa | Seacot Sand and Excavation Co. | Greensburg |
| Leavenworth | Leavenworth Co. Highway Dept. | Leavenworth |
| Leavenworth | Missouri Valley Sand Inc. | P.O. Box 822, Leavenworth |
| Lyon | Wesley Parks | 648 Oak St., Emporia |
| McPherson | McPherson Co. Road Dept. | McPherson |
| Marshall | Blue River Sand and Gravel Co. | Blue Rapids |
| Marshall | C. V. Garrett | Blue Rapids |
| Marshall | Heinzelman Construction Co. | Marysville |
| Marshall | Marshall Co. Highway Dept. | Marysville |
| Marshall | Hugo P. Vogler | Waterville |
| Meade | Harry Henery Inc. | P.O. Box 15, Ottawa |
| Morris | Virgil Metcalf | Route 3, Dunlap |
| Nemaha | Anderson-Oxandale Co. | P.O. Box 425, Herington |
| Ness | San Ore Construction Co., Inc. | McPherson |
| Norton | Norton Co. Highway Dept. | Norton |
| Osborne | Osborne Co. Highway Dept. | Osborne |
| Pawnee | Johnson Sand and Gravel Co. | P.O. Box 545, Larned |
| Pawnee | Larned Sand and Gravel Co. | P.O. Box 227, Larned |
| Pawnee | Pawnee Co. Highway Dept. | Larned |
| Phillips | Phillips Co. Highway Dept. | Phillipsburg |
| Pottawatomie | Pottawatomie Co. Highway Dept. | Westmoreland |
| Pottawatomie | Wamego Sand Co. | Wamego |
| Pratt | Mrs. C. D. Hogard | 507 S. Mound St., Pratt |
| Pratt | Miller Sand and Gravel Co. | Route 2, Pratt |
| Pratt | Pratt Co. Highway Dept. | Pratt |
| Reno | City Manager | Hutchinson |
| Reno | Fountain Sand Pit | Arlington |
| Reno | Haven Sand Co. | Haven |
| Reno | J. A. Mummey Sand and Gravel | Nickerson |
| Reno | J. H. Shears Sons, Inc. | P.O. Box 277, Hutchinson |
| Reno | J. E. Steele Sand and Gravel Co. | Route 4, Hutchinson |
| Republic | Alsop Sand Co. | Wakefield |
| Rice | Arensman Sand and Gravel Co. | Chase |
| Rice | Sterling Sand and Gravel Co., Inc. | P.O. Box 281, Sterling |
| Rice | Rock Hill Stone and Gravel Co., Inc. | P.O. Box 412, Sterling |
| Rice | A. L. Stapleton | 121 N. Logan St., Lyons |
| Riley | Walters Sand Co., Inc. | P.O. Box 30, Manhattan |
| Russell | Russell Co. Highway Dept. | Russell |
| Russell | San Ore Construction Co., Inc. | McPherson |
| Saline | Shoffner Sand Inc. | 1938 McAllister St., Topeka |
| Saline | Central Kansas Sand Inc. | Mentor |
| Saline | Salina Sand Co., Inc. | Mentor |
| Sedgwick | Bentley Sand Co. | Bentley |
| Sedgwick | Big Three Sand and Gravel Co. | 3920 W. 21st St. N., Wichita 12 |
| Sedgwick | Provence Sand Co. | 6600 W. 13th St., Wichita |
| Sedgwick | Dolese Bros. Co. | 13 N.W. 13th St., Oklahoma City |
| Sedgwick | J and H Sand Co. | 4226 Midland St., Wichita |
| Sedgwick | Walt Keeler Co., Inc. | P.O. Box 1972, Wichita |
| Sedgwick | McKinster and Gore Sand Co. | 537 W. McArthur St., Wichita |
| Sedgwick | Miles Sand Inc. | 3925 W. 53rd St. N., Wichita |
| Sedgwick | Vies Sand and Gravel Co. | 6600 W. 21st St., Wichita |
| Sedgwick | Southwest Sand and Gravel Co. | 4505 S.W. Blvd., Wichita 15 |
| Sedgwick | Superior Sand Co., Inc. | 1717 W. 21st St., Wichita 3 |
| Sedgwick | Wichita Big River Sand Co. | |
| Sedgwick | York Sand Co. | P.O. Box 306, Sedgwick |
| Shawnee | Consumers Sand Co. | 1101 W. Railroad St., Topeka |
| Shawnee | Kansas Sand Co., Inc. | 531 N. Tyler St., Topeka |
| Shawnee | Victory Sand and Gravel Co. | P.O. Box 281, Topeka |
| Shawnee | Topeka Sand Co. | Route 4, Topeka |
| Shawnee | Rivers Sand Co. | P.O. Box 233, Topeka |
| Shawnee | Various producers | |
| Sheridan | Sheridan Co. Highway Dept. | Hoxie |
| Sherman | Forest Seigal | 216 Main St., Goodland |
| Sherman | Sherman Co. Highway Dept. | P.O. Box 22, Goodland |
| Smith | Smith Co. Highway Dept. | Smith Center |
| Stafford | Partin Sand and Gravel Co. | P.O. Box 274, Stafford |
| Stafford | Stafford Co. Highway Dept. | Saint John |
| Sumner | Harry Henery Inc. | P.O. Box 15, Ottawa |
| Sumner | Mulvane Sand Co., Inc. | 503 E. Mulvane st, Mulvane |
| Sumner | Sumner Co. Engineering Dept. | Wellington |
| Thomas | Joe Hubbard | Colby |
| Thomas | Purma Drag Line Co. | 975 2nd St., Colby |
| Thomas | Siebert Sand Co. | P.O. Box 302, Ness City |
| Thomas | Thomas Co. Road Dept. | Colby |
| Trego | Siebert Sand Co. | P.O. Box 302, Ness City |
| Trego | San Ore Construction Co., Inc. | McPherson |
| Trego | Trego Co. Highway Dept. | WaKeeney |
| Wabaunsee | Wabaunsee Co. Highway Dept. | Alma |
| Wallace | Forest Seigal | 216 Main St., Goodland |
| Wallace | Wallace Co. Highway Dept. | Sharon Springs |
| Washington | Finlayson Gravel | Barnes |
| Washington | Mueller Sand and Gravel Co. | Hanover |
| Wilson | Wilson Co. Highway Dept. | Fredonia |
| Wyandotte | American Sand and Gravel Co. | 5731 Kansas Ave., Kansas City |
| Wyandotte | Builders Sand Co. | P.O. Box 659, Argentine Sta., Kansas City |
| Wyandotte | Holliday Sand and Gravel Co. | 2 W. 40th St., Kansas City 11, Mo. |
| Wyandotte | Superior Sand and Gravel Co. | P.O. Box 106, Edwardsville |
| Wyandotte | Peck-Woolf Sand Matl. Co. | 1920 Paseo Blvd., Kansas City 8, Mo. |
| Wyandotte | Stewart Sand and Matl. Co. | 4049 Penn. Ave., Kansas City 8, Mo. |
| State | State Highway Commission | Topeka |
| State | D. G. Hansen | Logan |
Stone production in Kansas in 1960 amounted to 12,037,346 tons, valued at $15,412,298, a decrease of 13.9 percent in quantity and of 9.7 percent in value from 1959 (Table 29). Stone produced was limestone. sandstone, and miscellaneous stone or chat.
Table 29—Production and value of stone in Kansas, by kind of rock and use, 1959 and 1960
| 1959 | 1960 | ||||
|---|---|---|---|---|---|
| Tons | Value | Tons | Value | ||
| Limestone | |||||
| Concrete aggregate and road metal |
9,250,215 | $11,847,532 | 7,842,489 | $10,618,051 | |
| Cement | 2,810,559 | 2,719,245 | 2,175,547 | 2,298,375 | |
| Riprap | 379,990 | 340,375 | 536,690 | 459,530 | |
| Dimension stone | 39,004 | 502,863 | 12,998 | 136,682 | |
| Agricultural | 352,759 | 545,766 | 385,704 | 567,309 | |
| Railroad ballast | 33,746 | 34,892 | 12,757 | 13,257 | |
| Other | 489,911 | 856,712 | 466,905 | 761,129 | |
| Total limestone | 13,356,184 | $16,847,385 | 11,433,090 | $14,854,333 | |
| Percent change from 1959 | -14.4 | -11.8 | |||
| Total all sandstone** | * | * | 237,392 | $ 438,820 | |
| Miscellaneous | |||||
| Railroad ballast | 456,104 | $ 158,506 | 342,616 | $ 115,567 | |
| Concrete aggregate and road metal |
175,664 | 66,615 | 24,248 | 3,578 | |
| Total miscellaneous | 631,768 | $ 225,121 | 366,864 | $ 119,145 | |
| Percent change from 1959 | -42.0 | -47.1 | |||
| Total stone | 13,987,952 | $17,072,506 | 12,037,346 | $15,412,298 | |
| * Included under "Undistributed" in Table 1. ** Quantity and value for individual uses may not be disclosed. |
|||||
Most of the stone produced was limestone, 94.9 percent or 11,433,090 tons valued at $14,854,333. Kansas limestone was used mainly as concrete aggregate and road metal (7,842,489 tons). In value, limestone used as aggregate and road metal ranks first ($10,618,051), followed by cement rock ($2,298,375), agricultural limestone ($567,309), and riprap material ($459,530).
Sandstone was produced chiefly in Lincoln County; smaller amounts were quarried in Bourbon, Jackson, Jewell, Lincoln, Neosho, and Phillips Counties. Kansas sandstone was used for various purposes—concrete aggregate and road metal, railroad ballast, filter sand, dimension stone, and riprap. Total quantity of sandstone produced in Kansas in 1960 was 237,392 tons or 2 percent of all stone production in the state. Sandstone was valued at $438,820 or 2.8 percent of the total stone value. Because of insufficient number of sandstone producers, data on quantity produced for the various purposes may not be disclosed. Sandstone used as dimension stone is discussed on page 89.
Miscellaneous stone, in Kansas consisting solely of chat, accounted for 3.1 percent of the total stone production. Chat is the waste material associated with the mining of lead and zinc in the Tri-State Lead and Zinc District, which extends into southern Cherokee County. Most of it accumulated during past years and is now being sold mainly as concrete aggregate and road metal. Tonnage sold in 1960 was 42 percent less than in 1959 and in value 47.1 percent less. Chat is included under "miscellaneous" stone in Table 29, a summary of Kansas stone production and value, by kind of rock and use, for 1959 and 1960.
The stone reserves of Kansas are extremely large and for practical purposes may be regarded as inexhaustible.
Stone was produced in Kansas in 1960 by at least 40 commercial limestone companies operating 96 quarries in 40 counties and by 15 noncommercial limestone operators, principally county highway departments, producing stone at 24 sites in 16 counties. Sandstone operators number 6, of which 4 are commercial companies producing stone in 4 counties and 2 are noncommercial operators obtaining sandstone in 2 counties. Miscellaneous stone or chat was sold by 4 companies, all in Cherokee County. Greatest activity in the stone industry centered in Wyandotte, Dickinson, Allen, Elk, Shawnee, and Jewell Counties, Wyandotte County producing more than 50 percent of the stone. Total stone produced in the 6 leading counties amounted to 4,031,932 tons valued at $5,196,141, representing 33,4 percent of all stone produced and 34 percent of the total value.
The Silverdale Cut Stone Company of Arkansas City, Cowley County, is replacing with a $200,000 plant the facilities destroyed by fire.
A directory of stone producers operating in Kansas in 1960 is given in Table 30.
Table 30—Directory of stone producers on record as of December 31, 1960
| County | Company or operator | Address |
|---|---|---|
| Allen | Lehigh Portland Cement Co. | 718 Hamilton St., Young Bldg., Allentown, Pa. |
| Allen | Monarch Cement Co. | Humboldt |
| Allen | Nelson Bros. Quarries | La Harpe |
| Anderson | Hunt Rock Co. | Garnett |
| Anderson | Murray Limestone Products Co. | Centerville |
| Atchison | Ralph Bromley & Sons Quarries | 1100 Julia St., Atchison |
| Atchison | Geo. W. Kerford Quarry Co. | Atchison |
| Atchison | U.S. Corps of Engineers | 1800 Federal Office Bldg., Kansas City 6, Mo. |
| Bourbon | Bandera Stone Quarry | Redfield |
| Bourbon | Bourbon Co. Highway Dept. | Fort Scott |
| Bourbon | Cullor Limestone Co., Inc. | Route 5, Fort Scott |
| Bourbon | Fort Scott Hydraulic Cement Co. | P.O. Box 267, Fort Scott |
| Butler | Carr Rock Products Co. | 315 N 8th St., Neodesha |
| Butler | Myers Materials, Inc. | P.O. Box 911, El Dorado |
| Chautauqua | Sedan Limestone Co. | Sedan |
| Cherokee | Baxter Chat Co. | Baxter Springs |
| Cherokee | Eagle-Picher | Miami, Oklahoma |
| Cherokee | Southwest Chat, Inc. | Baxter Springs |
| Cherokee | John J. Stark | P.O. Box 7, Girard |
| Cherokee | Lee R. Thomas | Baxter Springs |
| Franklin | Dan Fogle | Ottawa |
| Geary | Grosshans-Peterson, Inc. | Marysville |
| Geary | Walker Cut Stone Co. | P.O. Box 269, Junction City |
| Greenwood | Greenwood Co. Highway Dept. | Eureka |
| Greenwood | Myers Materials, Inc. | P.O. Box 911, El Dorado |
| Greenwood | Sedan Limestone Co. | Sedan |
| Jackson | Anderson-Oxandale | P.O. Box 425, Herington |
| Jackson | Jackson Co. Highway Dept. | Holton |
| Jackson | Reno Construction Co. | P.O. Box 61, Overland Park |
| Jefferson | Ray Baker | Valley Falls |
| Jefferson | N. R. Hamm Quarry, Inc. | Perry |
| Jewell | Ideal Cement Co. | 620 Denver National Bldg., Denver 2, Colo. |
| Jewell | Jewell Co. Engineer | Mankato |
| Johnson* | Deitz Hill Development Co. | 28 SW Blvd., Kansas City 10, Mo. |
| Johnson* | Reno Construction Co. | P.O. Box 61, Overland Park |
| Labette | Labette Co. Highway Dept. | Oswego |
| Labette | John J. Stark | P.O. Box 7, Girard |
| Clay | Riddle Quarries, Inc. | National Bank of America Bldg., Salina |
| Coffey | J ones Rock Co. | P.O. Box 128, Emporia |
| Coffey | Neosho Valley Rock Co. | Burlington |
| Cowley | John V. Elam | Winfield |
| Cowley | C. L. Daniels Stone Co. | P.O. Box 134, Winfield |
| Cowley | Silverdale Cut Stone Co. | Silverdale |
| Cowley | Silverdale Limestone Co. | Route 3, Box 180, Arkansas City |
| Crawford | John J. Stark | P.O. Box 7, Girard |
| Dickinson | Anderson-Oxandale | P.O. Box 425, Herington |
| Dickinson | Riddle Quarries, Inc. | National Bank of America Bldg., Salina |
| Doniphan | Doniphan Co. Engineer | Troy |
| Doniphan | Everett Quarries, Inc. | Plattsburg, Mo. |
| Doniphan | Geo. W. Kerford ce., Inc. | Atchison |
| Doniphan | U. S. Corps of Engineers | 1800 Federal Office Bldg., Kansas City 6, Mo. |
| Doniphan | Wolf River Limestone, Inc. | Troy |
| Douglas | Clark Rock Quarry | Baldwin |
| Elk | Concrete Materials Division, American-Marietta Co. |
Moline |
| Ellis | Ellis Co. Highway Dept. | Hays |
| Leavenworth | J. C. Haigwood | Tonganoxie |
| Leavenworth | Kansas State Penitentiary | Lansing |
| Leavenworth | Loring Quarries, Inc. | P.O. Box 174, Bonner Springs |
| Leavenworth | U.S. Corps of Engineers | 1800 Federal Office Bldg., Kansas City 6, Mo. |
| Lincoln | Lincoln Co. Highway Dept. | Lincoln |
| Lincoln | Quartzite Stone Co. | Lincoln |
| Linn* | Lee Giles Rock Co. | Greeley |
| Lyon* | J ones Rock Co. | P.O. Box 128, Emporia |
| Lyon* | Murray Limestone Products | Centerville |
| Marion | Walt Keeler Co., Inc. | P.O. Box 1972, Wichita 1 |
| Marion | Riddle Quarries, Inc. | National Bank of America Bldg., Salina |
| Marshall* | Anderson-Oxandale | P.O. Box 425, Herington |
| Marshall* | R. Hopper Bros. Quarry | Pawnee, Nebr. |
| Marshall* | Marshall Co. Engineer | Marysville |
| Miami | A. J. Forster | Paola |
| Miami | L. W. Hayes, Inc. | 4550 Main St., Kansas City 2, Mo. |
| Miami | Miami Co. Highway Dept. | Paola |
| Montgomery | Hand S Rock Co. | Route 1, Elk City |
| Montgomery | Universal Atlas Cement Co. | 100 Park Ave., New York 17, N.Y. |
| Morris | Anderson-Oxandale | P.O. Box 425, Herington |
| Neosho* | Ash Grove Lime-Portland Cement Co. | 101 W. 11th St., Kansas City, Mo. |
| Neosho* | Harry Byers and Sons, Inc. | 500 N. Plummer St., Chanute |
| Neosho* | Neosho Co. Highway Dept. | Erie |
| Neosho* | Joe O'Brian Rock Crusher | St. Paul |
| Osborne* | ||
| Phillips | Bushman Construction Co. | 301 Schneider Bldg., St. Joseph, Mo. |
| Pottawatomie | Anderson-Oxandale | P.O. Box 425, Herington |
| Pottawatomie | Bayer Stone Inc. | Route 1, Manhattan |
| Rice | Riddle Quarries, Inc. | National Bank of America Bldg., Salina |
| Riley | Anderson-Oxandale | P.O. Box 425, Herington |
| Riley | Bayer Construction Co. | 509 Yuma St., Manhattan |
| Riley | Fort Riley Military Reservation | Fort Riley |
| Shawnee | Geo. W. Kerford Co., Inc. | Atchison |
| Shawnee | Henry C. Luttjohann | 2001 James St., Topeka |
| Shawnee | Netherland Stone Co. | Route 2, Topeka |
| Wabaunsee | G. W. Baker | Holton |
| Wilson | Benedict Rock and Lime Co. | Benedict |
| Wilson | Carr Rock Products Co. | 315 N. 8th St., Neodesha |
| Wilson | General Portland Cement Co. | 111 West Monroe St., Chicago 3, IlL |
| Wyandotte | American Rock Crusher | 3700 Rainbow Blvd., Rosedale |
| Wyandotte | Lone Star Cement Corp. | 1650 Home Savings Bldg., Kansas City 6, Mo. |
| Wyandotte | Peerless Quarries, Inc. | Turner |
| Wyandotte | Thompson-Strauss Quarries, Inc. | 700 Holliday Drive, Kansas City |
| Various | Concrete Materials & Construction Co. | Moline |
| * Various producers. | ||
For the first time in many years, lime will be produced in Kansas at a plant in Leavenworth County about 4 miles west of Bonner Springs. Construction of the vertical kiln lime plant was completed during 1960, but no commercial lime was produced during the year. The Midwest Lime Company, formerly Mid-Continent Quarries, will produce lime from rock quarried by Loring Quarries, Inc. Initial capacity is estimated at 100 tons a day by Mr. Robert O. Stanley, the company president.
Lead and zinc, the only metals mined in Kansas, were produced in Cherokee County by five mining companies (Table 31). In 1960 the value of metals produced was $728,940, or $384,400 more than in 1959, an increase of 111.2 percent. The metals contributed 0.14 percent of the value of all minerals produced in the state (Table 4, Fig. 3).
Table 31—Quantity and value of lead and zinc produced in Kansas, 1959 and 1960
| Year | Lead (recoverable metal) | Zinc (recoverable metal) | ||
|---|---|---|---|---|
| Tons | Value | Tons | Value | |
| 1959 | 481 | $110,630 | 1,017 | $233,910 |
| 1960 | 781 | 182,754 | 2,117 | 546,186 |
| Percent change | +62.4 | +65.2 | +108.2 | +133.5 |
Recoverable lead production in 1960 amounted to 781 tons valued at $182,754, increases of 62.4 percent in tonnage and 65.2 percent in value from 1959. Lead was produced at four mines by four companies.
The Eagle-Picher Mining and Smelting Company manufactured pigments and sulfuric acid at its lead-smelting plant at Galena. Lead pigments were made by the Ozark Smelting and Mining Company at its Coffeyville plant.
Data on lead production in Kansas in 1959 and 1960 are presented in Table 31. Table 32 is a directory of lead producers in Kansas on record as of December 31, 1960.
Zinc production in 1960 gained even more significantly than lead. Recoverable zinc production was 2,117 tons, twice the 1959 production of 1,017 tons. Value of the 1960 zinc production was $546,186, or $312,276 more than in 1959, a gain of 133.5 percent. In addition to the four companies producing lead, all of which also produced zinc, the M and B Mining Company of Picher, Oklahoma, produced zinc only.
The Cherryvale Zinc Company operates a smelting plant at Cherryvale, Montgomery County.
Data on zinc production in Kansas in 1959 and 1960 are given in Table 31, and a directory of zinc producers on record as of December 31, 1960, is presented in Table 32.
Table 32—Directory of lead and zinc producers in Kansas on record as of December 31, 1960
| Company | Address | Mine* |
|---|---|---|
| Ora Black | Cardin, Oklahoma | Lindsey |
| The Eagle-Picher Mining and Smelting Co. | Miami, Oklahoma | Bird Dog |
| Henderson-T Mining Co. | Picher, Oklahoma | Blue Mound |
| M and B Mining Co.** | Picher, Oklahoma | EW # 24 (Lindsey) |
| Red Lead and Zinc Co. | Baxter Springs | Robinson |
| * All lead and zinc mines are in Cherokee County. ** Zinc production only. |
||
Although no uranium is mined in Kansas, Thor-Westcliffe Development, Inc., of Santa Fe, New Mexico, applied to the Atomic Energy Commission for a permit to build a pilot plant at Pittsburg, Crawford County. The company's products may be used by a plant of Spencer Chemical Company situated a short distance south of Pittsburg but in Cherokee County.
Kansas produced several minerals that are classified as "undistributed". Undistributed mineral commodities are those whose total quantity and value cannot be revealed, because they are produced almost exclusively by one company. Such minerals in 1960 include diatomaceous marl, gypsum, natural cement, salt brine, volcanic ash or pumicite, and dimension sandstone. In addition, expanded perlite and expanded vermiculite were processed from material shipped into Kansas from outside sources. The total value of undistributed minerals in Kansas in 1960 amounted to $1,132,892.
Natural cement production and shipments in Kansas declined drastically in 1960; shipments decreased 97.8 percent and value 97.1 percent. Natural cement is produced solely by the Fort Scott Hydraulic Cement Company of Fort Scott in Bourbon County, one or eight natural cement companies operating in the United States.
The source rock for the natural cement is the "cement" rock, or Blackjack Creek Limestone, the basal member of the Fort Scott Limestone, Marmaton Group. Reserves of natural cement rock are essentially unlimited.
The value of 1960 shipments of natural cement is included in the value listed under "Undistributed" in Table 1.
Diatomaceous marl is produced in Wallace County by the NationaJ Lead Company, Delore Division, 2800 Carondulet Station, St. Louis, Missouri. The marl is processed and shipped from the company's plant at Edson, Sherman County, about 17 miles north of the mine, for use chiefly in the manufacture of whiting substitute and as paint filler. Production in 1960 was about 2 percent greater than in 1959 and value approximately 25 percent greater. Value of the diatomaceous marl is included in the total listed under "Undistributed" in Table 1.
Known reserves of diatomaceous marl are estimated to exceed 1 million tons.
Production of crude and calcined gypsum in 1960 declined 25.7 and 29.1 percent respectively. Value of crude gypsum was 27.4 percent less than in the previous year but value of calcined gypsum was 32.1 percent greater. The value of crude gypsum is included under the value assigned to the "Undistributed" minerals (Table 1).
Gypsum is produced in Barber and Marshall Counties. Producers on record at the end of 1960 are listed in Table 33. Bestwall Gypsum Company is relocating its mine and plant a short distance north of the present site; building of Tuttle Creek Reservoir eventually will make the present plant and mine inaccessible.
Table 33—Directory of Kansas producers of gypsum in 1960
| County | Company | Plant location |
|---|---|---|
| Barber | National Gypsum 325 Delaware Ave., Buffalo, New York |
Medicine Lodge |
| Marshall | Bestwall Gypsum 120 E. Lancaster St., Ardmore, Pennsylvania |
Blue Rapids |
Expanded perlite is processed by Panacalite Perlite, Inc., 70'7 Funston Road, Kansas City 15, Kansas (Wyandotte County), from material shipped from New Mexico and Nevada. Perlite processed in 1960 was 2 percent less in quantity but 3.4 percent more in value than in 1959. Most of the expanded perlite was used for building plaster, but some was used as concrete aggregate and as soil conditioner, filter aid, and sand finish, and some was used in foundries.
Expanded vermiculite is processed by Dodson Manufacturing Company, 1643 Barwise Street, Wichita (Sedgwick County), from material imported from Libby, Montana. The quantity sold in 1960 was 3.4 percent less than in 1959 and the value was 43.4 percent less. Expanded vermiculite is used for insulation, plastering, and roof decks.
A company known as the Goldlite Corporation was formed to strip mine vermiculite at Silver City in Woodson County, but no production has been reported yet.
Values of expanded perlite and vermiculite for 1960 are included in the total listed under "Undistributed" in Table 1.
Pumicite or volcanic ash in 1960 continued the decline in production and value begun in 1954. Production in 1960 was 26.1 percent less than in 1959 and value was 38.7 percent less. Only two producers operated in 1960.
Volcanic ash is extensively distributed over the western one-half of Kansas, being known to crop out in at least 160 localities distributed in 39 counties, but is produced only in Lincoln and Norton Counties.
Kansas volcanic ash has been used as an abrasive, especially ill scouring compounds and soaps; as an ingredient of ceramic glazes and ceramic bodies; as an additive to cement; as a raw material for manufacture of several types of lightweight aggregate, cellular blocks, and glass; as a sweeping compound; as a dressing for bituminous-matt roads; and as an inert filler (Carey and others, 1952, p. 3).
Most recent estimate of Kansas usable volcanic ash reserves is that for 1952 (Carey and others, 1952, p. 40), in which they are listed as 20 million tons.
Producers on record for 1960 are listed in Table 34.
Table 34—Directory of Kansas producers of volcanic ash or pumicite in 1960
| County | Company address | Pit location (nearest town) |
|---|---|---|
| Lincoln | Ernest Hauzlicek, Wilson | Wilson |
| Norton | Wyandotte Chemical Corporation, 1609 Biddle Avenue, Wyandotte, Michigan |
Calvert |
The Frontier Chemical Company of Kansas, Inc., Wichita, a division of Vulcan Materials Company, Birmingham, Alabama, produces salt from brine wells located south of Wichita, Sedgwick County, and uses it in the manufacture of industrial chemicals. In 1960, production increased by 24.7 percent and value by 12.7 percent. Value of the salt produced is included in the total listed under "Salt" in Table 1.
The Bandera Stone Quarry at Redfield in Bourbon County is the only producer of dimension sandstone in the state. Production in 1960 was 8.6 percent less and value 22.6 percent less than in 1959. The Bandera sandstone is used for building stone, including rough construction stone, sawed stone, and flagging stone. Quantity and value of dimension sandstone produced in 1960 are included in the totals listed under "Stone" in Table 1. The office address of the Bandera Stone Quarry Company is 222 West 72nd Street, Kansas City, Missouri.
Water and soil are truly mineral commodities. Because of their nature and universal usage, however, they are difficult to evaluate. No data have been published concerning the actual quantity of soil in Kansas nor are data complete as to the amount of water available and the quantity used or consumed annually in the state. Future studies will undoubtedly add much needed information.
In addition to the minerals produced, there are other mineral commodities in Kansas that either have never been exploited or are not at present being produced on a commercial scale. Such minerals include aluminum from clays (Kinney, 1943, 1952), bentonite (Kinney, 1942; Ives and Hill, 1960), chalk (Runnels and Dubins, 1949), of which the state has virtually unlimited supplies, iron (Jewett and Schoewe, 1942, p. 103), limestone for the manufacture of lime (Ives and Runnels, 1960), magnesium (Schoewe, 1943; Jeffords, 1948), mineral water (Schoewe, 1953, p. 133), oil shale (Runnels and others, 1952), phosphate nodules (Runnels, 1949; Runnels and others, 1953), pyrite (Jewett and Schoewe, 1942, p. 168), rock asphalt (Jewett, 1940), and tripoli (Jewett and Schoewe, 1942, p. 168). Still other minerals are known to occur in Kansas, such as germanium (Schleicher and Hambleton, 1954; Schleicher, 1959), and uranium (Runnels, Schleicher, and Van Nortwick, 1953), but these have not been investigated sufficiently to show whether they exist in commercial quantities. Further study of these un exploited minerals in Kansas coupled with favorable economic conditions may eventually result in the production of some, if not all, of these mineral commodities.
Carey, J. S., Frye, J. C., Plummer, Norman, and Swineford, Ada, 1952, Kansas volcanic ash resources: Kansas Geol. Survey, Bull. 96, pt. 1, p. 1-68, fig. 1-4, pl. 1-7. [available online]
Goebel, E. D., Hilpman, P. L., Beene, D. L., and Noever, R J., 1960, Oil and gas developments in Kansas during 1959: Kansas Geol. Survey, Bull. 147, p. 1-254, fig. 1-12, pl. 1-3.
Goebel, E. D., Hilpman, P. L., Beene, D. L., and Noever, R J., 1961, Oil and gas developments in Kansas during 1960: Kansas Geol. Survey, Bull. 155, p. 1-229, fig. 1-7, pl. 1.
Ives, W., and Runnels, R T., 1960, Lime raw materials in the Kansas City area: Kansas Geol. Survey, Bull. 142, pt. 3, p. 123-148, fig. 1-2, pl. 1. [available online]
Ives, W., and Hill, W. E., 1960, Occurrence and bleaching properties of some Kansas montmorillonite clays: Kansas Geol. Survey, Bull. 142, pt. 4, p. 149-188, fig. 1-4. [available online]
Jeffords, R. M., 1948, Graphic representation of oil-field brines in Kansas: Kansas Geol. Survey, Bull. 76, pt. 1, p. 1-12, fig. 1-6. [available online]
Jewett, J. M., 1940, Asphalt rock in eastern Kansas: Kansas Geol. Survey, Bull. 29, p. 1-23, fig. 1-3, pl. 1-2. [available online]
Jewett, J. M., and Schoewe, W. H., 1942, Kansas mineral resources for wartime industries: Kansas Geol. Survey, Bull. 41, pt. 3, p. 69-108, fig. 1-13. [available online]
Kinney, E. D., 1942, Kansas bentonite, its properties and utilization: Kansas Geol. Survey Bull. 41, pt. 9, p. 349-367, fig. 1, pl. 1-2. [available online]
Kinney, E. D., 1943, A process for extracting alumina from Kansas clay: Kansas Geol. Survey, Bull. 47, pt. 4, p. 113-136. [available online]
Kinney, E. D., 1952, Amenability of certain Kansas clays to alumina extraction by the lime-sinter process: Kansas Geol. Survey, Bull. 96, pt. 7, p. 301-328, fig. 1-3. [available online]
Runnels, R T., 1949, Preliminary report on phosphate-bearing shales in eastern Kansas: Kansas Geol. Survey, Bull. 82, pt. 2, p. 37-48, pl. 1-2. [available online]
Runnels, R T., and Dubins, I. M., 1949, Chemical and petrographic studies of the Fort Hays Chalk in Kansas: Kansas Geol. Survey, Bull. 82, pt. 1, p. 1-36, fig. 1-6, pl. 1. [available online]
Runnels, R T., Kulstad, R O., McDuffee, C., and Schleicher, J. A., 1952, Oil shale in Kansas: Kansas Geol. Survey, Bull. 96, pt. 3, p. 157-183, fig. 1-2, pl. 1-3. [available online]
Runnels, R T., Schleicher, J. A., and Van Nortwick, H. S., 1953, Composition of some uranium-bearing phosphate nodules from Kansas shale: Kansas Geol. Survey, Bull. 102, pt. 3, p. 93-104, fig. 1-3. [available online]
Schleicher, J. A., 1959, Germanium in Kansas coals: Kansas Geol. Survey, Bull. 134, pt. 4, p. 161-179, fig. 1-2. [available online]
Schleicher, J. A., and Hambleton, W. W., 1954, Preliminary spectrographic investigation of germanium in Kansas coal: Kansas Geol. Survey, Bull. 109, pt. 8, p. 113-124, fig. 1-2. [available online]
Schoewe, W. H., 1943, Kansas oil field brines and their magnesium content: Kansas Geol. Survey, Bull. 47, pt. 2, p. 37-76, fig. 1-3. [available online]
Schoewe, W. H., 1953, The geography of Kansas, pt. 3, hydrogeography: Kansas Acad. Sci. Trans., v. 56, no. 2, p. 131-190, fig. 71-84.
Schoewe, W. H., 1960, The mineral industry in Kansas in 1959: Kansas Geol. Survey, Bull. 142, pt. 6, p. 235-289, fig. 1-8. [available online]
Kansas Geological Survey
Placed on web Dec. 13, 2018; originally published Dec. 30, 1961.
Comments to webadmin@kgs.ku.edu
The URL for this page is http://www.kgs.ku.edu/Publications/Bulletins/152_3/index.html