![]()
Prev Page--Chemical Properties || Next Page--Ceramic Properties
Petrographic and Mineralogical Properties
Particle Size Data
A mechanical analysis of each sample was made by pipette method, using NH4OH as a dispersing agent. Pipette samples were taken at single phi intervals from 4 to 11 phi. The results are shown in Table 8. For purposes of analysis, size fractions finer than 2 microns and from 2- to 8-microns were obtained by sedimentation and repeated decantation at time intervals and depths determined by Stokes' law. The accuracy obtained was somewhat less than that of the mechanical analyses themselves. Particle size distributions finer than 11 phi (0.5 micron) were estimated by measurements of particles in electron micrographs. Cumulative size frequency curves derived from pipette analyses and measurements on electron micrographs are shown in Figure 1. It was necessary to treat clay O-5-6 with H2O2 to prevent flocculation so the results may not be strictly comparable with those from the other three clays.
Table 8--Particle size distribution, percent by weight, by pipette analysis.
| Phi | Microns | EL-60-6 | EL-69-2 | O-5-6 | O-38-4 |
|---|---|---|---|---|---|
| <4 | >62 | 13.8 | 4.8 | 0.4 | |
| 4-4.5 | 62-44 | 6.1 | 2.6 | 1.9 | |
| 4.5-5 | 44-31.2 | 7.1 | 3.2 | 1.9 | |
| 5-6 | 31.2-15.6 | 11.7 | 7.0 | 4.8 | 4.3 |
| 6-7 | 15.6-7.8 | 10.1 | 10.4 | 6.1 | 6.5 |
| 7-8 | 7.8-3.9 | 8.7 | 11.4 | 10.2 | 13.7 |
| 8-9 | 3.9-1.95 | 7.9 | 11.2 | 12.3 | 15.1 |
| 9-10 | 1.95-1 | 7.2 | 8.7 | 10.2 | 11.0 |
| 10-11 | 1-0.5 | 6.5 | 8.7 | 13.7 | 9.4 |
| >11 | <0.5 | 20.9 | 32.1 | 38.5 | 40.0 |
| Md1 | 7.13 | 8.93 | 10.20 | 9.95 | |
| PD1 | 4.45 | 4.25 | 3.95 | 3.60 | |
| 1From cumulative curves (Fig. 1). | |||||
Fig. 1--Cumulative particle size distributions of the four clays. Solid lines from pipette data; dashed lines from electron micrograph measurements.
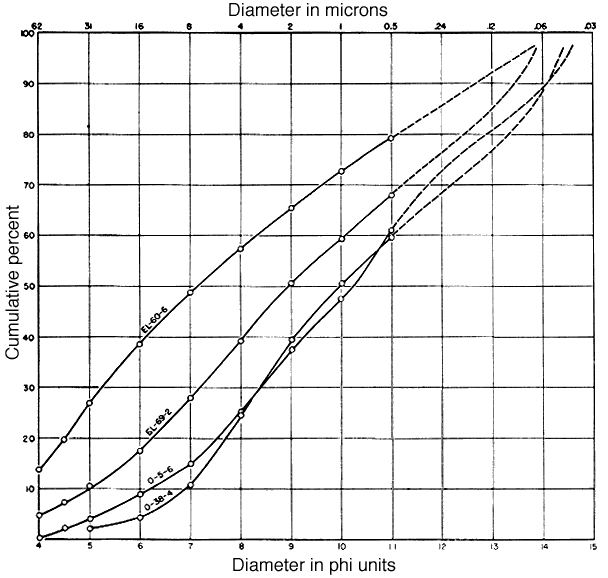
Clay EL-60-6 is coarsest and most poorly sorted of the four clays. The sorting, recorded as the phi percentile deviation, is 4.45. The distribution shows a single mode in the coarse silt to very fine sand region, and the remainder of the sample is rather evenly distributed throughout the curve. The median diameter is 7.13 phi (7.1 microns).
Clay EL-69-2 is somewhat finer grained and shows a principal mode at about 7 phi (8 microns). The median diameter is 8.93 phi (about 2 microns).
According to the pipette data, clay O-5-6 is the finest grained of the four clays (median diameter 10.2 phi, or 0.85 microns) and its distribution seems to be bimodal: one mode is at about 8.5 phi (2.8 microns), and another at nearly 11 phi (0.5 micron). The curve from the electron micrograph data suggests a third mode at 14 phi (0.06 micron) but this value may not be reliable.
Clay O-38-4 is nearly as fine grained as clay O-5-6 (median diameter 9.95 phi, about 1 micron) but the curve is less complex. The principal mode is at about 8 phi (4 microns). Electron micrograph data suggest another mode at 13.5 phi (0.09 micron). The sorting is better than that of the other clays (phi percentile deviation, 3.60).
Specific Surface
The specific surface of the four clays was calculated in order to determine the relationship between particle size and shape and the green properties of the clays such as drying shrinkage, water of plasticity, and shrinkage water. Inasmuch as the somewhat elusive property of clays termed "plasticity" is largely determined by the amount and manner in which water is held within the clay material, it is assumed that the specific surface of a clay is a reliable quantitative index of its plasticity.
The specific surface was obtained from the following formula:
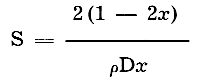
where S = specific surface (square meters per gram of sample)
D = mean diameter (microns)
x = ratio of thickness to length
ρ = density of sample (2.62 grams per cc)
The procedure for the determination of specific surface was modified slightly from that used by Johnson and Lawrence (1942) and by Whittaker (1939).
The mean diameter was determined from the particle size analyses described elsewhere in this report. The ratio of thickness to length was determined by measuring a large number of particles on electron micrographs. Separate determinations were made on kaolinite, illite (montmorillonite and mixed-layer clay minerals were not distinguished from illite), and quartz, on the assumption that the kaolinite flakes all show 120° angles. Estimated percentages of each of these mineral constituents were used in calculating a weighted average. The thickness to length ratio (x) was determined separately on the minus 2-micron fraction and the 2- to 8-micron fraction. Electron micrographs were not available for the plus 8-micron fraction, but the ratio (x) for the quartz in the 2- to 8-micron fraction was applied to the plus 8-micron fraction. The percentage of each of these fractions was also used in calculating weighted averages.
The specific surface values obtained are listed in Table 9.
Table 9--Specific surface (S) for the four clays investigated.
| Sample no. | Specific surface, square meters per gram |
|---|---|
| EL-60-6 | 3.07 |
| EL-69-2 | 7.24 |
| O-5-6 | 11.74 |
| O-38-4 | 8.19 |
Thin Sections
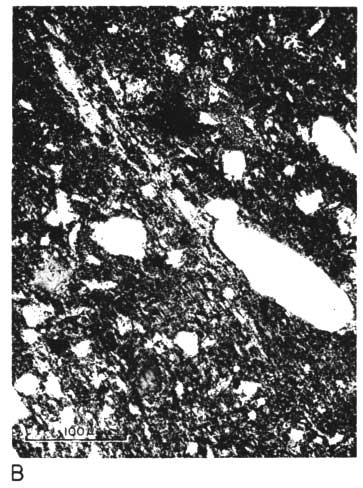
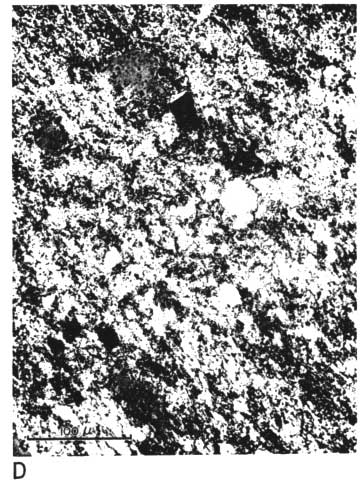
Photomicrographs of thin sections from the four clays are shown in Plates 1 and 2.
The thin section from clay EL-60-6 contains scattered quartz grains (some as large as 150 microns in long diameter) in a matrix of pale brownish clay having low birefringence (Pl. 1A, 1B). Some elongate areas of the clay show good preferred orientation,' and their birefringence seems to be slightly greater than that of pure kaolinite. Large curved "books" of kaolinite are scattered throughout the thin section; the largest of these is about 90 microns long and 40 microns wide in the plane of the thin section. A few small grains of zircon and tourmaline are present. No feldspar is observed, but some small areas of clay having uniformly low birefringence may possibly be feldspar grains that have completely altered to kaolinite.
Plate 1A--Photomicrograph of thin section, x 260. Clay EL-60-6, plane polarized light.
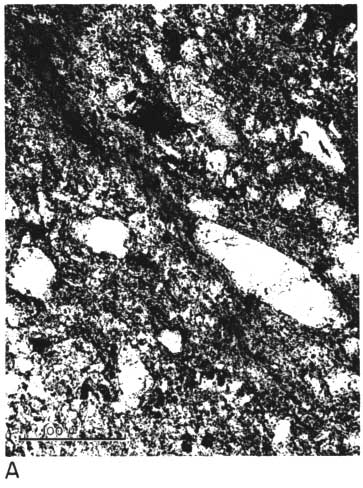
Plate 1B--Photomicrograph of thin section, x 260. Clay EL-60-6, crossed nicols. Note slightly birefringent area of clay near upper left-hand corner.
The thin section from clay EL-69-2 also has many large quartz grains in a clay matrix. The clay contains many fine, highly birefringent shreds (presumably illite), oriented in all directions and scattered throughout the less birefringent kaolinite. No kaolinite books are visible, and there are a few small spots of dark-browm organic matter (Pl. 1C, 1D).
Plate 1C--Photomicrograph of thin section, x 260. Clay EL-69-2, plane polarized light. Note shred-like character of matrix.
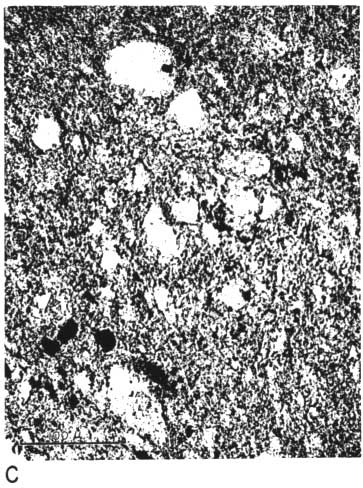
Plate 1D--Photomicrograph of thin section, x 260. Clay EL-69-2, crossed nicols.
Clay O-5-6 contains much more organic matter than the other three clays (Pl. 2A, 2B). The quartz grains are smaller and less abundant than those of clays EL-60-6 and EL-69-2. The clay matrix has more highly birefringent areas than that of clay EL-60-6, but they cannot be resolved so easily into distinct flakes or shreds as can those of clay EL-69-2. These may be the mixed-layer mineral and montmorillonite detected by x-ray diffraction. The clay shows excellent local preferred orientation, but its direction varies throughout the slide and extinction in any one small area is undulatory.
Plate 2A--Photomicrograph of thin section, x 260. Clay O-5-6, plane polarized light. Note quantities of dark organic matter.
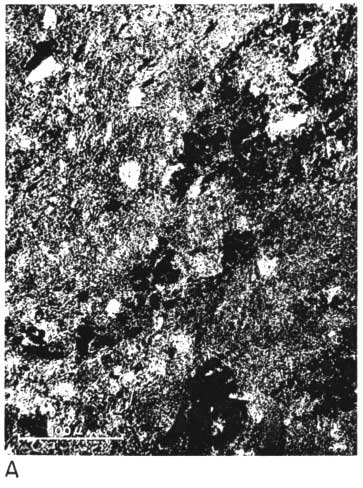
Plate 2B--Photomicrograph of thin section, x 260. Clay O-5-6, crossed nicols.
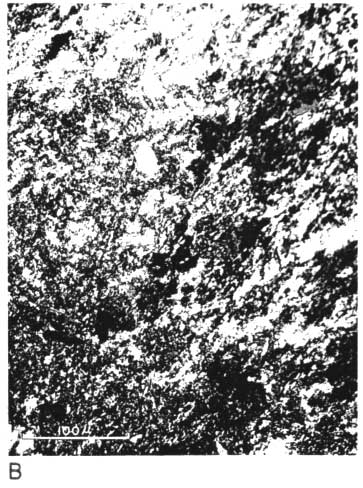
Clay O-38-4 contains fewer and smaller quartz grains than the other three clays. The matrix seems nearly uniform or homogeneous throughout the thin section, and many small highly birefringent shreds are observed under high magnification (Pl. 2C, 2D).
Plate 2C--Photomicrograph of thin section, x 260. Clay O-38-4, plane polarized light.
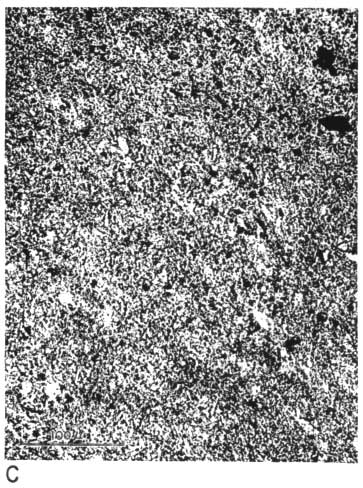
Plate 2D--Photomicrograph of thin section, x 260. Clay O-38-4, crossed nicols.
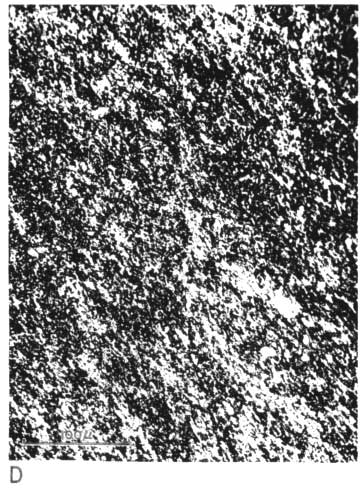
Orientation of the shreds seems fairly good in two directions. A small quantity of organic matter is present as scattered dark-brown spots.
Electron Microscopy
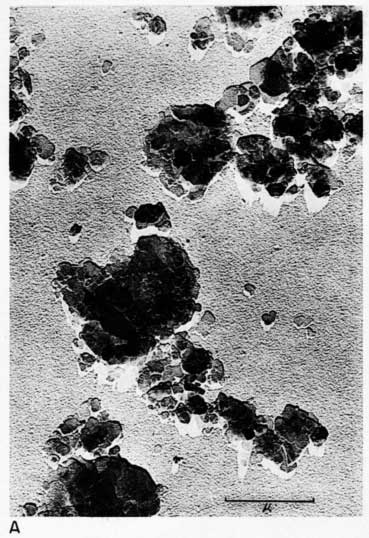
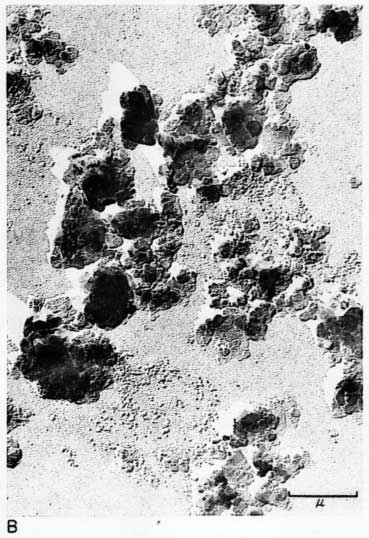
Early examination of the clays was done with an RCA EMU-2B microscope operated by C.C. McMurtry at the Department of Oncology, University of Kansas Medical Center. Later electron micrographs were made in a Philips EM-100 microscope. The 2- to 8-micron fractions and the minus 2-micron fractions were examined. Samples were prepared by drying a drop of clay suspension on a collodion substrate and shadowing with chromium from an angle of about 20 degrees. Representative electron micrographs are shown in Plate 3.
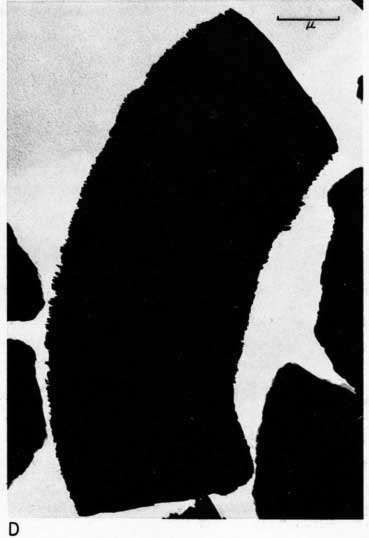
Most particles in the 2- to 8-micron fractions are relatively thick in comparison with their length and width and have irregular angular shapes. These are probably predominantly quartz. Some coarse irregular particles, particularly in clay EL-69-2, are shown by their shadows to be thin flakes; these may be 2:1 layer lattice silicates (illite and mica). The coarse fraction from clay EL-60-6 contains many large accordion-shaped kaolinite books; the largest of those observed in the electron microscope is a curved book about 10 microns long with individual flakes nearly 4 microns in diameter (Pl. 3D). Kaolinite books were not observed in the other three clays.
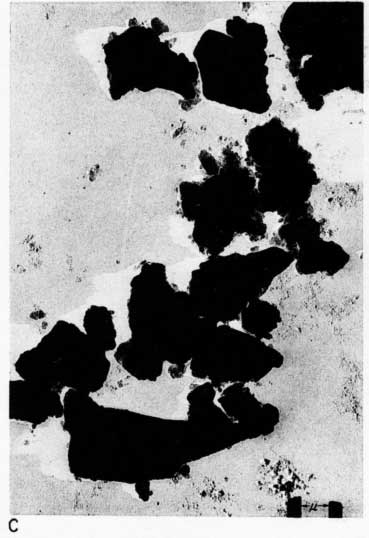
The fraction finer than 2 microns from clay EL-60-6 consists almost entirely of well-developed pseudohexagonal flakes of kaolinite. The fine fraction from clay EL-69-2 contains some irregularly shaped flakes, as well as large numbers of hexagonal flakes (Pl. 3C). The most common flakes of clays O-5-6 and O-38-4, although hexagonal, are smaller than those of clay EL-60-6. Cottony aggregates, typical of Ca-montmorillonite, were not observed in any of the clays, but some, particularly clay O-5-6, contain minute particles finer than 0.5 micron which may possibly be montmorillonite or mixed-layer mineral (Pl. 3B). A few fields contain one or two small elongate particles which may possibly be halloysite. Some micrographs show dense cubic crystals which may be anatase. Most of them are of the order of one-half micron in diameter.
Plate 3--Electron micrographs of clay particles, shadowed with chromium. [Note images on the web version are slightly larger to show detail.] A, Clay O-38-4, fraction finer than 1 micron, x15,000. B, Clay O-5-6, fraction finer than 2 microns, x11,800. Note hexagonal flakes and scattered small particles. C, Clay EL-69-2, fraction finer than 2 microns, x 4,800. Note large irregular flakes. D, Kaolinite book from clay EL-60-6, 2- to 8-micron fraction, x10,600.
X-Ray Diffraction Data
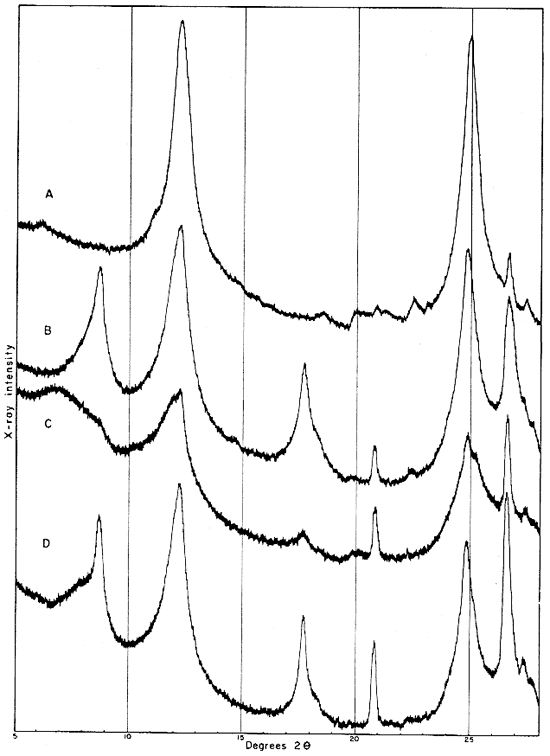
Diffraction patterns were made with a GE XRD-3 Geiger-Mueller counter spectrogoniometer. The patterns were run at a speed of 0.2° 2θ per minute, using a 1° beam slit, 2° detector slit, and nickel-filtered copper radiation at 50 kv and 15 ma. The patterns, reproduced in Figures 2 to 7, show the characteristics of the critical reflections. Diffraction patterns from a sample of Macon kaolinite (A.P.I. H-4) are included for comparison.
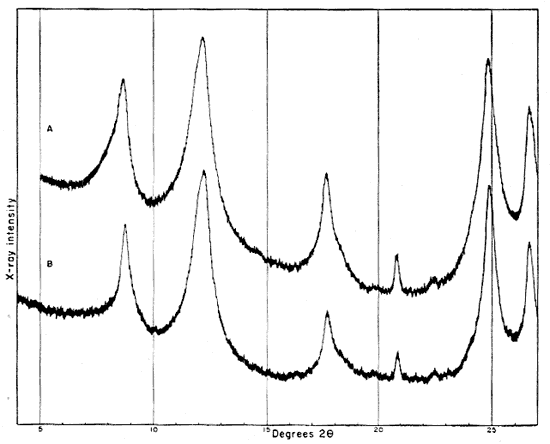
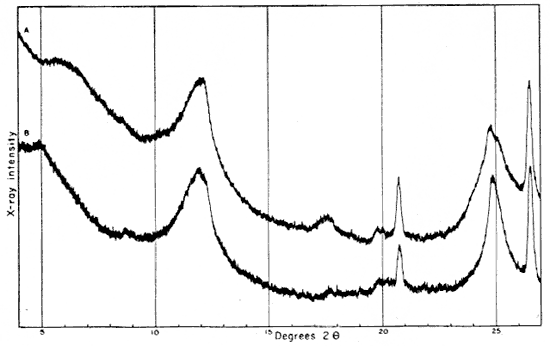
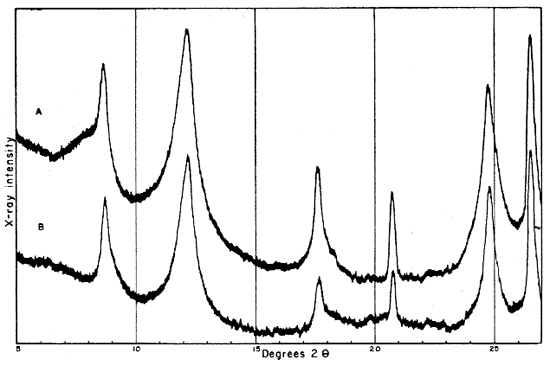
The clays were ground to pass a 62-micron screen and packed into a specimen holder with a shallow opening 1 5/8 inches long. Care was taken to produce random orientation by packing the clay into the specimen holder with the edge of a spatula and forming the final flat surface with rough paper. Patterns from the raw clays and the fraction finer than 2 microns are shown in Figures 2 and 3. Oriented samples of the fraction finer than 2 microns were used for study of the basal reflections from the clay minerals. They were prepared in the standard way by allowing the clay to settle onto a glass microscope slide from a water suspension. After the clay was dried at room temperature a diffraction pattern was obtained (Fig. 4). The slide was then treated with glycerol and another diffraction pattern was run.
Fig. 2--Diffractometer patterns from raw clay samples, packed in specimen holders. Nickel-filtered copper radiation. A, Macon kaolinite (A.P.I. H-4); B, clay EL-60-6; C, clay EL-69-2; D, clay O-5-6; E, clay O-38-4.
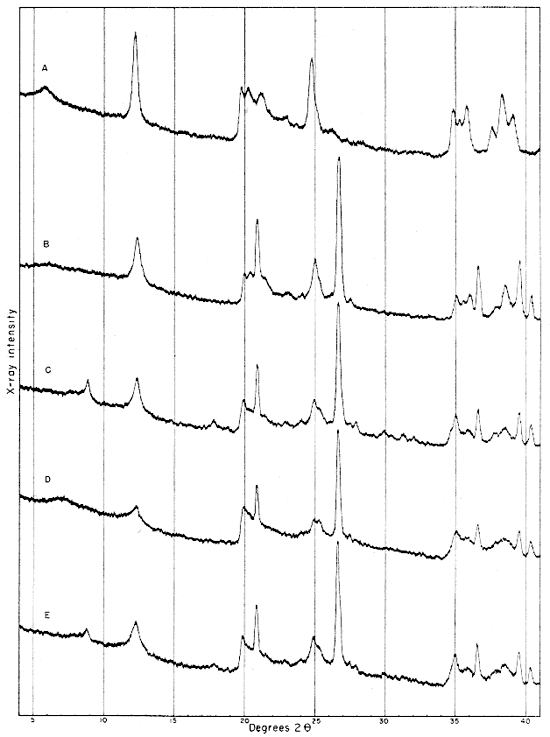
Fig. 3--Diffractometer patterns from fractions finer than 2 microns, packed in specimen holders. Nickel-filtered copper radiation. A, Macon kaolinite; B, clay EL-60-6; C, clay EL-69-2; D, clay O-5-6; E, clay O-38-4.
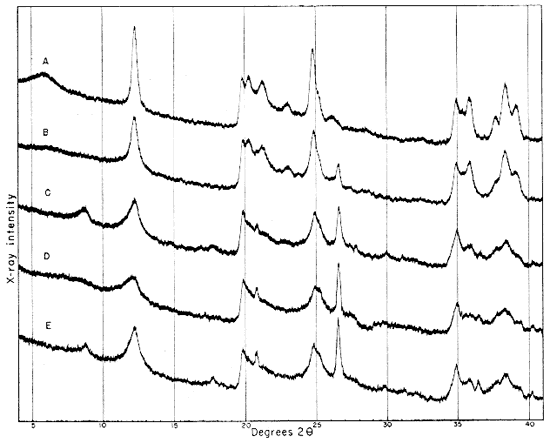
All four clays produced reflections for kaolinite, quartz, and a suggestion of a trace of feldspar. Other minerals found in one or more of the clays include illite, muscovite, "fire-clay mineral," mixed-layer minerals, montmorillonite, and possibly anatase.
Rough semiquantitative estimates of the mineral percentages were made, and although these are reported to the nearest 5 percent, their accuracy may be much less. The chemical analyses, differential thermal curves, and electron micrographs were taken into consideration in estimating percentages.
Clay EL-60-6
Diffraction patterns for clay EL-60-6 give reflections for quartz, kaolinite, and a trace of feldspar. The clay is judged to contain about 50 percent quartz and 45 percent kaolinite. The fraction finer than 2 microns contains almost 95 percent kaolinite and about 1 percent quartz.
The kaolinite reflections are sharp and clearly defined, including the group of reflections from 4.46 A to 3.56 A and the two prominent groups, each of which contains three reflections with spacings 2.55, 2.52, 2.49 and 2.37, 2.33, 2.28 A. The 4.34 A reflection is stronger than that at 4.44 A. The first order basal spacing (001) is 7.2 A. These data indicate that the mineral is kaolinite rather than fire clay (Brindley, 1951, pp. 50-51, 71). The pattern from clay EL-60-6 closely resembles that from the Georgia kaolinite, except for quartz reflections, which are not present in the pattern from the Georgia clay.
The fraction finer than 2 microns, oriented on a glass slide, shows a weak but definite reflection at 14.4 A (Fig. 4A). This reflection, which does not shift in the glycerated clay and is destroyed by heat treatment, may be attributed to a chlorite admixture. The Georgia kaolinite produces a similar low-angle reflection, and the common presence of such impurities in kaolinite has been mentioned by Glass (1952, p. 211) and Keller (1952, p. 225). Part of the minus 2-micron fraction which had been heated for 30 minutes at 600° C. showed a reflection at 3.52 A. This reflection is tentatively assigned to anatase, for nearly 2 percent of a titanium mineral is suggested by the chemical analysis of this fraction, and electron micrographs show a few cubic crystals. No 10 A basal reflections from hydrous mica are observed in the diffraction pattern from the heat-treated clay.
Fig. 4--Diffractometer patterns from fractions finer than 2 microns, oriented on glass slide. A, clay EL-60-6; B, clay EL-69-2; C, clay O-5-6; D, clay O-38-4.
Clay EL-69-2
Clay EL-69-2 consists primarily of quartz (35 percent), kaolinite (35 percent), and illite and muscovite (25 percent). It also contains more feldspar than clay EL-60-6, and a small quantity of a mixed-layer clay mineral.
The 2- to 8-micron fraction contains more than 50 percent quartz, about 20 percent kaolinite, and less than 30 percent illite,, muscovite, and mixed-layer clay. The fraction finer than 2 microns contains approximately 60 percent kaolinite (which gives a broad first-order basal reflection with slight asymmetry suggesting a small quantity of "fire-clay mineral," about 25 percent illite, about 10 percent mixed layer clay, and about 3 percent quartz. An oriented preparation of the minus 2-micron fraction shows the 10 A reflection to be asymmetrical also. The reflection is symmetrical after saturation with glycerol, but the small quantity of mixed-layer material present does not produce an individual reflection at a lower angle (Fig. 5).
Fig. 5--Diffractometer patterns from fraction finer than 2 microns, clay EL-69-2, oriented on glass slide. Nickel-filtered copper radiation. A, Air dried: B, glycerated. Note change in 10 A reflection.
Clay O-5-6
Clay O-5-6 is shown by diffraction patterns to contain about 30 percent quartz, 40 percent "fire-clay mineral" and kaolinite, 25 percent micaceous clay minerals (including illite, hydrous mica with basal spacing greater than 10 A, and montmorillonite), and a suggestion of feldspar.
This clay, which contained appreciable quantities of organic matter, had been treated with H2O2 to make size fractionation possible. This treatment seemingly modified the micaceous clay minerals, so that the minus 2-micron fraction and the 2- to 8-micron fraction may not be representative of these fractions in the original clay. The 2- to 8-micron fraction contains approximately 70 percent quartz, 15 percent kaolin, and less than 15 percent illite, montmorillonite, and mixed-layer mineral.
The fraction finer than 2 microns contains less than 5 percent quartz, about 55 percent "fire-clay mineral" and kaolinite (there is considerably more fire-clay mineral than kaolinite in this fraction), and about 35 percent montmorillonite, illite, and mixed-layer mineral.
The following descriptions of the spectrogoniometer patterns refer to clay which was not treated with H2O2 and was not fractionated. The dry unoriented clay produces a broad kaolin mineral reflection at about 7.3 A and a very broad indistinct basal reflection at 12.6 A. After treatment of the clay with glycerol, this reflection had shifted to 14.2 A but was still broad and indistinct. There is also a weak 10 A reflection from the glycerol-treated clay. Clay allowed to settle in water onto a glass slide and dried at room temperature shows the kaolin basal reflection to be a double one with maxima at 7.4 and 7.2 A. There is also a broad band from 10 A to about 18 A with a maximum at 15.4 A. Saturating the oriented clay with glycerol causes the 15.4 A maximum to move to about 18 A and isolates the 10 A reflection, but the 18 A reflection is not sharp, and mixed layer material is obviously present also (Fig. 6). No higher order reflections for the montmorillonite are produced.
Fig. 6--Diffractometer patterns from fraction finer than 2 microns, clay O-5-6, oriented on glass slide. Nickel-filtered copper radiation. A, Air-dried; B, glycerated.
Seemingly, treatment with distilled water (and a few drops of NH4OH) modified the micaceous clay mineral so that there is an 18 A reflection after glycerol treatment, whereas clay which had not been in distilled water did not react to the glycerol. It is possible that the organic matter in the clay had formed a complex which was destroyed by distilled water.
Clay O-38-4
Clay O-38-4 contains about 40 percent kaolinite, 35 percent quartz, 20 percent illite and muscovite, and a trace of feldspar. There is a slight but definite indication of a mixed-layer mineral.
The 2- to 8-micron fraction contains about 70 percent quartz, about 10 percent illite and muscovite, less than 20 percent kaolinite, and a trace of a mixed-layer mineral.
The fraction finer than 2 microns contains about 65 percent kaolinite, 25 percent illite and mixed-layer mineral, and little more than 5 percent quartz.
The (001) kaolinite reflection at 7.2 A is broad but only slightly asymmetrical, suggesting a very small quantity of fire-clay mineral.
The 10 A reflection is shown on the pattern from the oriented sample to be produced by a mixed-layer mineral as well as illite. Saturating the clay with glycerol shifts part of this reflection to 14.2 A from 11 A or less (Fig. 7), but there are no higher order reflections.
Fig. 7--Diffractometer patterns from fraction finer than 2 microns, clay O-38-4, oriented. Nickel-filtered copper radiation. A, Air dried; B, glycerated.
Summary of Petrographic Data
The petrographic characters of the four clays are summarized below.
Clay EL-60-6, the coarsest textured of the four, is also mineralogically the simplest. It consists almost entirely of rather coarse quartz grains and large to small kaolinite books and flakes. It also seems to contain traces of a chlorite mineral, anatase, and feldspar.
Clay EL-69-2, which is nearly as coarse textured as clay EL-60-6, contains most of its quartz in the silt sizes. Besides quartz and small flakes of kaolinite, it contains about 25 percent illite and muscovite and a small quantity of dark-brown organic matter. Slight asymmetry in the illite and kaolinite basal reflections indicates the presence of small quantities of mixed-layer mineral and "fire-clay mineral" in addition to the illite and kaolinite. The illite occurs as small shreds or flakes distributed in a matrix of kaolinite.
Clay O-5-6 contains appreciable quantities of "fire-clay mineral," some kaolinite, and less illite than clays EL-69-2 and O-38-4. It also contains montmorillonite, a mixed-layer mineral, and much more organic matter than the other clays. It is the finest grained of the four clays, and its particle-size distribution is not unimodal. The quartz grains are predominantly of very fine silt size. The birefringent clay does not occur as visibly distinct shreds in the thin section, although it has good preferred orientation.
Clay O-38-4 is also a fine-grained clay, containing about 40 percent kaolin (only a small proportion of which is "fire-clay mineral"), 30 percent quartz, 25 percent illite and mixed-layer mineral, and a small quantity of organic matter. Most of the kaolinite is in the fraction finer than 2 microns. This clay contains less total quartz but more quartz in the minus 2-micron fraction than the other three clays.
Differential Thermal Analyses
Equipment and Methods
A variety of apparatus for differential thermal analysis has been described rather extensively in the literature. The apparatus consists essentially of control and recording equipment, furnace, sample holders, and thermocouples. The apparatus used in the Geological Survey laboratory includes a Leeds and Northrup Model S Micromax recorder operating in conjunction with a controller, timer, and Variac transformer by means of which the temperature of the furnace can be increased at a uniform rate. The equipment permits variations in heating rate from O° to 25° C. per minute. The furnace temperature is recorded on the Micromax instrument.
The furnace is the vertical platinum-wound type with an inside diameter of slightly more than 1 inch. The sample and reference material holder is made from alumina, and the differential thermocouple junctions are placed in the approximate center of the two 3/16-inch wells. These two junctions and that of the furnace temperature thermocouple are placed at an equal distance from the furnace walls in order to insure equal heat distribution. Platinum and platinum-10-percent-rhodium thermocouples are used throughout.
The differential thermocouple output is preamplified ahead of the Leeds and Northrup Speedomax which records the differential curves. A high degree of amplification of the circuit is possible. The apparatus used is similar to those described by Kerr and Kulp (1948), Kerr, Kulp, and Hamilton (1949), Lambe (1951), and McConnell and Early (1951).
All the analyses reported in this paper were run at an amplification low enough to keep the maximum peaks on the chart paper. Inasmuch as a uniform amplification was deemed necessary in order to facilitate comparisons, rather small peaks were produced on the thermal curves of samples high in quartz. The rate of heating of the furnace was 10° C. per minute for all samples.
Results of Differential Thermal Analyses
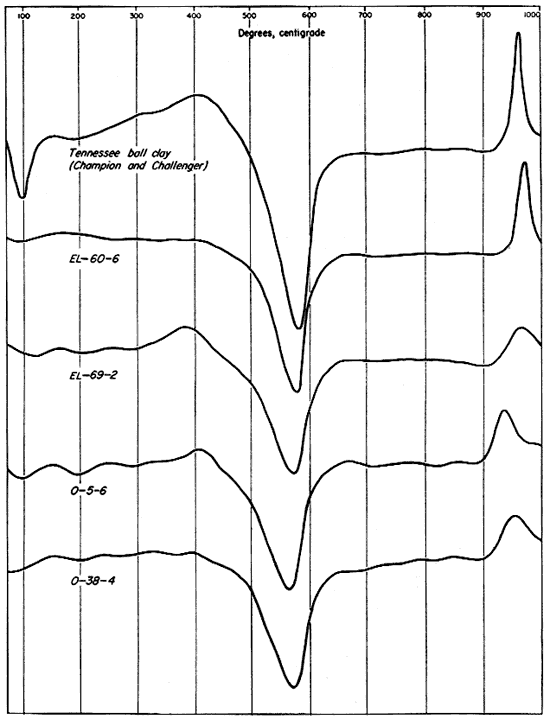
Three differential thermal analyses were run on each of the clays investigated--on the whole or unfractionated clay, the minus 2-micron fraction, and the 2- to 8-micron fraction. Reference analyses of the A.P.I. standard clay, H-4, Macon, Georgia, kaolin (Kerr, Kulp, and Hamilton, 1949), and a commercial sample of Champion and Challenger ball clay from the H.C. Spinks Clay Company, Paris, Tennessee, were run for comparison and are included in the illustrations (Figs. 8, 9, 10).
The differential thermal curves produced by the four Kansas clays and the two reference samples are dominantly those of kaolinite. This is true despite the fact that illite, montmorillonite, and mixed-layer clay minerals total nearly as much as the kaolinite in sample EL-69-2 and represent a considerable proportion of samples O-5-6 and O-38-4 and the Champion and Challenger ball clay. This dominance of the kaolinite curves is due to the fact that endothermic and exothermic reactions produced by beating kaolinite represent much greater energy absorption and output than those produced by heating the other clay minerals.
The differential thermal curves of the original (unfractionated) clays, including the Tennessee ball clay, are shown in Figure 8. For sample EL-60-6 only the characteristic endothermic and exothermic curves of kaolinite were produced. A broad exothermic curve below 400° C. on the thermogram for sample EL-69-2 indicates organic material, probably lignite. A broadening of the endothermic curve slightly below 600° C., and slight endothermic reaction at 900° C. are effects probably produced by illite and mixed-layer clay minerals. The thermogram for sample O-5-6 shows a small but definite endothermic curve at about 200° C. and an inflection at 700° C. indicating a small percentage of montmorillonite. The broad endothermic peak extending from about 450° to 660° C. is probably a composite effect of kaolinite, illite, and mixed-layer minerals. A high-temperature endothermic peak below 900° is too slight to be ascribed definitely to clay-mineral reactions. The exothermic reaction with a relatively sharp peak at about 410° C. was produced by organic material. It is probable, however, that the sharp inflection in the curve can be ascribed to a small amount of pyrite. The thermal curve produced by clay O-38-4 is quite similar to those produced by clays EL-69-2 and O-5-6. The reactions characteristic of kaolinite are dominant, and probably mask the 500° to 650° C. endothermic curve for illite and the slight exothermic reaction above 900°. Illite is indicated by a small endothermic peak at 900°. A broad, shallow exothermic reaction extending from about 250° to 425° was probably produced by a small percentage of organic material. The sharp inflection at 400° may have been caused by a very small percentage of pyrite. A slight endothermic reaction near 200° is indicative of montmorillonite, but this clay mineral was not detected by x-ray analysis.
Fig. 8--Differential thermal curves of the four Kansas clays and a Tennessee ball clay.
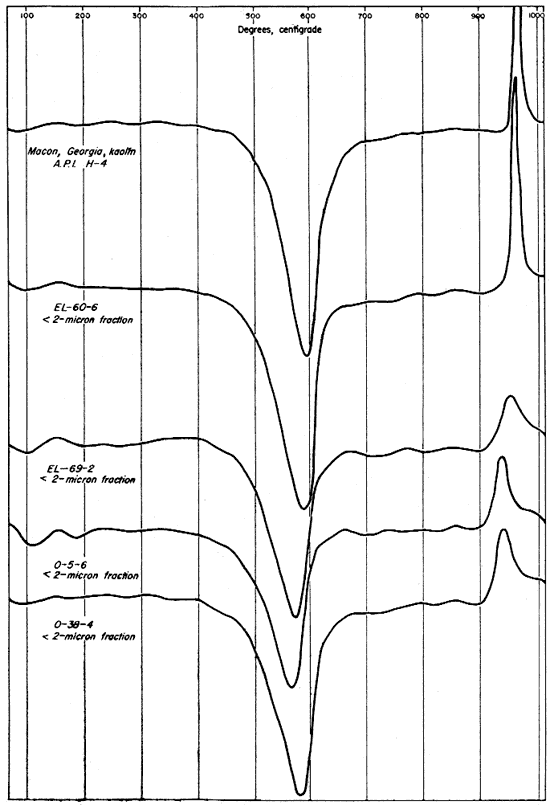
Differential thermal curves from the minus 2-micron fractions of the four clays and from an unfractionated sample of Macon, Georgia, kaolin (A.P.I. standard H-4) are shown in Figure 9. The differential curves for the finer fractions differ from those for the whole clays chiefly in the increased areas under the peaks, with the exception of the exothermic reactions for organic material. In this case the peaks are greatly reduced or absent. This difference especially. noticeable on the curves for clays EL-69-2 and O-5-6. The organic matter in clay O-5-6 was removed with H2O2 before fractionation, but clay EL-69-2 was not treated with H2O2 and the absence of a strong exothermic reaction for organic material indicates that it was concentrated in the coarser fractions.
Fig. 9--Differential thermal curves of the minus 2-micron fraction of the four Kansas clays and Macon, Georgia, kaolinite.
The differential thermal curves for the 2- to 8-micron fractions of three of the clays (Fig. 10) differ markedly from those of the finer fractions and of the whole clays. The 2- to 8-micron fraction of clay EL-60-6, however, produces a curve that is essentially the same as that for the whole clay, although the endothermic peak for kaolinite is broader, and indicates a greater percentage of kaolinite. The thermogram for clay EL-69-2 has a strong exothermic peak from 300° to 400° C. showing a concentration of organic material and perhaps some pyrite in the 2- to 8-micron fraction whereas the other three clays do not show this concentration. The characteristic peaks for kaolinite are small for all the clays except EL-60-6, and these three clays (EL-69-2, O-5-6, and O-38-4) produced a small but definite inflection at the alpha to beta quartz inversion. The fact that this inversion occurs at about 575° C. on the curves indicates that all other temperatures are approximately correct.
Fig. 10--Differential thermal curves of the 2- to 8-micron fraction of the four Kansas clays.
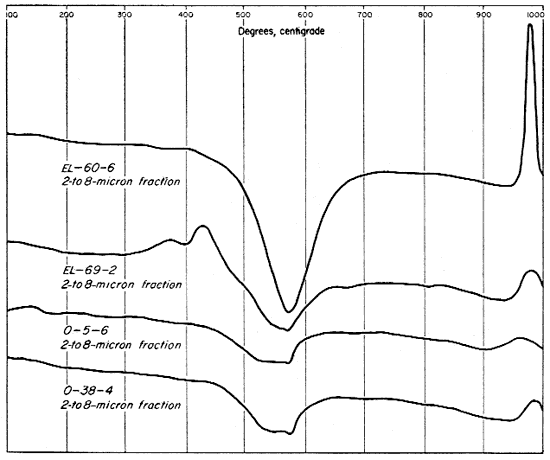
Peak temperatures and areas are given in Table 10. The endothermic kaolinite peaks occurred at higher temperatures on the thermograms of the minus 2-micron fractions than, on those of either the whole clay or the 2- to 8-micron fractions. With the exception of clay EL-60-6 the same peak occurred at lower temperatures on the 2- to 8-micron fractions. The exothermic peaks, on the other hand, occurred at the lowest temperatures on the minus 2-micron fractions, and at the highest temperatures on the 2- to 8-micron fractions. Areas under both the endothermic and exothermic peaks are roughly proportional to the concentration of kaolinite in the samples. These areas are larger for the 2- to 8-micron fraction of clay EL-60-6 than those for the whole clay, but are markedly smaller for the same size fraction of the other three clays. In every case the minus 2-micron fraction produced peaks enclosing the largest areas.
Table 10--Data from thermal analysis curves.
| EL-60-6 | EL-69-2 | O-5-6 | O-38-4 | H-4 | C. & C. | ||
|---|---|---|---|---|---|---|---|
| Endothermic peaks | |||||||
| Peak temperatures, degrees C. | |||||||
| Unfractionated clay | 580 | 565 | 565 | 575 | 600 | 583 | |
| 2-8-micron fraction | 582 | 560 | 550 | 555 | |||
| <2-micron fraction | 590 | 575 | 570 | 590 | 575 | ||
| Peak areas, square cm. | |||||||
| Unfractionated clay | 21.80 | 19.19 | 21.65 | 21.13 | 39.14 | 24.13 | |
| 2-8-micron fraction | 24.49 | 10.09 | 7.05 | 8.77 | |||
| <2-micron fraction | 34.90 | 28.38 | 26.52 | 33.24 | 25.65 | ||
| Exothermic peaks | |||||||
| Peak temperatures, degrees C. | |||||||
| Unfractionated clay | 970 | 965 | 935 | 950 | 9310 | 963 | |
| 2-8 micron fraction | 977 | 982 | 960 | 982 | |||
| Minus 2-micron fraction | 960 | 950 | 952 | 940 | 965 | ||
| Peak areas, square cm. | |||||||
| Unfractionated clay | 5.06 | 2.13 | 2.53 | 2.97 | 9.14 | 5.10 | |
| 2-8-micron fraction | 6.65 | 1.50 | 0.57 | 1.46 | |||
| <2-micron fraction | 7.43 | 2.52 | 3.36 | 4.28 | |||
An attempt was made to use the peak areas as a means of estimating the percentage of kaolinite contained in each clay and clay fraction. It was possible to estimate the order of magnitude, but accurate quantitative estimates are not possible unless a complicated series of known clays is used. Particle size, perfection of crystallization, and the influence of the other clay minerals would have to be taken into account. In a general way the curves for the Macon, Georgia, kaolin and clay EL-60-6, and for the Champion and Challenger ball clay and the other three clays show quantitative agreement. The quantitative aspects of the differential thermal curves will be compared with other data in another section.
Prev Page--Chemical Properties || Next Page--Ceramic Properties
Kansas Geological Survey, Geology
Placed on web June 22, 2007; originally published Dec. 1954.
Comments to webadmin@kgs.ku.edu
The URL for this page is http://www.kgs.ku.edu/Publications/Bulletins/109_10/05_petro.html