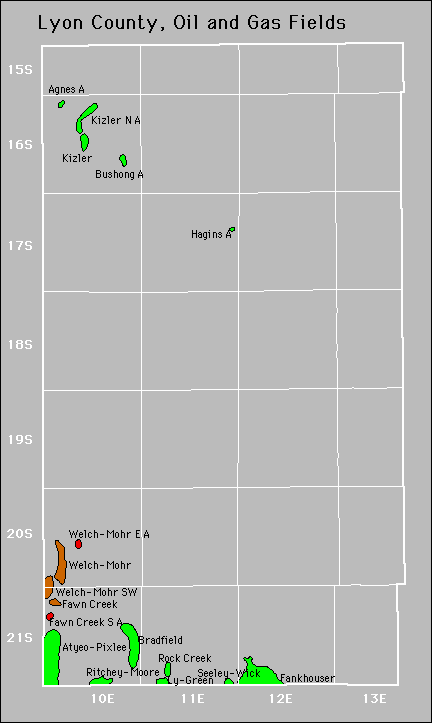
| Year | Oil | Gas | ||||
|---|---|---|---|---|---|---|
| Production (bbls) |
Wells | Cumulative (bbls) |
Production (mcf) |
Wells | Cumulative (mcf) |
|
| 1995 | 42,715 | 90 | 12,229,945 | - | - | 110,495 |
| 1996 | 39,371 | 78 | 12,269,316 | - | - | 110,495 |
| 1997 | 36,876 | 80 | 12,306,192 | - | - | 110,495 |
| 1998 | 28,518 | 67 | 12,334,710 | - | - | 110,495 |
| 1999 | 21,756 | 54 | 12,356,466 | - | - | 110,495 |
| 2000 | 19,656 | 51 | 12,376,122 | - | - | 110,495 |
| 2001 | 19,840 | 49 | 12,395,962 | - | - | 110,495 |
| 2002 | 20,255 | 43 | 12,416,217 | - | - | 110,495 |
| 2003 | 16,812 | 42 | 12,433,029 | - | - | 110,495 |
| 2004 | 14,520 | 42 | 12,447,549 | - | - | 110,495 |
| 2005 | 12,979 | 41 | 12,460,528 | - | - | 110,495 |
| 2006 | 13,465 | 40 | 12,473,993 | - | - | 110,495 |
| 2007 | 12,288 | 41 | 12,486,281 | - | - | 110,495 |
| 2008 | 13,281 | 40 | 12,499,562 | - | - | 110,495 |
| 2009 | 9,623 | 38 | 12,509,185 | - | - | 110,495 |
| 2010 | 9,470 | 39 | 12,518,655 | - | - | 110,495 |
| 2011 | 20,058 | 40 | 12,538,713 | - | - | 110,495 |
| 2012 | 60,858 | 41 | 12,599,571 | - | - | 110,495 |
| 2013 | 97,411 | 39 | 12,696,982 | - | - | 110,495 |
| 2014 | 112,460 | 43 | 12,809,442 | - | - | 110,495 |
| 2015 | 131,852 | 42 | 12,941,294 | - | - | 110,495 |
| 2016 | 84,716 | 58 | 13,026,010 | - | - | 110,495 |
| 2017 | 69,489 | 78 | 13,095,499 | - | - | 110,495 |
| 2018 | 64,457 | 84 | 13,159,956 | - | - | 110,495 |
| 2019 | 71,056 | 84 | 13,231,012 | - | - | 110,495 |
| 2020 | 59,549 | 85 | 13,290,561 | - | - | 110,495 |
| 2021 | 64,893 | 95 | 13,355,454 | - | - | 110,495 |
| 2022 | 76,354 | 90 | 13,431,808 | - | - | 110,495 |
| 2023 | 77,070 | 98 | 13,508,878 | - | - | 110,495 |
| 2024 | 88,466 | 103 | 13,597,344 | - | - | 110,495 |
| 2025 | 58,291 | 101 | 13,655,635 | - | - | 110,495 |


No Abandoned fields.