Putting it all together
The integration of geoscience data by quantitative methods
Previous--Map 1 ||
Next--Map 3
PCB Example 5--Map 2
Maps of PCB concentration in South Central sector of Hudson River.
Because PCB concentration is first transposed by anamorphosis into
a standard normal distribution, the mean is known to be zero and we
can use simple kriging to estimate the concentration.
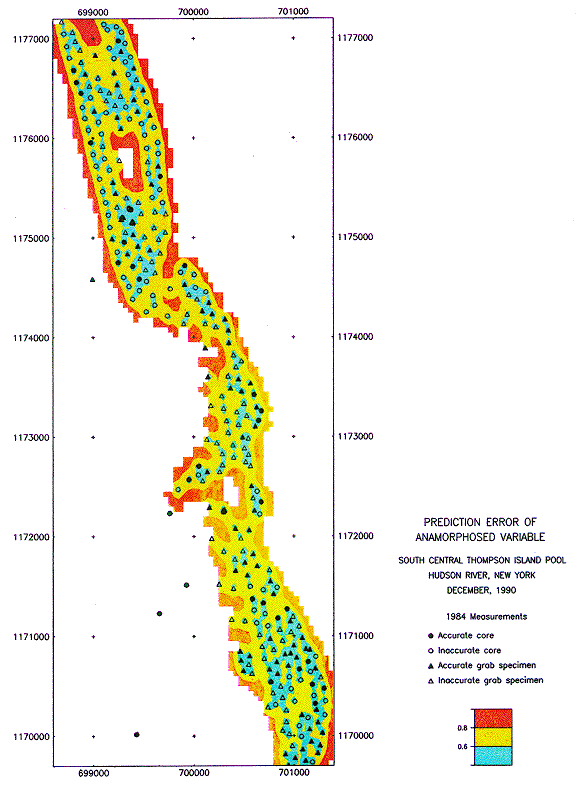
2. Standard error of anamorphosed PCB concentration,
in standard normal (Z) units. Blue = less than 0.6,
Yellow = 0.6 to 0.8, and Red = over 0.8.

Previous--Map 1 ||
Next--Map 3

