Putting it all together
The integration of geoscience data by quantitative methods
Previous--Map 2 ||
Next--Map 4
PCB Example 5--Map 3
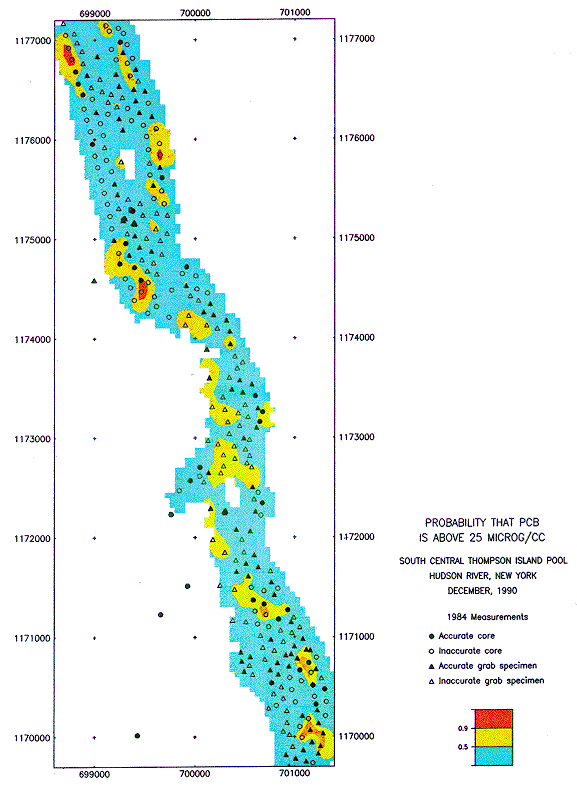
Maps of PCB concentration in South Central sector of Hudson River.
Because PCB concentration is first transposed by anamorphosis into
a standard normal distribution, the mean is known to be zero and we
can use simple kriging to estimate the concentration.
3. Probability that the PCB concentration exceeds
25 micrograms/cc. Blue = probability less than 50%, Yellow =
probability between 50% and 90%, and Red = probability exceeds 90%.

Previous--Map 2 ||
Next--Map 4

