Putting it all together
The integration of geoscience data by quantitative methods
Previous--Example Semivariograms ||
Next--Map 2
PCB Example 5--Map 1
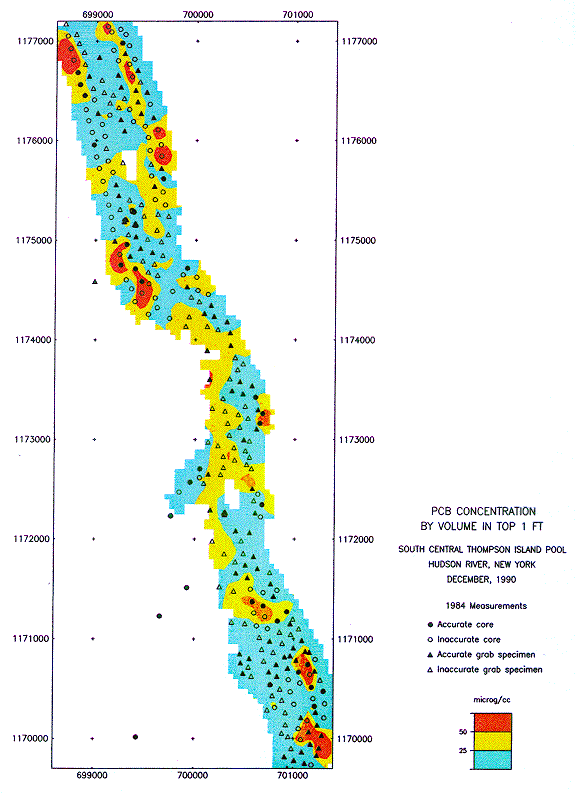
Maps of PCB concentration in South Central sector of Hudson River.
Because PCB concentration is first transposed by anamorphosis into
a standard normal distribution, the mean is known to be zero and we
can use simple kriging to estimate the concentration.
1. PCB concentration in top 12 inches of bottom
sediment, in three ranges. Blue = less than 25 micrograms/cc,
Yellow = 25 to 50 micrograms/cc, and Red = over 50 micrograms/cc.

Previous--Example Semivariograms ||
Next--Map 2

