Kansas Geological Survey, Open-file Report 2007-13
by
Margaret Townsend
KGS Open File Report 2007-13
May 2007
The city of Lincolnville, Kansas, has had a nitrate contamination problem for many years. The Kansas Department of Health and Environment, Servi-Tech Laboratories, Inc., and Terrane Resources have evaluated the problem since 1998. Prior to that, the Kansas Geological Survey (KGS) had worked on a ground-water quality survey in Marion County, including several wells from the Lincolnville area. All of the previous studies reported high nitrate and fluctuating chloride concentrations in the shallow aquifer (Chaffee, 1988; O'Connor and Chaffee, 1983; Vocasek and Marks, 2003).
The Kansas Geological Survey was asked to participate in a study of the area to try to determine a source or sources for the observed nitrate concentrations, particularly in the shallow ground water, using the nitrogen-15 natural abundance isotope method. In addition, bromide/chloride ratios and boron values were evaluated to assist in determining if the wastewater lagoons to the southeast of the city might be a source of the observed nitrate. Possible sources in the study area include improperly abandoned septic systems and latrines, sites of past animal waste storage from small farmsteads with a few cattle or chickens, over-fertilization within the city boundaries, spills in the area of the fertilizer cooperative in town, farming surrounding the city, and wastewater lagoons to the southeast of the city.
The city of Lincolnville is located in northeastern Marion County. The legal location for the city is the SW, sec. 11, T. 18 S., R. 4 E. and N2, NW, sec. 14, T. 18 S., R. 4 E. A location map of the city and sampling points outside of the city is shown in fig. 1 and sampling points within the city are shown in fig. 2. Precipitation is approximately 31 inches/year. Evaporation is approximately 31.5 inches/year (Thornthwaite and Mather, 1957).
Figure 1--Study area and sampling points (black dots) outside of the city of Lincolnville, Kansas, shown on the Lincolnville 7 1/2-minute USGS topographic map. Marion County is located with a black dot on the state map of Kansas.
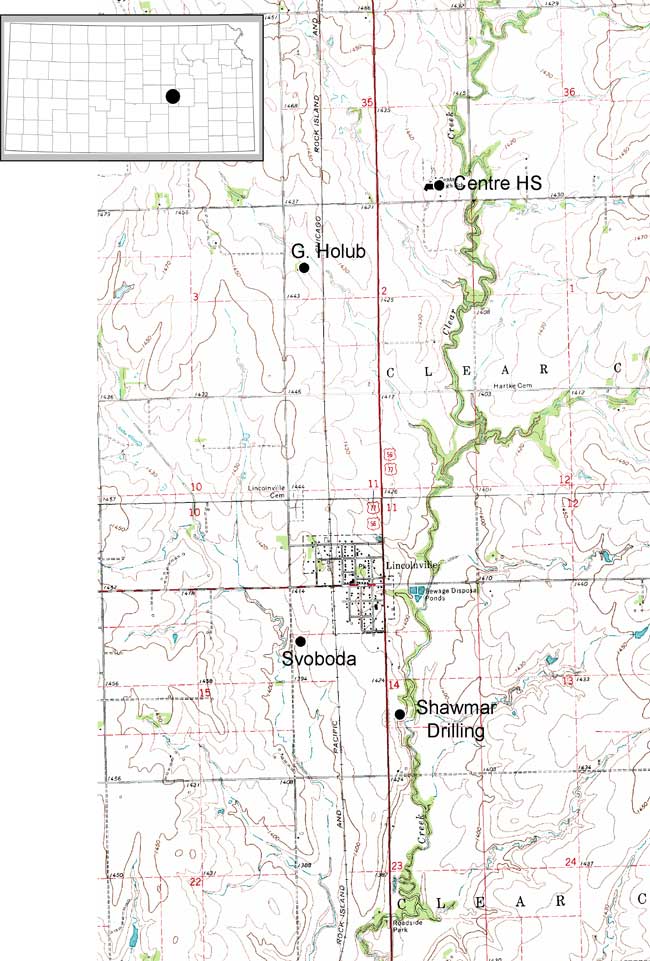
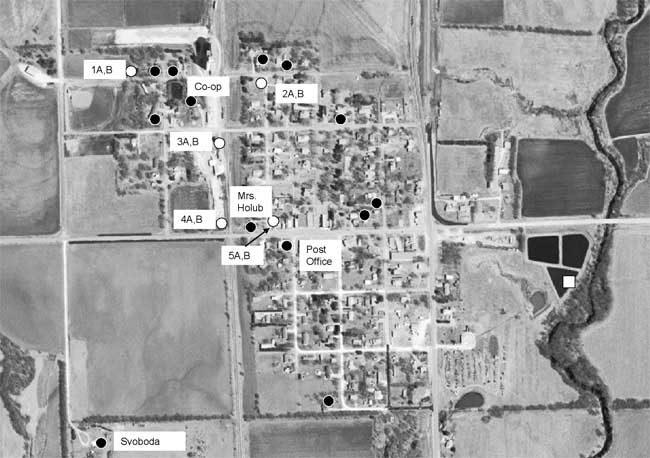
Figure 2--Domestic (black dots) and monitoring well (white dots) sampling points and wastewater lagoon 3 (white) square.
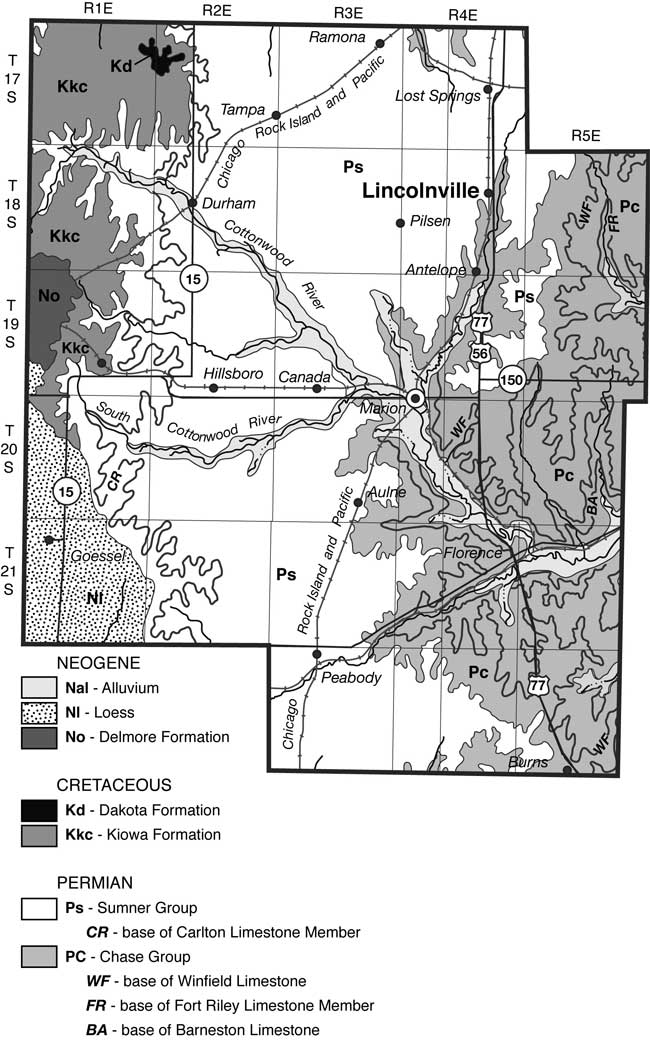
Marion County is located in the Flint Hills physiographic province of Kansas (fig. 3). The geology of the area consists primarily of the Permian Chase Group and the overlying Wellington Formation. The major aquifers in the area include the Herington Limestone Member of the Nolans Limestone, underlain by the Paddock Shale Member, and the Krider Limestone Member. The Odell Shale acts as an aquitard between the Nolans Limestone and the underlying the Cresswell Limestone member of the Winfield Limestone. The stratigraphic section is shown in fig. 4. The geologic map of the area shows the relationship of the Permian units with the overlying Tertiary and Holocene depositional units (fig. 5).
Figure 3--Physiographic map of Kansas showing the Flint Hills Uplands area. Marion County is marked by the white dot.
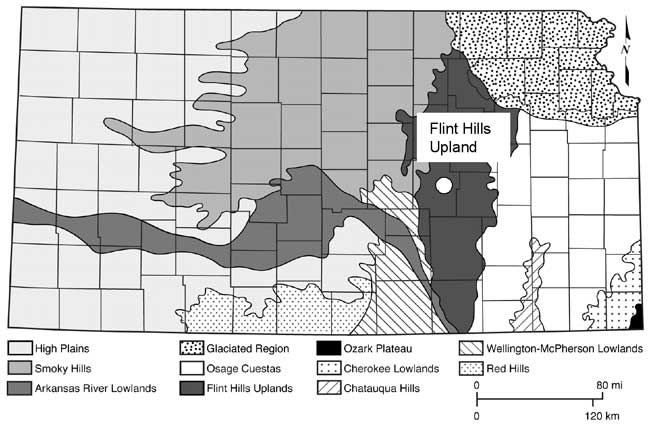
Figure 4--Stratigraphic column of geology in Lincolnville area. The positions of the Herington Ls. and Cresswell Ls. Members are shown by arrows. The Odell Shale occurs between the two units. The chart is from Zeller (1968), http://www.kgs.ku.edu/Publications/Bulletins/189/gifs/strat_chart.pdf.
Figure 5--Geologic map of Marion County, KS (O'Connor and Chaffee, 1983).
Soils in the area are predominately the Irwin silty clay loam. Thickness ranges from 5 to 10 ft. and overlies shale. The upper several feet have a pH less than 6 which suggests that recharge by rainfall is aggressive in dissolution of minerals resulting in increased total dissolved solids over time (Hem, 1985).
Depth to water ranges from 25 to 29 ft for the shallow wells and 40 to 45 ft for the deeper wells (2002 measurements, Vocasek and Marks, 2003).
The residents of Lincolnville obtain drinking water from private wells of differing ages and construction. Shallow wells in the area are screened in the upper aquifer (Herington Limestone Member, fig. 4) and are generally less than 40 feet deep.
Deeper wells are screened in the lower aquifer (Cresswell Limestone Member, fig. 4) and are generally greater than 60 feet in depth (Vocasek and Marks, 2003). The two aquifers are separated by a confining layer of shale. Previous work by Chafee (1988) indicated that well construction in the area may result in cross contamination between the two aquifers due to improper well construction resulting in the lack of a grout zone across the shale. As a result the contaminated shallow aquifer water is able to migrate through the annular space between the well casing and the borehole into the lower aquifer.
The city has had sewer service for at least 40 years. The city has lined and replaced pipes in the sewer system in the past, but no overall leakage was reported from the system. Other than cleaning out the wastewater lagoons approximately 15 years ago, no major installation or repair of city sewer and wastewater treatment system has taken place.
Ground-water flow in the shallow aquifer (Herington Limestone Member) is generally to the northwest but is highly variable (fig. 6) while flow in the lower aquifer (Cresswell Limestone Member) is generally from north to south. The flow direction in the two aquifers was determined from water-level measurements in the 10 monitoring wells installed during previous studies (Vocasek and Marks, 2003). The difference in flow direction between the two units indicates that the Odell Shale is an effective barrier to cross flow between the aquifers if it is not breached.
Figure 6--Ground-water flow direction variability in shallow aquifer (Herington Limestone Member) plotted from data collected by Servi-Tech, Inc., and Terrane Resources, 1998-2004 (Vocasek, 2007, personnel communication).
Water samples were collected from 10 monitoring wells (the shallow and deep wells at the five sites in fig. 2) in the city of Lincolnville, Kansas, on August 23-24, 2006. The shallow monitoring wells A were purged using a bailer. Several of the wells were bailed to dryness and left to recover for sampling the next day. The deeper B monitoring wells were sampled using a 240 v submersible pump.
The domestic wells were sampled after turning on the pump and letting the water discharge until three consecutive temperature and specific conductance readings were measured at five-minute intervals. The wells usually ran for a minimum of 20 minutes before a sample was collected. Four samples were collected from wells outside of the city boundaries (fig. 1) to represent the nitrate-N content in the regional ground water (fig. 1).
Samples were collected in a bucket that was cleaned with deionized water between wells and then poured into sample bottles: a 500-mL non-preserved sample for cations (calcium, magnesium, potassium, sodium) and a 200-mL sample with 2-ml 10% HCl preservative for nitrate and other anions (chloride, bicarbonate, and sulfate).
An additional 500-mL unpreserved sample was collected for analysis by the Servi-Tech laboratory for comparison. Samples for nitrogen-15 determination were collected in 1-liter bottles. All samples were stored on ice until delivered to the laboratory at the KGS in Lawrence or the Servi-Tech laboratory in Dodge City, Kansas. Samples were refrigerated in the laboratory until analyses were performed.
Water samples were also collected at the wastewater treatment lagoons. A bailer was used to retrieve a sample from each of three treatment ponds. The wastewater was combined in a bucket and then poured into 1-liter sample bottles and sent to Servi-Tech for filtration and complete analyses before being frozen for isotope analysis or stored in a refrigerator to be sent later to the KGS for bromide/chloride and sulfate analyses.
Samples for determination of nitrogen-15 on dissolved nitrate were frozen at the KGS until they were sent by Federal Express to the University of Virginia for analysis. Samples were kept frozen at the University until analyzed.
A Garmin geographic positioning system (GPS) was used to take latitude and longitude location readings for each well. Notes and pictures were taken to document the land use surrounding each well.
In the laboratory the KGS filtered the water samples through 0.45-µm membrane filter paper before analysis. Specific conductance was measured to estimate chloride concentrations and determine dilution factors for the optimum concentration range of the analytical method for bromide, iodide, and chloride measurement. Chloride, sulfate, bromide, total inorganic iodine, and iodate concentrations were determined using automated colorimetric methods on a Technicon AutoAnalyzer II. Dissolved iodide was computed from the total inorganic iodine and iodate concentrations and used to correct for its effect on the measured bromide in the analytical method. Nitrate content was determined on the AutoAnalyzer using an ultraviolet spectrophoto-metric method. Bicarbonate content was computed from an alkalinity determination using an automated titrimeter. Cation concentrations were measured using an inductively coupled argon plasma spectrometer. Only conductance, chloride, bromide (along with iodine species for bromide correction) and sulfate were determined in the untreated and treated wastewater samples. Charge balance errors calculated for the well waters for which measurements of all major and substantial minor constituents were completed were all <2% and averaged 1.0%. As a part of its quality assurance steps, the KGS participates in the standard reference water program of the U.S. Geological Survey.
Servi-Tech Laboratories, Inc., performed complete analyses only on the lagoon 3 sample. Nitrate, specific conductance, ammonium, total nitrogen, total organic nitrogen, and total Kjeldahl nitrogen were run on all of the other lagoon samples.
Laboratory information and chemical data for the ground water and wastewater samples are listed in Appendix A. The table includes the total dissolved solids (TDS) content calculated from the major and minor constituent concentration. In the TDS computation, the bicarbonate was multiplied by 0.4917 to approximate the carbonate that would be left in the residual solids after evaporating to dryness (Hem, 1985).
The nitrogen-15 isotopic composition in the waters was determined at the Department of Environmental Sciences, University of Virginia. Samples of the dried nitrate-containing salts dissolved in the waters were combusted at high temperature to nitrogen gas for analysis of their isotopic compositions. The δ15N was determined on a Micromass Optima isotope ratio mass spectrometer (IRMS) coupled with an elemental analyzer (EA), with an overall precision better than 0.5 ‰. The data are reported relative to a standard (atmospheric N2) defined to be 0 ‰, and expressed in δ notation as
δsample(‰)= (Rsample/Rstandard -1) x 1000
where δsample represents δ15N, and R is the molar ratio of the heavier (15N) to the lighter (14N) isotope for the standard or sample (Hoefs, 2001). The analyses were run on nitrate in all samples except the untreated wastewater sample, which has ammonium as the dominant nitrogen form.
Well log information was collected where available. Many of the sampled wells have drillers' log information available at the KGS Data Resources Library and online at http://www.kgs.ku.edu/Magellan/WaterWell/index.html. A number of the wells sampled in this study did not have well logs available. Estimated depths came from the land owners and from past studies and are not reliable for determining if a well has construction problems.
The use of complete water chemistry analyses helps to determine other factors and processes that may impact the occurrence of nitrate in ground water. The use of pH helps to determine if water has reducing water chemistry. If the pH is around 6 or less and iron, manganese, ammonium, chloride, and sulfate are present in measurable quantities then the water is considered reducing and the nitrate concentration is generally very low. In this situation it is likely that the nitrate is reduced to ammonium and nitrogen gas by bacterial action (denitrification) and this process will be reflected in the isotopic signature (see Nitrogen-15 section).
If the pH is above 8 then a chemical volatilization process of ammonium to ammonia may occur causing a release of nitrogen gas and enrichment of nitrogen-15 in the remaining ammonium because of fractionation processes. If the chemistry of the water changes by mixing with a lower pH water then the ammonium may be nitrified to nitrate by bacteria and the nitrogen-15 signature will become more enriched (see Nitrogen-15 section).
The major cation and anion chemistry helps to determine impacts of evapoconcentration or dilution on the resulting water chemistry. Specific conductance is a reflection of the total dissolved solids concentration of the ground water. Generally, if specific conductance increases with constituents such as chloride, sulfate, bicarbonate, and potentially nitrate, the ground water has been impacted by evapoconcentration or evapotranspiration enrichment. As the water is evaporated away or utilized by plants the salts content of the remaining quantity of water increases resulting in an increase in overall salinity. This is particularly true in areas with agriculture and low precipitation such as in the Lincolnville area. Nitrate does not always track with specific conductance as the other anions tend to do. If the source of nitrate is not related to farming sources and the application of fertilizer or animal waste on a field, then evapoconcentration processes may not impact the resulting concentration of nitrate found in the water. This would be reflected by a nitrate concentration that does not correlate with specific conductance.
If the specific conductance is low (< 800 µmhos/cm), this often indicates that the ground water has not been affected by evapoconcentration processes. Changes in specific conductance across an area may indicate different sources of water or mixing of water of different total dissolved solids. Knowing the complete chemical analysis of a water sample permits determination of possible sources affecting the water chemistry.
The cations calcium, magnesium, and sodium are affected by cation exchange processes with clays. Retention of calcium and magnesium by clays (smaller ions than sodium) can result in an increased concentration of sodium relative to the other cations. Use of bromide/chloride ratios can help determine sources of salinity. Boron is useful as a tracer particularly of septic system waste or wastewater recharge. Increased bicarbonate concentration can help to substantiate denitrification processes in reducing water chemistry.
A Piper trilinear diagram is a tool to represent the whole water chemistry of samples relative to other samples (Hem, 1985). The diagram permits identification of samples that are different from the majority of samples and permits closer identification of the ions contributing to those differences. The values are presented as percentages of the total anion or cation concentrations. The water chemistry information for Lincolnville is shown on a Piper diagram (fig. 7) and chemical analyses for all of the sampling points are given in Appendix A.
Figure 7--Piper diagram of water samples collected at Lincolnville, Kansas, and in surrounding areas. Diagram illustrates variation in water chemistry caused by nitrate contamination and evapoconcentration enrichment. Dotted circle areas show effects of higher nitrate and chloride in the samples. The solid ellipse encloses waters of calcium-bicarbonate chemical type.
Water in the Lincolnville area is generally classified as calcium bicarbonate water which means that the dominant cation is calcium and the dominant anion is bicarbonate. Figure 7 shows that most of the samples are calcium bicarbonate type waters (enclosed by the solid black line) that are not impacted by increased nitrate or chloride concentrations. The wells encircled by the dashed black lines are those with the highest measured nitrate-nitrogen (nitrate-N) and chloride concentrations. Values above 10 mg/L nitrate-N are above the U.S. EPA drinking-water limit and are considered impaired. These samples also showed high chloride concentrations and so moved the position of the points on the Piper diagram towards the higher chloride, nitrate, and sulfate percentages.
The Post Office and G. Holub wells plot away from the other samples. The G. Holub sample has higher sodium, chloride, and sulfate concentration than the other samples. This sample was collected northwest of the city in a farmed area (fig. 1). This sample most likely reflects the impact of evapoconcentration from agriculture. The Post Office sample is sodium, calcium bicarbonate sulfate water (fig. 6). This well may also reflect an impact of evapoconcentration enrichment from lawn watering as there is a large amount of grass in the area, or the sulfate may be a result of dissolution of gypsum in the limestones. The increased sodium may be related to remnant effects of a previously abandoned septic system that had received wastewater from a water softener. In this case, the higher chloride concentration from the waste would have been largely flushed from the location, but high sodium contents adsorbed on clays could now be desorbing during cation exchange as calcium type water recharges to the subsurface.
The lagoon sample (fig. 2) plots in a higher ion area than the ground waters collected at the site. The lagoon sample shows some concentration of ions from evaporation during the treatment process. It also reflects the higher chloride concentrations that occur from human waste and the treatment process. The presence of the lagoon sample away from most of the ground-water samples suggests that mixing has not occurred between the lagoon and ground water. The location of the lagoon in relation to the Post Office and G. Holub samples suggests that evapoconcentration has played a role at all three locations.
Most of the shallow and deep wells have nitrate-N values above 2 mg/L, which is considered the upper limit for pristine water not impacted by human activities (Mueller and Hesel, 1996; Appendix A). The majority of the wells that have nitrate-N contents above the drinking-water limit of 10 mg/L are shallow wells less than 40 feet in depth (Appendix A and Fig. 8). Figure 8 shows the nitrogen concentrations and specific conductivity values for the sampled wells and from the wastewater lagoons at Lincolnville and Centre High School in Lost Springs (fig. 1).
Figure 8--Nitrate-N contents for monitoring well samples and total nitrogen concentrations for the lagoon samples plotted against specific conductance values. USEPA drinking water limit for nitrate-N shown at 10 mg/L. USGS "pristine" non-impacted nitrate-N level is plotted at 2 mg/L. Lagoon samples are plotted as total nitrogen because the nitrate values are minimal in comparison to the organic forms of nitrogen in the wastewater.
Figure 8 shows the range of specific conductance and nitrogen values for the water samples (Appendix A). In general, as specific conductance of the water increases, so does the ion concentration (Hem, 1985). The graph indicates that the shallow well waters are more impacted by high total dissolved solids than the deep well waters. The nitrate-N and specific conductance values tend to increase as shown by the regression lines for both the shallow and deep wells but the rate of increase in nitrate-N content is greater for the shallow than for the deeper well waters. The R2 value is higher for the deeper aquifer R2 = 0.5778 than the shallow aquifer R2 = 0.3114. The variation in the shallow aquifer may be related to recharge effects and to a variable sources for the nitrate-N. The increase of nitrate with specific conductance suggests that evapoconcentration may have an effect on the increasing conductivity.
Another possibility is that a past source of contamination may have affected the shallow aquifer. After talking to the residents of the town when the KGS was there sampling the lagoons (fall 2007), it became clear that at least 15 years ago the lagoons were drained and scraped to remove excess solids. It is possible that the removal of wastes and disturbance of the solids layer permitted exposure of the ammonium waste in the solids and soil liner and permitted nitrification of the waste with the result that an increased concentration of nitrate-N moved from the lagoons to the ground water. Removal of the solids layer would possibly permit increased permeability in the compacted liner layer, and when the lagoons were refilled the increased head could cause increased downward leakage at least until the solids barrier reestablished itself. This type of leaching could have resulted in the shallow aquifer being contaminated with higher concentrations of nitrate-N and chloride while the lower aquifer was not impacted except in a cross-formational manner related to improperly constructed well bores or abandoned wells (Chaffee, 1988). The boron levels shown in the lagoon samples (Appendix A) would be diluted by regional ground-water concentration (see boron tracer section). The current overall chemistry of the area does not indicate a continuing current source from the lagoons.
Figure 9 shows a plot of nitrogen concentration (nitrate-N for wells and total nitrogen for lagoons) versus chloride concentration. This graph is similar to fig. 8 because of the large contribution of both nitrate and chloride to the specific conductance readings. This graph indicates that the shallow wells in the city are impaired by nitrate-N concentration. They all have high chloride concentrations that are well above 100 mg/L.
Figure 9--Nitrate-N and chloride contents for sampled wells and lagoons in the Lincolnville area. The dashed line at 10 mg/L shows the USEPA drinking water limit for nitrate-N. The dashed line at 2 mg/L shows the USGS "pristine" non-impacted nitrate-N level.
The exception is the well at Mrs. Holub's home. This site may be impacted by an old latrine present on the property and/or by a chicken coop that was located nearby. The latrine source would have higher chloride concentration (50-100 mg/L; McQuillan, 2004) and the poultry source would have a relatively low chloride concentration (< 5mg/L; Hatzell, 1995) but both would have high nitrate values once the organic nitrogen is transformed into nitrate. The four shallow monitoring wells (1A, 2A, 3A, and 4A) are all located in an area with high nitrate and chloride concentration. The Swayze well has a potential animal-waste source nearby in that dog pens are located on the property. The disposal point for waste material from the animals was not located but if there is a manure pile this may be a possible source of contamination at this site. In addition, the well at this site is located in a pit below ground level and looked as though it might not be protected in case of surface runoff. It is possible that water with contaminants could make its way down the well bore. Additional information on the nitrate source will be discussed in the nitrogen-15 section of this report.
The high chloride concentration of the four shallow monitoring wells is problematic. The potential sources of chloride would be from the lagoon water, evapoconcentration of water used for water lawns, salts used for water softeners, or a possible animal-waste source. More discussion is given in the bromide/chloride ratio section.
Figure 10 shows the bromide/chloride ratios for the sampled waters and for other waters plotted for comparison purposes. The two long-dashed curves in fig. 10 enclose a zone representing the mixing of freshwater with natural Permian saltwater or saltwater from dissolution of mined rock salt in water softeners or used in the winter. The freshwater end members for the dashed curves are based on fresh ground waters from the Equus Beds area of the High Plains aquifer (Whittemore, 1997, 2004; and data for the Equus Beds Aquifer Mineral Intrusion Study, Young et al., 1998). The saltwater end members for the dashed curves are for saltwaters from the Wellington Formation in the Smoky Hill River valley (Whittemore et al., 1981) and from the saltwater intrusion area in the western Equus Bed aquifer (Young et al., 1998). The two solid curves in fig. 10 represent the mixing of formation brine from the oil fields in McPherson County with freshwater in the Equus Beds aquifer (Whittemore, 2003). Formation brines associated with hydrocarbons in strata not containing rock salt in Kansas have substantially higher bromide/chloride ratios than saltwater primarily derived from the dissolution of rock salt.
Figure 10--Bromide/chloride ratio for Lincolnville area and other waters for comparison.
The untreated and treated wastewater samples collected at the Lincolnville lagoons have substantially greater chloride concentrations and lower bromide/chloride ratios than for the well waters. The source of the additional chloride may be attributed to the dissolution of halite (rock salt) used in conventional water softeners. Many homes in the city use conventional softener units. Saltwater produced from dissolution of rock salt is used to regenerate the exchange medium in the water softeners. The saltwater from the regeneration process is disposed into the sewer system, thereby increasing the chloride concentration of the City wastewater.
If the main source of the chloride concentration in the 2006 samples from the Lincolnville wells was untreated wastewater leaking from sewer lines or from the lagoons, then the bromide/chloride ratios for the ground-water samples would have been lower and most of the points on Figure 8 would have fallen within the mixing zone of freshwater with halite-dissolution brine. In this case, the shallow monitoring wells (open squares, A wells) do not appear to be impacted by mixing with wastewater from the sewage system (bromide/chloride ratio is not low). The deeper monitoring wells (open triangles, B wells) and some of the private wells (black squares) do not show an increase of chloride nor the lower bromide/chloride ratio that would be indicative of rock salt mixing so the wastewater does not appear to be a current source.
Oil-field brine is a ground-water contaminant in many areas of Kansas (Whittemore, 1997, 2003, 2004). The brine points plotted in fig. 10 are from brines collected in McPherson County west of Marion County. The points are plotted on the graph to evaluate potential mixing of oil brines with the shallow ground-water samples. Monitoring well 5A plots between the ground water samples and the brine samples. Sample 5A is a high bromide/chloride sample. Well 5A is at a location where a gasoline spill occurred a number of years ago. The source of the higher chloride concentration for sample 5A relative to the other collected samples is not known. The location of the points for the shallow monitoring wells within the mixing zones for oil brines does not mean that they are impacted by oil brines. Human and animal wastewaters also have Br/Cl ratios within the range shown for the Lincolnville area ground waters as shown in Appendix B from work by Panno et al. (2005).
Evaporation, which concentrates the levels of conservative dissolved solids in the residual water, would increase both chloride and bromide contents without changing the bromide/chloride ratio. For example, evaporation of water used for watering lawns or from farming surrounding the area concentrates dissolved solids in the water that moves downward from land surface to the ground water. Assuming that the rate of concentration increase of bromide and chloride are not substantially different, the bromide/chloride ratio would not be affected in the water. The result would be a shift towards higher chloride concentrations while the bromide/chloride ratio remained in the same general range. This shift could also explain the distribution of points for the domestic well waters on fig. 10.
Boron is an element in compounds that are used in industrial processes and in detergents to facilitate whitening (Vengosh and Keren, 1996). The concentration of boron, as well the isotopic signature, is measurably different between sewage wastewater and non-impacted ground water. Boron isotopes were not used in this study but the concentration of boron was a useful indicator of whether lagoon wastewater or leaking sewer lines might be a current source of contamination. Figure 11 shows the relationship of increasing concentration of boron versus chloride which is indicative of evaporative processes occurring in the area (Seiler et al., 2003). The correlation coefficient and R2 for the relationship of boron and chloride indicate that the boron concentration increase with chloride is statistically significant. This is typical of areas where evapoconcentration occurs. The much lower concentration of boron and chloride for the majority of the wells in relation to the lagoon water suggests that neither the lagoon nor the sewer lines are a current source for the observed chloride and nitrate in the ground water.
Figure 11--Boron and chloride concentration. Boron is often used as a tracer of sewage wastewater. In Linconville the lagoon sample is much higher than observed in most of the monitoring wells suggesting that it is not an immediate and continuing source of contamination.
The boron values for the Post Office well and the sample from Mrs. Holub's well suggests the possibility of sewage waste impact without the effects of water softener salt (see Appendix B). This could result from abandoned septic-system waste gradually migrating to the ground water.
Natural-abundance nitrogen-isotope analysis is frequently used to assist in determining sources of nitrogen to ground water. The isotope analysis involves establishing the ratio of nitrogen-15 (15N) to nitrogen-14 (14N) on the nitrogen in nitrate compared to the ratio observed in the standard, atmospheric nitrogen (air). Comparisons of these values indicate if there is more (positive) or less (negative) 15N in the sample. The values thus indicate whether the sample is enriched (+) or depleted (-) in relation to the standard.
Isotopic values are reported as δ15N in per mil (‰) (Hoefs, 2001):
Figure 12 illustrates the range of δ15N values for various sources of nitrogen and associated processes affecting the 15N abundance (Heaton, 1986). Generally, biological activities use 14N preferentially, resulting in an increased δ15N value in the remaining nitrogen. Previous work has shown that nitrate from commercial fertilizer sources has δ15N values of -2 to +8‰, from soil nitrogen a range of +5 to +7‰, and from animal waste generally greater than +10‰ (Heaton, 1986; Herbel and Spalding 1993). Other information such as dissolved oxygen, salinity, iron, and manganese concentrations, and proximity to potential sources aids in source determination.
Figure 12--Range of δ15N signatures for different sources of nitrogen (Heaton, 1986; Townsend et al., 1994).
Ground water impacted by fertilizer frequently has measurable nitrate-N as well (generally greater than 3 mg/L in Kansas). Because of possible volatilization of anhydrous ammonia when the chemical pH is above 8, and nitrification of ammonium by bacteria, the δ15N values frequently are in the +2 to +8 ‰ range.
Other sources such as human-septic waste or animal waste have δ15N values starting around +5 ‰. Because animal waste has a high ammonia component, the release of the ammonia when the waste is produced causes an immediate enrichment of the δ15N because the lighter ammonia containing 14N is preferentially released by volatilization. As a result, the δ15N of the remaining nitrogen is much higher, in the range of +10 ‰ or more. Nitrate-N values are generally also high (usually more than 10 mg/L) in animal-waste sources.
Nitrogen volatilization also can occur in soils and rocks with carbonate zones. Carbonates can increase the pH of water towards 8.5, which means the water is more basic. In this pH range nitrate can be converted to ammonia gas by a chemical reaction. The lighter δ14N isotope is preferentially released with the gas. The remaining nitrogen becomes enriched with a higher value δ15N.
Another process that can result in an enriched δ15N value is denitrification. In this process, bacteria degrade nitrate to nitrogen gases that are released to the atmosphere. The 14N of the nitrate is preferentially utilized resulting in δ15N enrichment in the remaining nitrate. Signs of possible denitrification are low nitrate values and enriched δ15N values. Table 1 lists the range of δ15N values and the types of sources usually identifiable with the method.
Table 1--Range of Nitrogen-15 and Nitrogen Sources
| δ15N Values | Nitrogen Sources |
|---|---|
| < 8 ‰ | Fertilizer (Nitrate-N usually > 2 mg/L) |
| 8 to 10 ‰ | Mixed sources (Variable range of nitrate-N) |
| > 10 ‰ | Animal waste (Nitrate-N > 10 mg/L); Volatilization or long term nitrification of fertilizer from a spill (Nitrate-N > 10 mg/L); or Denitrification (Nitrate-N < 1 mg/L) |
Figure 13 shows the δ15N values expressed in per mil (‰), versus nitrogen concentration for ground waters in this study. This graph indicates the potential multiple sources of nitrate in the Lincolnville area. The shallow monitoring wells (MW 1-4 A), the Swayze, and Mrs. Holub wells all plot in the animal waste zone of the graph (δ15N > +10 ‰) and nitrate-N concentrations > 10 mg/L. Based on the work done by the KGS at other sites (Townsend et al., 1994; Townsend and Young, 2000), these two indicators strongly support an animal waste source, volatilization enrichment of a source such as ammonium from the waste lagoons, or septic waste sources.
Figure 13. Graph shows the δ15N values expressed in per mil (‰) versus nitrogen concentration. The wells are nitrate-N, the lagoon waters are expressed as total nitrogen (organic N + ammonia + nitrate). Graph indicates possible sources for nitrate in wells.
The Swayze and Mrs. Holub wells both have known animal waste sources located within the vicinity of the wells. Mrs. Holub had indicated the presence of an old latrine and chicken coop on and near her property which may be a delayed source of nitrified ammonium waste. Mr. Swayze had dog pens located on his property which may have been a source of nitrate either from direct migration down the well annulus from surface flow or from leakage of decaying waste matter from a waste pile or isolated waste over time.
Monitoring well 1A is downgradient from the Swayze site by a few hundred feet and may be impacted by the same source. The other monitoring wells have higher nitrate-N, boron, and chloride concentrations and higher bromide/chloride ratios than other wells in town (Appendix A). The boron and chloride and bromide/chloride values suggest the possibility of evapotranspiration enrichment perhaps from lawn watering. The shallow aquifer is the one with high nitrate and higher chloride concentrations. The other wells in the area all have nitrate of less than 10 mg/L. Some of the wells do not have known depths so it is difficult to know whether they are shallow.
The other possible source for high nitrate in the shallow aquifer is the one mentioned previously in the discussion of fig. 9 (nitrate and chloride), that of leakage from the lagoons when they were cleaned out about 15 years ago. Exposure of the wastewater and solids to air could permit rapid nitrification of the ammonium component of the waste to nitrate. Refilling the lagoons would cause an increased head on newly disturbed but compacted material which might permit vertical leakage of an unknown volume of high nitrate to the shallow aquifer. The isotope signature would reflect the volatilization and nitrification enrichment of the wastewater and the nitrate concentration would reflect the impact of the point source of nitrate to the ground water.
The lower boron concentration of the regional ground water would dilute the higher concentration from the lagoon wastewater. The higher chloride concentration of the wastewater would be diluted by the regional ground water but could result in higher overall chloride in the shallow ground water. The bromide/chloride ratio in a mixture of the regional ground water and the wastewater would follow a mixing line between the two types of waters in fig. 10.
Well 3A near the Co-op is very high in nitrate-N and probably reflects the fertilizer activities around the coop. Although the δ15N value is enriched, this may be due to volatilization or nitrification of fertilizer that may have spilled around the site. The wells to the northwest may also be impacted by this type of spill, but it would be hard to differentiate the enriched fertilizer from animal-waste source without either oxygen-18 isotope work on the nitrate or possibly boron isotopes from the fertilizer and animal waste at the Swayze site.
Another possible source for the high nitrate and chloride in the areas would be improperly closed septic systems. The City of Lincolnville has had a sewer system for at least 30 years. What is not known is how the unused septic systems or latrines were closed. If the organic waste from many years of use was present in the soil zone and the structure removed (in the case of an outhouse) the buried waste would be exposed to rain water, which carries a certain amount of oxygen in it. Bacterial degradation of the ammonium ion in the remnant waste or adsorbed on clays in the soil could permit nitrification of the nitrogen to nitrate which would be available for movement. The δ15N signature of the waste would be in the animal-waste zone as is seen from the water samples (fig. 13). The chloride content of septic waste could range from 50 to 100 mg/L or higher, which is observed in many of the wells. If there was evapoconcentration of water at or near the surface, the chloride content could increase and then be reflected in the ground water receiving recharge of this near surface water.
Figure 13 also shows the δ15N enrichment that occurs from the treatment process after wastewater moves from lagoon 1 (entry of anaerobic waste) to lagoon 3. The primary form of nitrogen in the lagoon 3 wastewater is expected to be organic nitrogen. Decomposition of the organic nitrogen can generate ammonium ion. The δ15N enrichment is caused by volatilization of ammonia gas and also possibly some enrichment by bacteria during nitrification, although the resulting nitrate content is very low (< 2 mg/L; Appendix A).
The other wells in the area have nitrate-N values of less than 10 mg/L. Some are near the drinking water limit, particularly the Gutsch and Matz wells. These two houses are located north of shallow MW2A. It may be that whatever is impacting that well also has been pulled into the area of influence of these two domestic wells resulting in increased nitrate concentration. These two wells may be shallower than the reported depths; no logs exist for these wells.
The deeper drilled wells that occur in the lower aquifer (B monitoring wells, Schneider, Coop, Montgomery, Pagenkopf, and Shawmar Drilling) are presumably cased off from the shallower aquifer. These wells all have enriched δ15N values, which might indicate animal waste as a source or mixing with water from the upper aquifer due to poorly cased wells in the area. The boron and bromide/chloride values for the majority of these wells suggest the possibility of evapoconcentration as a source rather than septic waste or lagoon water. The boron values in particular fall in a range that is typical of water not impacted by wastewater as found by Vengosh and Keren (1996) in their study of a wastewater recharge project in Israel. The enriched δ15N values could be due to slow vertical movement of water downward with sufficient time for bacteria to cause denitrification enrichment, which results in lower nitrate values and enriched δ15N values relative to the shallow aquifer water.
The remaining wells, MW 4B, G. Holub, and Svoboda (outside of town wells in farmsteads), Kristek (southwest edge of town near farmed land), Ebaben (northern edge of town), MW3B, St. John's Church, and the Post Office well, all plot in the probable fertilizer source area of the graph (δ15N > +8). These wells all occur in areas near farmed ground or large areas of grass that may have had long term fertilization. The nitrate-N values and chloride values are relatively low indicating that mixing with the upper shallow aquifer is not likely. A likely flow path is movement of surface runoff down the annulus of improperly grouted shallow wells into the deeper aquifer.
Nitrogen-15 natural abundance isotopic methods and other chemical tracers were used to identify sources of nitrate in the City of Lincolnville, Kansas. Several sources are present in the study area. The land use surrounding the city is agricultural, which could provide a source of nitrate either from fertilizer use or from animal waste used as fertilizer. Old, improperly closed septic systems or latrines could provide a multitude of animal-waste sources that would likely impact the shallow aquifer. The Co-op in town is a source of potential fertilizer from past practices in the area. Old chicken coops or animal waste storage from past farming in the city area prior to the city expanding could provide a source of animal waste to the shallow aquifer.
The nitrogen-15 method indicates that human waste from abandoned septic tanks may be a major source in the shallow aquifer. The chloride concentration in the shallow monitoring wells and in one of the domestic wells suggests a mixing of regional ground water with a human or animal waste source.
One possibility that would explain the high nitrate and chloride concentrations and the enriched δ15N would be leaching from the city wastewater lagoons at some point in the past, perhaps after the lagoons were drained for cleaning of solids. However the bromide/chloride ratios would be lower than observed if water softener salt had been used during the earlier period of wastewater treatment. This process would provide a source for high nitrate concentration from conversion of ammonium to nitrate by nitrification and enriched δ15N values because of volatilization and nitrification and also result in higher than background chloride concentrations. Another possibility is the degradation of human waste from abandoned septic systems and latrines or animal waste from small farming situations within the city limits (or prior to the city limit expansion in the area).
The boron and bromide/chloride ratios for the well waters compared to the present-day lagoon waters suggest that leaky sewer lines or leakage from the present lagoons are not a likely major source. The bromide/chloride ratios are significantly higher for the ground water than for the lagoon water indicating that it is unlikely that current lagoon water is the source for the contamination.
Evapoconcentration of water used for watering lawns might contribute to the observed chloride concentrations and the bromide/chloride ratios observed in the shallow aquifer.
The northwest part of the city may be impacted by biological processes utilizing nitrogen from fertilizer spills or applications from the past. The very high concentrations at well 3A and the Swayze well, which is downgradient from the Co-op, in addition to the concentrations at well 1A, also downgradient from the fertilizer Co-op, suggests, but does not prove, that fertilizer may be a major contributor to the contamination in that part of town. The Swayze well is problematic in that there are potential animal sources at that site also. However, the high chloride values are not likely to have occurred only from dog waste. Evapoconcentration of water from lawn watering could also impact the chloride concentration of the shallow aquifer.
Chaffee, P. K., 1988, Effects of water-well construction on temporal variability of ground-water quality in Lincolnville, Marion County, Kansas: Unpubl. M.S. thesis, Department of Civil Engineering, University of Kansas, Lawrence, 171 p.(avail. as Kansas. Geol. Survey, Open-file Rept., 88-26).
Heaton, T. H. E., 1986, Isotopic studies of nitrogen pollution in the hydrosphere and atmosphere--a review: Chemical Geology, v. 59, p. 87-102.
Hem, J. D., 1985, Study and interpretation of the chemical characteristics of natural water: U. S. Geological Survey, Water-Supply Paper 2254, 263 p. [available online]
Herbel, M. J., and Spalding, R. F., 1993, Vadose zone fertilizer-derived nitrate and δ15N extracts: Ground Water, v. 31, no. 3, p. 376-382.
Hatzell, H. H., 1995, Effects of waste-disposal practices on ground-water quality at five poultry (broiler) farms in north-central Florida, 1992-1993: U. S. Geological Survey, Water-Resources Investigations Report 95-4064, 35 p. [available online]
Hoefs, J., 2001, Stable isotope geochemistry, 4th ed.; Springer, 201 p.
McQuillan, D., 2004, Ground-water quality impacts from on-site septic systems: Proceedings, National Onsite Wastewater Recycling Association, 13th Annual Conference, Albuquerque, NM, Nov. p. 7-10, http://rpawwa.org/docs/mcquillan_septic_sys_paper.pdf (verified May 2007).
Mueller, D. K., and Helsel, D. R., 1996, Nutrients in the nations' waters--too much of a good thing?: U.S. Geological Survey, Circular 1136, 24 p. [available online]
O'Connor, H. G.; and Chaffee, P. K., 1983, Geohydrology field trip, Marion County, Kansas, November 18-19, 1983: Kansas Geological Survey, Open-file Report, no. 83-25, 42 p.
Panno, S. V., Hackley, K. C., Hwang, H. H., Breenberg, S., Krapac, I. G., Landsberger, S., and O'Kelly, D. J., 2005, Database for the characterization and identification of the sources of sodium and chloride in natural waters of Illinois: Illinois State Geological Survey, Open File Series 2005-1, 15 p.
Seiler, R. L., Skorupa, J. P., Naftz, D. L., and Nolan, B. T., 2003, Irrigation-induced contamination of water, sediment, and biota in the western United States--synthesis of data from the National Irrigation Water Quality Program: U. S. Geological Survey, Professional Paper 1655, 123 p., Report Version 1.1, released November 2003. [available online]
Thornthwaite, C. W., and Mather, J. R., 1957, Instructions and Tables for Computing Potential Evapotranspiration and the Water Balance: Publications in Climatology, vol. 10, no. 3, Drexel Institute of Technology, Laboratory of Climatology, Philadelphia, Pa., p. 185-310.
Townsend, M. A., Macko, S., Young, D. P., and Sleezer, R. O., 1994, Natural 15N isotopic signatures in groundwater: a cautionary note on interpretation. Kansas Geological Survey, Open-File Report 94-29. 24 p. [available online]
Townsend, M. A., and Young, D. P., 2000, Assessment of nitrate-nitrogen distribution in Kansas Groundwater, 1990-1998: Natural Resources Research, v. 9, no.2, p.125-134.
Vengosh, A., and Keren, R., 1996, Chemical modifications of groundwater contaminated by recharge of treated sewage effluent: Journal of Contaminant Hydrology, v. 23, p. 347-360.
Vocasek, F. and Marks, E. T., 2003, Lincolnville groundwater contamination site (Consent order #00-E-0162), comprehensive investigation progress report: Kansas Department of Health and Environment, 44 p.
Whittemore, D. O., 1997, Geochemical identification of sources of salinity in surface and ground waters in central McPherson County, Kansas: Kansas Geological Survey, Open-file Report 97-78, 25 p. [available online]
Whittemore, D. O., 2003, Geochemical identification of sources of salinity in ground waters of the High Plains aquifer west of the Johnson Oil Field in central McPherson County, Kansas: Kansas Geological Survey, Open-file Report 2004-4, 16 p. [available online]
Whittemore, D. O., 2004, Geochemical Identification of Sources of Salinity in Ground Waters of the High Plains Aquifer South of McPherson, Kansas: Kansas Geological Survey, Open-file Report 2004-62, 21 p. [available online]
Whittemore, D. O., Basel, C. L., Galle, O. K., and Waugh, T. C., 1981, Geochemical identification of saltwater sources in the Smoky Hill River Valley, McPherson, Saline, and Dickinson counties, Kansas: Kansas Geological Survey, Open-file Report 81-6, 78 p.
Young, D. P.; Buddemeier, R. W.; Whittemore, D. O., 1998, Equus beds mineral intrusion project report, FY 1998: Kansas Geological Survey, Open-file Report no. 1998-024, 100 p.
Zeller, D. E., 1968, The stratigraphic succession in Kansas: Kansas Geological Survey, Bulletin 189. [available online]
| Servi-Tech Lab Number |
KGS # | Sample ID | Date Sampled | Date Received | Date Reported | Latitude | Longitude | T-R-Sec (Large to small) | Depth of wells (ft) |
|---|---|---|---|---|---|---|---|---|---|
| 4464 | 060129 | Centre HS | 8/24/2006 | 8/25/2006 | 8/30/06 | 38.52287 | 96.95084 | 17S 4E 35 SE SE SW SE | 100 |
| 4457 | 060127 | COOP Office | 8/23/2006 | 8/25/2006 | 8/29/06 | 38.49563 | 96.96355 | 18S 4E 11 SW SW NE SW | 93 |
| 4549 | 060130 | Ebaben | 8/23/2006 | 8/30/2006 | 8/31/06 | 38.48667 | 96.96414 | 18S 4E 14 NW SW SE SW | 30 |
| 4465 | 060131 | G. Holub | 8/24/2006 | 8/25/2006 | 8/30/06 | 38.51749 | 96.96562 | 18S 4E 02 NW SW NW SW | 60 |
| 4460 | 060132 | Gutsch | 8/23/2006 | 8/25/2006 | 8/29/06 | 38.4968 | 96.96221 | 18S 4E 11 SW SW NE NE | |
| 4458 | 060135 | Mrs. Holub | 8/23/2006 | 8/25/2006 | 8/29/06 | 38.49365 | 96.96214 | 18S 4E 11 SW SW SE SE | |
| 4470 | 060147 | Kristek | 8/24/2006 | 8/25/2006 | 8/30/06 | 38.48995 | 96.96055 | 18S 4E 14 NW NE SW SE SW | 73 |
| 4459 | 060134 | Matz | 8/23/2006 | 8/25/2006 | 8/29/06 | 38.49682 | 96.96138 | 18S 4E 11 SW SE NW NW | |
| 4467 | 060128 | Montgomery | 8/24/2006 | 8/25/2006 | 8/30/06 | 38.49387 | 96.95963 | 18S 4E 11 SW SW NW NE | 104 |
| 4447 | 060136 | MW-01A | 8/23/2006 | 8/25/2006 | 8/30/06 | 38.49684 | 96.96515 | 18S 4E 11 SW SW NW NE | 35 |
| 4452 | 060137 | MW-01B | 8/23/2006 | 8/25/2006 | 8/29/06 | 38.49684 | 96.96515 | 18S 4E 11 SW SW NW NE | 95 |
| 4448 | 060138 | MW-02A | 8/23/2006 | 8/25/2006 | 8/29/06 | 38.4965 | 96.9621 | 18S 4E 11 SW SW NE NE | 28 |
| 4453 | 060139 | MW-02B | 8/23/2006 | 8/25/2006 | 8/29/06 | 38.49652 | 96.96211 | 18S 4E 11 SW SW NE NE | 86 |
| 4449 | 060140 | MW-03A | 8/23/2006 | 8/25/2006 | 8/29/06 | 38.49533 | 96.96346 | 18S 4E 11 SW SW NE SW | 25 |
| 4454 | 060141 | MW-03B | 8/23/2006 | 8/25/2006 | 8/29/06 | 38.49528 | 96.96354 | 18S 4E 11 SW SW NE SW | 92 |
| 4450 | 060142 | MW-04A | 8/23/2006 | 8/25/2006 | 8/29/06 | 38.49383 | 96.96315 | 18S 4E 11 SW SW SE SW | 30 |
| 4455 | 060143 | MW-04B | 8/23/2006 | 8/25/2006 | 8/29/06 | 38.49361 | 96.96316 | 18S 4E 11 SW SW SE SW SE | 86 |
| 4451 | 060144 | MW-05A | 8/23/2006 | 8/25/2006 | 9/1/06 | 38.48356 | 96.96183 | 18S 4E 14 SW NE SW NW SW | 32 |
| 4456 | 060145 | MW-05B | 8/23/2006 | 8/25/2006 | 8/29/06 | 38.49369 | 96.96181 | 18S 4E 11 SW SE SW SW | 88 |
| 4468 | 060133 | Pagenkopf | 8/24/2006 | 8/25/2006 | 8/30/06 | 38.49414 | 96.95922 | 18S 4E 11 SW SE SE SW | 80 |
| 4548 | 060146 | Post Office | 8/24/2006 | 8/30/2006 | 8/31/06 | 38.49306 | 96.96143 | 18S 4E 14 NW NE NW NW | |
| 4463 | 060148 | Schneider | 8/23/2006 | 8/25/2006 | 8/29/06 | 38.46583 | 96.96493 | 18S 4E 23 SW SW SW NE | 90 |
| 4469 | 060149 | Shawmar Drilling | 8/24/2006 | 8/25/2006 | 8/30/06 | 38.48447 | 96.95727 | 18S 4E 14 SE NW NW SW SW | |
| 4462 | 060150 | ST. Johns Church | 8/23/2006 | 8/25/2006 | 8/29/06 | 38.49604 | 96.95997 | 18S 4E 11 SW SE NW SE NE | |
| 4466 | 060151 | Svoboda | 8/24/2006 | 8/25/2006 | 8/30/06 | 38.4819 | 69.96647 | 18S 4E 14 SW SW NW NW | 65 |
| 4461 | 060152 | Swayze | 8/23/2006 | 8/25/2006 | 8/29/06 | 38.49685 | 96.96488 | 18S 4E 11 SW SW NW NE | |
| 060186 | Centre HS storage tank | 11/9/2006 | 102 | ||||||
| 610 | 060190 | Centre HS Lagoon 2 | 11/9/2006 | 11/10/2006 | 11/16/06 | 38.52282 | 96.94984 | 17S 4E 35 SE SE SE SW | 5 |
| 611 | 060187 | Lagoon3 | 11/9/2006 | 11/10/2006 | 11/16/06 | 38.493 | 96.95334 | 18S 4E 14 NE NW NE NE | 5 |
| 612 | 060188 | Lagoon 1 | 11/9/2006 | 11/10/2006 | 11/16/06 | 5 | |||
| 613 | 060189 | Lagoon 2 | 11/9/2006 | 11/10/2006 | 11/16/06 | 5 |
| Servi-Tech Lab Number |
KGS # | Sample ID | Depth estimated (ft) | Electrical Conductivity (µmho/cm) | KGS LAB SPCD (µmho/cm) | pH (units) | δ13C ‰ |
δ15N ‰ |
KGS Nitrate-N mg/L | KGS NO3-UV (mg/L) | Seriv-Tech Ammonia-N (mg/L) |
|---|---|---|---|---|---|---|---|---|---|---|---|
| 4464 | 060129 | Centre HS | 722 | 717 | 7.7 | -19.9 | 16.7 | 2.930 | 13.0 | ||
| 4457 | 060127 | COOP OFFICE | 890 | 894 | 7.5 | -17.2 | 13.4 | 3.300 | 14.6 | ||
| 4549 | 060130 | Ebaben | 30 | 1200 | 1,262 | 7.5 | -19.1 | 6.7 | 6.400 | 28.4 | |
| 4465 | 060131 | G. Holub | 60 | 1960 | 1,950 | 7.5 | -18.8 | 6.3 | 2.400 | 10.6 | |
| 4460 | 060132 | Gutsch | 80? | 2140 | 2,135 | 7.4 | -19.7 | 16.0 | 10.300 | 45.6 | |
| 4458 | 060135 | Mrs. HOLUB | 30 | 1340 | 1,327 | 7.1 | -19.9 | 20.3 | 36.300 | 160.8 | |
| 4470 | 060147 | Kristek | 1080 | 1,068 | 7.4 | -19.6 | 7.3 | 5.500 | 24.4 | ||
| 4459 | 060134 | Matz | 30 | 1110 | 1,098 | 7.4 | -21.4 | 14.3 | 8.300 | 36.8 | |
| 4467 | 060128 | Montgomery | 919 | 921 | 7.4 | -19.0 | 18.2 | 4.700 | 20.8 | ||
| 4447 | 060136 | MW-01A | 2010 | 1,929 | 7.1 | -21.2 | 18.2 | 62.400 | 276.4 | ||
| 4452 | 060137 | MW-01B | 789 | 791 | 7.4 | -19.0 | 21.7 | 3.340 | 14.8 | ||
| 4448 | 060138 | MW-02A | 2080 | 1,785 | 7.2 | -20.0 | 19.2 | 31.200 | 138.2 | ||
| 4453 | 060139 | MW-02B | 738 | 737 | 7.3 | -18.7 | 11.2 | 2.730 | 12.1 | ||
| 4449 | 060140 | MW-03A | 2050 | 2,111 | 7.2 | -19.8 | 25.3 | 66.800 | 295.9 | ||
| 4454 | 060141 | MW-03B | 744 | 744 | 7.5 | -17.2 | 3.3 | 2.460 | 10.9 | ||
| 4450 | 060142 | MW-04A | 1880 | 1,662 | 7.2 | -17.8 | 20.4 | 25.900 | 114.7 | ||
| 4455 | 060143 | MW-04B | 804 | 810 | 7.4 | -18.8 | 6.6 | 2.870 | 12.7 | ||
| 4451 | 060144 | MW-05A | 2870 | 2,823 | 7 | -21.5 | 11.0 | 1.200 | 5.3 | < 0.2 | |
| 4456 | 060145 | MW-05B | 1250 | 1,243 | 7.2 | -19.6 | 17.8 | 6.900 | 30.6 | ||
| 4468 | 060133 | Pagenkopf | 1070 | 1,067 | 7.3 | -21.6 | 20.0 | 3.400 | 15.1 | ||
| 4548 | 060146 | Post Office | 90 | 1200 | 1,373 | 7 | -20.9 | 3.9 | 4.000 | 17.7 | |
| 4463 | 060148 | Schneider | 838 | 828 | 7.5 | -18.4 | 10.7 | 3.600 | 15.9 | ||
| 4469 | 060149 | Shawmar DRILLING | 70 | 761 | 755 | 7.5 | -18.7 | 16.9 | 2.390 | 10.6 | |
| 4462 | 060150 | ST. Johns Church | 68 | 748 | 741 | 7.4 | -20.1 | 7.5 | 3.660 | 16.2 | |
| 4466 | 060151 | Svoboda | 1160 | 1,147 | 7.6 | -19.4 | 6.1 | 3.600 | 15.9 | ||
| 4461 | 060152 | Swayze | 30 | 2080 | 2,105 | 7.3 | -20.1 | 25.5 | 75.000 | 332.3 | |
| 060186 | Centre HS storage tank | 833 | 833 | 0.835 | 3.7 | ||||||
| 610 | 060190 | Centre HS Lagoon 2 | 1920 | 1920 | -10.9 | 2.3 | 2.283 | 10.1 | < 10 | ||
| 611 | 060187 | Lagoon3 | 1630 | 1630 | 7.9 | -16.9 | 13.7 | 1.201 | 5.3 | < 10 | |
| 612 | 060188 | Lagoon 1 | 1630 | 1630 | -15.3 | 1.8 | 1.651 | 7.3 | < 10 | ||
| 613 | 060189 | Lagoon 2 | 1590 | 1590 | -15.7 | 2.2 | 1.400 | 6.2 | < 10 |
| Servi-TechLab Number | KGS # | Sample ID | Servi-Tech Total Kjeldahl Nitrogen (mg/L) | Servi-Tech Organic Nitrogen (mg/L) | Servi-Tech Total Nitrogen (mg/L) | Chloride (mg/L) | Fluoride (mg/L) | KGS Sulfate (mg/L) | Bicarbonate (mg/L) | Carbonate (mg/L) | Total Alkalinity (mg/L) |
|---|---|---|---|---|---|---|---|---|---|---|---|
| 4464 | 060129 | Centre HS | 19 | 0.43 | 24 | 400 | < 10 | 330 | |||
| 4457 | 060127 | COOP Office | 19 | < 1 | 132 | 370 | < 10 | 310 | |||
| 4549 | 060130 | Ebaben | 39 | < 1 | 240 | 350 | < 10 | 290 | |||
| 4465 | 060131 | G. Holub | 110 | 1 | 420 | 380 | < 10 | 310 | |||
| 4460 | 060132 | Gutsch | 61 | < 1 | 780 | 420 | < 10 | 340 | |||
| 4458 | 060135 | Mrs. Holub | 28 | < 1 | 108 | 500 | < 10 | 410 | |||
| 4470 | 060147 | Kristek | 33 | < 1 | 165 | 380 | < 10 | 310 | |||
| 4459 | 060134 | Matz | 48 | < 1 | 99 | 440 | < 10 | 360 | |||
| 4467 | 060128 | Montgomery | 28 | < 1 | 39 | 480 | < 10 | 390 | |||
| 4447 | 060136 | MW-01A | 130 | < 1 | 183 | 500 | < 10 | 410 | |||
| 4452 | 060137 | MW-01B | 29 | 0.33 | 90 | 370 | < 10 | 310 | |||
| 4448 | 060138 | MW-02A | 150 | < 1 | 480 | 360 | < 10 | 290 | |||
| 4453 | 060139 | MW-02B | 14 | 0.31 | 75 | 380 | < 10 | 310 | |||
| 4449 | 060140 | MW-03A | 150 | < 1 | 129 | 520 | < 10 | 430 | |||
| 4454 | 060141 | MW-03B | 12 | 0.33 | 90 | 380 | < 10 | 310 | |||
| 4450 | 060142 | MW-04A | 140 | < 1 | 213 | 530 | < 10 | 430 | |||
| 4455 | 060143 | MW-04B | 15 | 0.33 | 126 | 370 | < 10 | 310 | |||
| 4451 | 060144 | MW-05A | 580 | < 1 | 150 | 620 | < 10 | 510 | |||
| 4456 | 060145 | MW-05B | 59 | < 1 | 138 | 500 | < 10 | 410 | |||
| 4468 | 060133 | Pagenkopf | 45 | < 1 | 57 | 530 | < 10 | 430 | |||
| 4548 | 060146 | Post Office | 63 | < 1 | 84 | 460 | < 10 | 370 | |||
| 4463 | 060148 | Schneider | 27 | < 1 | 72 | 390 | < 10 | 320 | |||
| 4469 | 060149 | Shawmar Drilling | 20 | 0.3 | 30 | 430 | < 10 | 350 | |||
| 4462 | 060150 | ST. Johns Church | 13 | 0.28 | 54 | 390 | < 10 | 320 | |||
| 4466 | 060151 | Svoboda | 36 | < 1 | 231 | 380 | < 10 | 310 | |||
| 4461 | 060152 | Swayze | 120 | < 1 | 192 | 490 | < 10 | 410 | |||
| 060186 | Centre HS storage tank | 18.2 | 25 | 412 | |||||||
| 610 | 060190 | Centre HS Lagoon 2 | 20 | 20 | 21 | 473 | 13.4 | 300 | 54 | 330 | |
| 611 | 060187 | Lagoon3 | 19 | 13 | 20 | 271 | < 1 | 130 | 510 | < 10 | 420 |
| 612 | 060188 | Lagoon 1 | 14 | 14 | 15 | 296 | 147 | 330 | 42 | 340 | |
| 613 | 060189 | Lagoon 2 | 11 | 11 | 11 | 311 | 152 | 220 | 59 | 280 |
| Servi-Tech Lab Number |
KGS # | Sample ID | Dissolved Calcium (mg/L) | Dissolved Magnesium (mg/L) | Dissolved Potassium (mg/L) | Dissolved Sodium (mg/L) | PO4 mg/L | Cl mg/L | NO3-UV mg/L | NO3N mg/L |
|---|---|---|---|---|---|---|---|---|---|---|
| 4464 | 060129 | Centre HS | 100 | 39 | 2 | 22 | 19.5 | 12.9 | 2.9 | |
| 4457 | 060127 | COOP Office | 140 | 43 | 2 | 25 | 17.8 | 13.4 | 3.0 | |
| 4549 | 060130 | Ebaben | 160 | 53 | 3 | 40 | 44.9 | 31.3 | 7.1 | |
| 4465 | 060131 | G. Holub | 57 | 13 | 1 | 360 | 140 | 9.2 | 2.1 | |
| 4460 | 060132 | Gutsch | 430 | 52 | 3 | 97 | 74.9 | 53.0 | 12.0 | |
| 4458 | 060135 | Mrs. Holub | 150 | 42 | 2 | 87 | 31.9 | 182 | 41.1 | |
| 4470 | 060147 | Kristek | 130 | 46 | 4 | 41 | 39.0 | 27.3 | 6.2 | |
| 4459 | 060134 | Matz | 120 | 41 | 2 | 88 | 58.0 | 41.6 | 9.4 | |
| 4467 | 060128 | Montgomery | 110 | 42 | 1 | 28 | 31.6 | 22.4 | 5.1 | |
| 4447 | 060136 | MW-01A | 210 | 60 | 2 | 150 | 153 | 295 | 66.6 | |
| 4452 | 060137 | MW-01B | 110 | 39 | 3 | 25 | 29.4 | 15.2 | 3.4 | |
| 4448 | 060138 | MW-02A | 240 | 93 | 4 | 110 | 156 | 150 | 33.8 | |
| 4453 | 060139 | MW-02B | 96 | 39 | 2 | 21 | 14.6 | 12.6 | 2.8 | |
| 4449 | 060140 | MW-03A | 190 | 59 | 3 | 180 | 187 | 343 | 77.5 | |
| 4454 | 060141 | MW-03B | 100 | 39 | 2 | 18 | 13.2 | 11.7 | 2.6 | |
| 4450 | 060142 | MW-04A | 200 | 70 | 3 | 160 | 189 | 129 | 29.2 | |
| 4455 | 060143 | MW-04B | 120 | 43 | 2 | 22 | 15.5 | 14.2 | 3.2 | |
| 4451 | 060144 | MW-05A | 260 | 110 | 4 | 270 | 608 | 5.6 | 1.3 | |
| 4456 | 060145 | MW-05B | 140 | 51 | 3 | 93 | 71.5 | 33.2 | 7.5 | |
| 4468 | 060133 | Pagenkopf | 110 | 46 | 3 | 68 | 53.9 | 15.6 | 3.5 | |
| 4548 | 060146 | Post Office | 39 | 38 | 2 | 160 | 79.7 | 20.4 | 4.6 | |
| 4463 | 060148 | Schneider | 110 | 42 | 2 | 26 | 30.0 | 15.8 | 3.6 | |
| 4469 | 060149 | Shawmar Drilling | 100 | 45 | 3 | 25 | 20.5 | 11.2 | 2.5 | |
| 4462 | 060150 | ST. Johns Church | 100 | 43 | 3 | 22 | 13.7 | 15.7 | 3.5 | |
| 4466 | 060151 | Svoboda | 150 | 59 | 3 | 25 | 42.2 | 15.5 | 3.5 | |
| 4461 | 060152 | Swayze | 240 | 68 | 3 | 160 | 150 | 325 | 73.4 | |
| 060186 | Centre HS storage tank | 89 | 35.0 | 1.1 | 20.0 | 0.099 | 18.2 | |||
| 610 | 060190 | Centre HS Lagoon 2 | 473 | |||||||
| 611 | 060187 | Lagoon3 | 99 | 44 | 12 | 190 | 271 | |||
| 612 | 060188 | Lagoon 1 | 0.000 | 296 | ||||||
| 613 | 060189 | Lagoon 2 | 0.000 | 311 |
| Servi-Tech Lab Number |
KGS # | Sample ID | Uncorr. Br mg/L | Corr. Br mg/L | I-t mg/L | IO3 mg/L | Br/Cl * 10000 | KGS Boron mg/L |
|---|---|---|---|---|---|---|---|---|
| 4464 | 060129 | Centre HS | 0.028 | 0.028 | 0.0032 | 0.0094 | 14.2377 | 0.0311 |
| 4457 | 060127 | COOP Office | 0.098 | 0.098 | 0.0035 | 0.0025 | 54.8222 | 0.0659 |
| 4549 | 060130 | Ebaben | 0.205 | 0.202 | 0.0043 | 0.0053 | 45.0445 | 0.1110 |
| 4465 | 060131 | G. Holub | 0.569 | 0.550 | 0.0039 | 0.0059 | 39.2658 | 0.1340 |
| 4460 | 060132 | Gutsch | 0.319 | 0.319 | 0.0061 | 0.0047 | 42.6467 | 0.1806 |
| 4458 | 060135 | Mrs. Holub | 0.205 | 0.205 | 0.0157 | 0.0070 | 64.2261 | 0.3184 |
| 4470 | 060147 | Kristek | 0.170 | 0.170 | 0.0027 | 0.0004 | 43.4713 | 0.0609 |
| 4459 | 060134 | Matz | 0.245 | 0.245 | 0.0080 | 0.0039 | 42.1603 | 0.0531 |
| 4467 | 060128 | Montgomery | 0.144 | 0.144 | 0.0167 | 0.0007 | 45.6523 | 0.0461 |
| 4447 | 060136 | MW-01A | 0.724 | 0.724 | 0.0321 | 0.0155 | 47.2712 | 0.1466 |
| 4452 | 060137 | MW-01B | 0.123 | 0.123 | 0.0036 | 0.0029 | 41.8376 | 0.0498 |
| 4448 | 060138 | MW-02A | 0.629 | 0.618 | 0.0212 | 0.0055 | 39.6930 | 0.1161 |
| 4453 | 060139 | MW-02B | 0.080 | 0.080 | 0.0042 | 0.0036 | 54.7145 | 0.0463 |
| 4449 | 060140 | MW-03A | 0.516 | 0.516 | 0.1918 | 0.0157 | 27.5975 | 0.1464 |
| 4454 | 060141 | MW-03B | 0.077 | 0.077 | 0.0033 | 0.0032 | 58.3951 | 0.0484 |
| 4450 | 060142 | MW-04A | 0.704 | 0.704 | 0.0199 | 0.0077 | 37.1689 | 0.0648 |
| 4455 | 060143 | MW-04B | 0.078 | 0.078 | 0.0034 | 0.0038 | 50.1876 | 0.0529 |
| 4451 | 060144 | MW-05A | 4.229 | 4.229 | 0.0761 | 0.0082 | 69.5954 | 0.1190 |
| 4456 | 060145 | MW-05B | 0.322 | 0.322 | 0.0145 | 0.0061 | 45.0795 | 0.0993 |
| 4468 | 060133 | Pagenkopf | 0.212 | 0.212 | 0.0114 | 0.0036 | 39.2673 | 0.0930 |
| 4548 | 060146 | Post Office | 0.424 | 0.424 | 0.0171 | 0.0074 | 53.1990 | 0.5801 |
| 4463 | 060148 | Schneider | 0.118 | 0.118 | 0.0046 | 0.0021 | 39.3078 | 0.0528 |
| 4469 | 060149 | Shawmar Drilling | 0.091 | 0.091 | 0.0240 | 0.0159 | 44.2543 | 0.0464 |
| 4462 | 060150 | ST. Johns Church | 0.077 | 0.077 | 0.0043 | 0.0024 | 56.3696 | 0.0443 |
| 4466 | 060151 | Svoboda | 0.178 | 0.178 | 0.0030 | 0.0020 | 42.1540 | 0.1538 |
| 4461 | 060152 | Swayze | 0.654 | 0.654 | 0.0228 | 0.0146 | 43.4953 | 0.1449 |
| 060186 | Centre HS storage tank | 0.018 | 0.018 | 3.60 | 0.000 | 9.7355 | 0.035 | |
| 610 | 060190 | Centre HS Lagoon 2 | 0.330 | 0.330 | 14.40 | 0.000 | 6.9621 | |
| 611 | 060187 | Lagoon3 | 0.344 | 0.344 | 15.60 | 0.000 | 12.7206 | 0.44 |
| 612 | 060188 | Lagoon 1 | 0.306 | 0.306 | 20.10 | 10.3149 | ||
| 613 | 060189 | Lagoon 2 | 0.228 | 0.228 | 27.20 | 7.3275 |
| Source | Chloride (mg/L) |
Br (mg/L) |
Br/Cl x 10000 | Boron (mg/L) |
Nitrate-N (mg/L) |
NH4-N (mg/L) |
Sodium (mg/L) |
|---|---|---|---|---|---|---|---|
| Septic Waste | 334 | 0.15 | 4.491017964 | 0.52 | 6.18 | 18.2 | 231 |
| Animal Waste (cattle) | 1028 | 0.88 | 8.560311284 | 3.08 | 1486 | 535 | |
| Pristine GW | 5.4 | 0.055 | 101.8518519 | 0.5 | 0.31 | 40 | |
| Field-tile Agricultural Drainage Water |
19 | 0.021 | 11.05263158 | 0.02 | 6.58 | 0.18 | 6.9 |
| Rock Salt | 217 | 0.101 | 4.65437788 | 0.07 | 6.66 | 0.01 | 99 |
| Precipitation | 0.2 | 0.004 | 200 | 0.44 | 0.39 | 0.2 |
Kansas Geological Survey, Geohydrology
Placed online Nov. 6, 2008
Comments to webadmin@kgs.ku.edu
The URL for this page is http://www.kgs.ku.edu/Hydro/Publications/2007/OFR07_13/index.html