Kansas Geological Survey, Open-file Report 2004-4
by
Donald O. Whittemore
Kansas Geological Survey
KGS Open File Report 2004-4
for the
Kansas Corporation Commission
and
National Cooperative Refinery Association
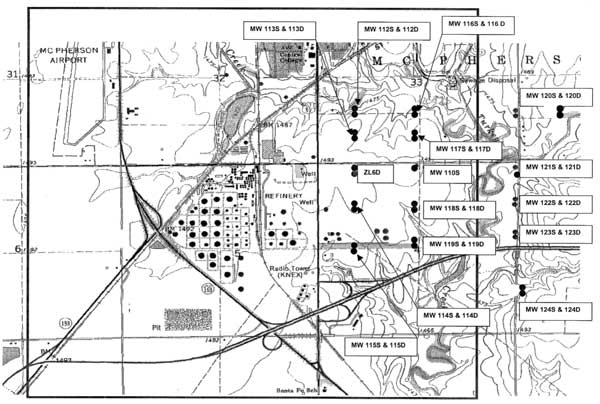
Saline ground water in the Equus Beds area of the High Plains aquifer (Equus Beds aquifer) to the south of McPherson, Kansas, is becoming of increasing concern. The saline ground water is migrating in an east to west direction from the general area of the Johnson oil field. The chloride concentration of local ground water has been increasing and is affecting the quality of water produced from domestic wells and production wells of National Cooperative Refinery Association (NCRA). The Kansas Corporation Commission (KCC) and NCRA (represented by Wilson & Company, Inc.) requested that the Kansas Geological Survey (KGS) evaluate the source of the salinity in samples of ground water from new monitoring wells (installed in 2003) between the oil field and the refinery. The results will be used to determine the approach needed to intercept the saline ground water and prevent it from reaching the refinery property. The study area is includes parts of sections 33 and 34, T. 19 S., R. 3 W., and portions of sections 3, 4, and 5, T. 20 S., R. 3 W. (Figure 1).
Figure 1. Location of monitoring wells east of the National Cooperative Refinery Association facility and south of McPherson. A larger version of this figure is available.
In 1997, the Kansas Department of Health and Environment (KDHE) and Groundwater Management District No. 2 (GMD2) requested that the KGS determine the sources of ground water salinity in the vicinity of the municipal landfill located southeast of McPherson. The KGS conducted the study for NCRA, the McPherson Board of Public Utilities, and GMD2 in cooperation with KDHE (Whittemore, 1997). Four sources of salinity were considered as possible contributors to the high chloride content of the ground waters: the landfill, the Johnson oil field to the east of the landfill, treated wastewater in Dry Turkey Creek, and the Permian bedrock underlying the Equus Beds aquifer. The study concluded that the primary source of chloride contaminating the ground waters of the Equus Beds aquifer in the landfill area was oil-field brine. The KGS found that oil-brine contamination added from nearly 100 to over 2,700 mg/L of dissolved chloride to the well waters sampled. Increases in the chloride content of ground waters immediately surrounding the north, south, and west sides of the landfill that could be attributed to landfill leachate appeared to have been less than 100 or 200 mg/L.
In 2000, NCRA requested additional assistance in evaluating the source of salinity in the ground waters of the refinery area. NCRA collected samples from multiple wells and the KGS performed the chemical analysis, interpreted the results, and communicated the findings to NCRA. The data for the samples collected in 2000 from the east side of the refinery are included in the evaluation for this report. Sampling was performed again in 2003. Two of the samples collected in 2000 are from monitoring wells that are near the new monitoring wells sampled in 2003.
Sample Collection
A representative of KCC collected water samples from NCRA monitoring wells in March of 2003. At least three casing volumes were purged prior to sampling using a variable speed low-flow submersible pump in shallow wells and air lift methods in deep wells. The representative of KCC also collected a sample of oil brine from a saltwater disposal facility in the Johnson oil field. The oil brine sample was collected using a bailer. All samples were placed in polyethylene bottles and sent for overnight delivery by Federal Express shipping to the KGS. Sample type and collection information is summarized in Table 1.
Table 1. Sample type, location, and collection information for ground waters and oil brines obtained for this study and earlier investigations in the McPherson area and analyzed by the Kansas Geological Survey.
| Sample identification |
Location | Screened interval, ft |
Collection date |
Collector name and agency |
|---|---|---|---|---|
| Ground waters sampled in 2003 | ||||
| WW 8 | 20-03W-5AAD | 118-158 | 3/14/03 | Jeff Klock, KCC |
| MW 110S | 20-03W-04BAA | 95-115 | 3/17/03 | Jeff Klock, KCC |
| MW 113S | 19-03W-33CCD | 105-120 | 3/17/03 | Jeff Klock, KCC |
| MW 113D | 19-03W-33CCD | 144-164 | 3/14/03 | Jeff Klock, KCC |
| MW 115S | 20-03W-04CBA | 125-140 | 3/14/03 | Jeff Klock, KCC |
| MW 115D | 20-03W-04CBA | 175-195 | 3/14/03 | Jeff Klock, KCC |
| MW 117D | 19-03W-33CDA | 134-154 | 3/14/03 | Jeff Klock, KCC |
| MW 118S | 20-03W-04BAD | 93-113 | 3/17/03 | Jeff Klock, KCC |
| MW 118D | 20-03W-04BAD | 147.5-167.5 | 3/14/03 | Jeff Klock, KCC |
| MW120S | 19-03W-34CBC | 55-75 | 3/14/03 | Jeff Klock, KCC |
| MW 120D | 19-03W-34CBC | 91-111 | 3/14/03 | Jeff Klock, KCC |
| MW 121S | 20-03W-04AAA | 50-70 | 3/14/03 | Jeff Klock, KCC |
| MW 121D | 20-03W-04AAA | 77.5-97.5 | 3/14/03 | Jeff Klock, KCC |
| MW 123S | 20-03W-04ADD | 55-75 | 3/14/03 | Jeff Klock, KCC |
| MW 123D | 20-03W-04ADD | 105-125 | 3/14/03 | Jeff Klock, KCC |
| MW ZL6D | 20-03W-04BBA | 140-160 | 3/14/03 | Jeff Klock, KCC |
| Ground waters sampled in 2000 | ||||
| 3D (WW 3) | 20-03W-05AAA | 115-160 | 3/15/00 | Kurt Shobe, NCRA |
| 8D (WW 8) | 20-03W-05AAD | 118-158 | 3/15/00 | Kurt Shobe, NCRA |
| MW 110D | 20-03W-04BAB | 136-156 | 3/15/00 | Kurt Shobe, NCRA |
| MW ZL-6 | 20-03W-04BBA | 80-95 | 3/15/00 | Kurt Shobe, NCRA |
| Oil-field brines sampled in 2003 and earlier dates | ||||
| Johnson B-2 SWD | 19-03W-35CCC | 3/14/03 | Jeff Klock, KCC | |
| Johnson oil field | 19-03W-35C | 9/25/97 | Doug Louis, KCC | |
| Johnson oil field | 19-03W-35C | 10/2/97 | Don Koci, GMD2 | |
| Johnson oil field | 20-03W-02CD | 6/3/83 | KGS | |
| Ritz-Canton oil field | 19S-02W-15CD | 12/2/97 | Bill Johnson, KCC | |
| Ritz-Canton oil field | 19S-02W-15CD | 6/3/83 | KGS | |
Sample Analysis
The water and brine samples were filtered through 0.45 μm membrane filter paper before analysis. Specific conductance was measured to estimate chloride concentrations and determine dilution factors for the optimum concentration range of the analytical method. Chloride, sulfate, bromide, total inorganic iodine, and iodate concentrations were determined using automated colorimetric methods on a Technicon AutoAnalyzer II, except for the sulfate content of the brine sample, which was measured by a turbidimetric procedure. The chloride concentration was corrected for the presence of bromide. Total inorganic iodine and iodate concentrations were determined and used in the correction of apparent bromide to actual bromide. The estimated maximum errors in the chloride, sulfate, and bromide determinations are 3%, 4%, and 5% respectively. The error estimates are based on data periodically collected for samples spiked with standards and results from participation in the standard reference water program of the U.S. Geological Survey. The estimated error for inorganic iodine is about ±5%.
Laboratory information and chemical data for the ground-water samples collected in 2000 and 2003 are listed in Table 2. Oil brine samples collected by KCC and KGS staff from the Johnson oil field and the Ritz-Canton oil field farther to the east, and analyzed at the KGS, are included in Table 2.
Table 2. Chemical data and mass constituent ratios for samples listed in Table 1 and analyzed by the Kansas Geological Survey.
| Sample identification |
Sample date |
KGS lab no. |
Sp.C., μS/cm |
SO4, mg/L |
Cl, mg/L | Br, mg/L | Cl, mg/L |
Br/Cl x 104 | SO4/Cl | I/Cl x 106 |
|---|---|---|---|---|---|---|---|---|---|---|
| Ground waters sampled in 2003 | ||||||||||
| WW 8 | 3/14/03 | 030047 | 3840 | 48.6 | 1086 | 4.31 | 0.0137 | 39.7 | 0.0447 | 12.6 |
| MW 110S | 3/17/03 | 030048 | 1740 | 47.6 | 387 | 0.83 | 0.0155 | 21.4 | 0.123 | 40.1 |
| MW 113S | 3/17/03 | 030041 | 1140 | 67.3 | 173 | 0.31 | 0.0084 | 17.7 | 0.389 | 48.6 |
| MW 113D | 3/14/03 | 030040 | 6700 | 29.6 | 2256 | 9.13 | 0.0131 | 40.5 | 0.0131 | 5.8 |
| MW 115S | 3/14/03 | 030043 | 768 | 24.1 | 86.9 | 0.14 | 0.0087 | 16.0 | 0.277 | 100 |
| MW 115D | 3/14/03 | 030044 | 666 | 21.3 | 66.2 | 0.13 | 0.0074 | 19.2 | 0.322 | 112 |
| MW 117D | 3/14/03 | 030037 | 10580 | 47.7 | 3355 | 13.6 | 0.0117 | 40.4 | 0.0142 | 3.5 |
| MW 118S | 3/17/03 | 030039 | 1210 | 65.2 | 196 | 0.30 | 0.0104 | 15.4 | 0.333 | 53.1 |
| MW 118D | 3/14/03 | 030038 | 11190 | 70.7 | 3555 | 14.1 | 0.0228 | 39.6 | 0.0199 | 6.4 |
| MW 120S | 3/14/03 | 030031 | 2100 | 42.2 | 427 | 1.47 | 0.0448 | 34.3 | 0.0987 | 105 |
| MW 120D | 3/14/03 | 030032 | 5260 | 119 | 1522 | 5.56 | 0.172 | 36.5 | 0.0782 | 113 |
| MW121S | 3/14/03 | 030033 | 1130 | 31.7 | 147 | 0.50 | 0.176 | 33.9 | 0.216 | 1200 |
| MW 121D | 3/14/03 | 030034 | 5020 | 137 | 1356 | 4.57 | 1.94 | 33.7 | 0.101 | 1430 |
| MW 123S | 3/14/03 | 030035 | 3260 | 30.7 | 898 | 3.47 | 0.0093 | 38.6 | 0.0342 | 10.4 |
| MW 123D | 3/14/03 | 030036 | 25300 | 43.5 | 8874 | 36.0 | 0.0204 | 40.6 | 0.00490 | 2.3 |
| MW ZL6D | 3/14/03 | 030042 | 7160 | 39.6 | 2275 | 8.79 | 0.0099 | 38.6 | 0.0174 | 4.4 |
| Ground waters sampled in 2000 | ||||||||||
| 3D (WW 3) | 3/15/00 | 000049 | 1370 | 46.7 | 238 | 0.70 | 0.0860 | 29.5 | 0.196 | 361 |
| 8D (WW 8) | 3/15/00 | 000050 | 2080 | 35.5 | 484 | 1.89 | 0.0251 | 39.0 | 0.0733 | 51.9 |
| MW 110D | 3/15/00 | 000045 | 2080 | 45.2 | 476 | 1.88 | 0.0147 | 39.5 | 0.0950 | 30.9 |
| MW ZL-6 | 3/15/00 | 000057 | 1190 | 35.9 | 185 | 0.37 | 0.0149 | 20.0 | 0.194 | 80.5 |
| Oil-field brines sampled in 2003 and earlier dates | ||||||||||
| Johnson B-2 SWD | 3/14/03 | 030045 | 183900 | 69.6 | 103000 | 476 | 10.5 | 46.2 | 0.000676 | 102 |
| Johnson oil field | 10/2/97 | 970421 | 181000 | 71.8 | 105000 | 475 | 4.50 | 45.3 | 0.000684 | 42.9 |
| Johnson oil field | 9/25/97 | 970412 | 173900 | 75.9 | 101500 | 457 | 10.1 | 45.0 | 0.000748 | 99.9 |
| Johnson oil field | 6/3/83 | 830275 | 177000 | 2 | 78520 | 344 | 9.8 | 43.8 | 0.000025 | 125 |
| Ritz-Canton oil field | 12/2/97 | 970517 | 146700 | <17 | 66200 | 262 | 7.31 | 38.6 | <0.0003 | 110 |
| Ritz-Canton oil field | 6/3/83 | 830273 | 155000 | 2.3 | 62770 | 242 | 7.2 | 38.6 | 0.000037 | 115 |
Unconsolidated sediments, including clay, silt, sand, and gravel, primarily of Quaternary age underlie the study area. The saturated sediments compose part of the Equus Beds aquifer. The bedrock underlying the unconsolidated sediments is the upper part of the Permian Wellington Formation, which consists of shale and thin beds of limestone, dolomite, siltstone, gypsum (CaSO4 • 2H2O), and anhydrite (CaSO4). Although most of the Wellington shale is gray and bluish-gray, some beds are maroon and green near the top of the formation. The Hutchinson Salt Member occurs in the middle of the Wellington Formation and comprises primarily rock salt with lesser amounts of shale and anhydrite (Williams and Lohman, 1949; Leonard and Kleinschmidt, 1976). The Hutchinson Salt Member thins in an easterly direction in McPherson County. Part of this is due to the removal of the salt during dissolution by ground water and part because the original thickness thins across the county. The eastern margin of the "lost-circulation zone" or "saltwater aquifer" of the Wellington Formation formed by dissolution lies a few miles to the west of the study area (Leonard and Kleinschmidt, 1976; Gogel, 1981). Gogel (1981) indicated that some subsurface salt remains in the main body of the Hutchinson Salt Member a couple miles to the northwest of the study area and in a small isolated area a few miles to the east. Thus, thin beds of salt could possibly still exist at depth in the bedrock below the study area.
The bedrock surface in the study area slopes to the west. The depth to bedrock ranges from 62 feet on the east-central side of Sec. 34, T. 19 S., R. 3 W. (the west side of the Johnson oil field), to approximately 160-170 feet along the east side Sec 5, T. 20 S., R. 3 W. The land surface generally slopes to the west from the Johnson oil field to Dry Turkey Creek within the study area, and then rises gently to the east side of the NCRA refinery (based on the U.S. Geological Survey topographic quadrangle). The elevations at the county road intersections at the northeast comer of Sections 3, 4, and 5, T. 20 S., R. 3 W., are 1498, 1467, and 1493 feet above sea level, respectively. Depths to bedrock are based on a review of litho logic logs associated with well drilling activities. In the general study area, lithologic logs indicate that the slope of the bedrock surface is greater about 1.5 miles to the west of the Johnson oil field than immediately to the west of the oil field. The Equus Beds aquifer is much thicker to the west due to the presence of the ancient McPherson channel.
Maps of the water-level surface in the aquifer for the region show a generally westward slope in the study area. The water-table divide between ground-water flow to the Smoky Hill River valley and to the Little Arkansas River valley is south of McPherson (Williams and Lohman, 1949; Leonard and Kleinschmidt, 1976; Gogel, 1981). Comparison of depths to water and to bedrock indicate that the saturated thickness of the Equus Beds aquifer ranges from about 10 feet just to the west of the Johnson oil field to approximately 80 feet along the east side of the NCRA refinery. The saturated thickness in the study area is thinner than existed before development of the aquifer for ground-water supply (based on comparison with water levels in Williams and Lohman, 1949).
The sources contributing to chloride in the ground waters were identified using the geochemical methods of Whittemore (1984, 1988, 1995). These methods primarily include plots of the constituent mass ratios bromide/chloride and sulfate/chloride versus chloride concentration, and points for the water sample data and curves for the mixing of different source waters. Each mixing curve is generated using an algebraic equation for conservative mixing of two end-member waters. Conservative mixing refers to the simple mixing of waters without chemical reactions, such as mineral precipitation or adsorption, which could alter the concentrations of one or both of the constituents. The intersection of two mixing curves can be determined graphically or by solving the two algebraic equations simultaneously. The bromide/chloride ratio is multiplied by 10,000 for graphical display to give numbers that range from about one upwards (the lowest mass ratios are near 0.0001 for halite or rock salt dissolution). Logarithmic scales are used in the graphs because they produce a more even distribution (separation) of points for large ranges in concentration and ratios than linear scales.
Figure 2 is a bromide/chloride versus chloride concentration plot containing points for the ground waters beneath the study area and oil brines east of the sampled ground waters. Figure 3 is an enlarged portion of Figure 2 that includes only points for the sampled ground waters of this study. The individual points in Figure 3 are labeled with the well identification number. The two dashed curves in Figure 2 enclose a zone representing the mixing of freshwater with natural Permian saltwater. The freshwater end members for the dashed curves are based on fresh ground waters from the Equus Beds area (Whittemore, 1984; and data for the Equus Beds Aquifer Mineral Intrusion Study, Young et al., 1998). The saltwater end members for the dashed curves are for saltwaters from the Wellington Formation in the Smoky Hill River valley (Whittemore, et al., 1981) and from the saltwater intrusion area in the western Equus Bed aquifer (Young et al., 1998). The solid curves and the dashed curve in Figure 3 are portions of the same curves that are displayed in Figure 2. The points for ground waters from both the shallow and deep wells at site MW 115 lie within the mixing zone between freshwater and halite-dissolution brine. The waters from both wells at site MW 115 were fresh and contained less than 100 mg/L dissolved chloride.
Figure 2. Bromide/chloride versus chloride concentration for ground waters in the study area and oil brines east of the study area. A larger version of this figure is available.
Figure 3. An enlarged portion of Figure 2 with only points for the ground-water samples (including well identification labels). A larger version of this figure is available.
Formation brines associated with hydrocarbons in strata not containing rock salt in Kansas have substantially higher bromide/chloride ratios than saltwater primarily derived from the dissolution of rock salt. The oil-field brine samples listed in Table 2 have bromide/chloride mass ratios in the range 0.00386-0.00462 (38.6-46.2 after multiplying by 10,000). The oil well sampled at the Johnson oil field in 1983 is known to have been producing from Mississippian strata; the more recently sampled wells are presumed to also produce from these strata. Oil well information in the KGS database also indicates that other wells in the Johnson field have produced oil from Mississippian strata. The brine samples from the Ritz-Canton oil field taken in 1983 and 1997 (located to the east of the Johnson oil field) for a well also producing from the Mississippian are included in Table 2. Those samples provide an indication of the possible range in chemistry in the brines that have been extracted from this strata in the region in the past. The two solid curves in Figure 2 represent the mixing of oil brine from the Mississippian strata east of the study area with fresh and slightly saline waters such that all the points for the sampled ground waters (except for the two fresh waters from site MW 115) lie within this mixing zone. The oil-brine end members for the two solid curves are at greater and lower bromide/chloride ratios than the actual oil brines and represent possible analytical error and additional range in the ratios for the Mississippian brines from east of the study area.
In general, the greater the chloride concentration of the ground-water samples, the higher the bromide/chloride ratio relative to the range of ratios for the zone of mixing between freshwater and halite-dissolution brine (Figure 2). The range in the bromide/chloride ratios for the sampled ground waters decreases with increasing chloride content. Based on Figure 2, it is clear that the source of the high chloride concentration in the sampled monitoring wells is oil-field brine with a bromide/chloride ratio that fits that of saltwater from Mississippian strata to the east of the study area. Extrapolation of the average bromide/chloride ratio of the sampled ground waters to high chloride values indicates that the expected brine would have a ratio of about 0.0041 (41 after multiplication by 10,000). This ratio lies between those for Mississippian brines sampled from the Johnson and Ritz-Canton oil fields. Mississippian strata in Kansas include several different limestone formations. It is not unexpected that the oil brine produced from different locations in the Johnson field could come from some different Mississippian horizons and that there could be a small difference in the bromide/chloride ratio of the brines at the different horizons. All of the Johnson oil brines listed in Table 2 are from the same quarter section. The more recent the brine sample was collected from the Johnson field, the greater is the bromide/chloride ratio listed in Table 2. If this increase is real, it could represent a change in the particular parts of the Mississippian formation from which the brine has been derived during the sampling period.
Table 2 lists the total inorganic iodine (iodide plus iodate) content and the iodine/chloride ratio of the water samples. The samples from both the shallow and deep wells at site MW 121 have relatively high iodine/chloride mass ratios (>0.001). This well site is situated in a low area where a small drainage, located primarily within Sec. 34, T. 19 S., R. 3 W., enters Dry Turkey Creek about a mile east of the refinery. Whittemore (1997) reported the results for monitoring wells in the area of the former McPherson landfill in Sec. 34, T. 19 S., R. 3 W. High iodine/chloride ratios (data associated with the study of Whittemore [1997]) were found for three monitoring wells at the west end of the landfill (near the center of Sec. 34). Iodine/chloride ratios were 0.0076, 0.0019, and 0.00097 for samples from MW-1D, MW-2D, and MW-9, respectively, which contained chloride concentrations of 386 mg/L, 2,110 mg/L, and 729 mg/L, respectively. The dissolved iodine concentrations were low (the highest was 4 mg/L), but appear high relative to the much lower contents of other well samples. These wells are located in the vicinity of the low area of the surface drainage and are screened at the base of the High Plains aquifer. (See tables 1-3 in Whittemore [1997] for specific location, construction, and other chemical data for these wells.) The high iodine/chloride ratios suggest that either there was a source of iodine from the west end of the landfill or some of the oil-brine contamination in the area came from saltwater that flowed or seeped from surface disposal pits to the east into the drainage in Section 34. The surface source of oil brine is possible, even though the iodine/chloride ratios are greater than in the oil brine, because small amounts of dissolved inorganic iodine (as iodide in the brine) can be adsorbed on fine-grained sediments. Subsurface seepage of oil brine that ran over the land surface from the oil field into the low area of the drainage in Sec. 34 could result in adsorption of some iodine on the fine-grained sediment prevalent in the upper portion of the aquifer. Slow flushing of the saltwater from the sediments could then later release some of the iodine to give higher iodine/chloride ratios than in the brine. Trace amounts of bromide and chloride can also be adsorbed on fine-grained sediments, but the adsorption is smaller than for iodide so that the adsorbed amount is expected to be within the analytical error for the bromide and chloride determinations.
Water samples were collected from Dry Turkey Creek at the county road bridge about one mile east of the refinery. One sample was taken for the salinity identification study of the McPherson landfill area (Whittemore, 1997) and three more samples were taken for an ongoing TMDL (total maximum daily loads) investigation by the KGS for the KDHE. The sampling location is approximately 0.5 mile downstream of the entrance of the effluent of the municipal wastewater treatment plant of McPherson. Samples were collected in October 1997, October and November 1999, and March 2002. Chloride concentrations ranged from 430 mg/L in October 1999 to 733 mg/L in March 2002. Points for the four creek samples are plotted in Figure 4 along with the same points and mixing curves as in Figure 2. The bromide/chloride ratios increase substantially with increasing chloride content for the four creek samples.
Figure 4. Bromide/chloride versus chloride concentration for the same samples in Figure 3 and for samples from Turkey Creek 0.5 mile below the entrance of effluent from the municipal wastewater treatment plant of McPherson. A larger version of this figure is available.
Nearly all of the chloride in the two samples of creek water with the lowest chloride contents (430 and 471 mg/L) and bromide/chloride ratios is interpreted to come from a halite-dissolution type source, m comparison, the background chloride concentration expected for the Equus Beds aquifer in the area is <50 mg/L. The volume of water flowing in the creek during sampling was primarily from the discharge of the treated municipal wastewater upstream. The water chemistry that conforms to the interpretation of halite-dissolution brine in municipal wastewater is due to the discharge of saltwater from conventional water softeners that use rock salt to regenerate the exchange medium. The City of McPherson obtains its source water from the Equus Beds but does not soften it. Many homes in the city use conventional softener units to soften the water. The addition of the wastewater from the water softeners creates a measurable and identifiable change in the salinity of the creek water.
A mixing curve is included in Figure 4 that passes through the points for the Dry Turkey Creek samples with the lowest and greatest chloride concentrations. The curve also passes within the range of analytical error of the other two points for Dry Turkey Creek water with intermediate chloride contents and is extrapolated to lower and higher chloride concentrations than the observed range. The extrapolated curve at greater chloride levels extends into the mixing zone of fresh to slightly saline water with oil brine. The figure indicates that the Dry Turkey Creek samples with greater chloride content and higher bromide/chloride ratios have additional chloride added from oil-brine contamination. Whether this oil-brine contamination is in the source ground water being pumped by the City of McPherson or in discharge to the creek upstream of the entrance of the treated municipal wastewater to the stream is unknown at this time.
The waters sampled from shallow wells MW 110S, MW 113S, MW 118S, and MW ZL6S had lower bromide/chloride ratios than the water samples from shallow wells MW 120S and MW 121S, even though the chloride concentration range was similar for the well waters. The first 4 wells are located to the west of Dry Turkey Creek, the other two wells are located to the east of Turkey Creek. The ground-water level in the Equus Beds aquifer is below Dry Turkey Creek. Thus, even though the sediment in the upper part of the aquifer is predominantly clay, a small amount of the water in Dry Turkey Creek is expected to be seeping through the creek bed into the aquifer. The lower ratios for the samples west of the creek than east of the creek could represent a small amount of the treated wastewater with a lower bromide/chloride ratio than that of the ground water contaminated by oil brine. The direction of ground-water flow from the east to the west would explain the presence of a small amount of the treated wastewater in the ground water on the west side of the creek.
The primary source of chloride contaminating the ground waters of the Equus Beds aquifer in the study area is oil-field brine. Oil-brine contamination has added from nearly 100 mg/L to well over 8,000 mg/L of dissolved chloride to the local ground waters sampled. The ground water with the greatest chloride concentration will be the focus for prevention from arrival at the refinery. Over 90% of the chloride content of those ground waters with a chloride value greater than 1,000 mg/L is likely derived from oil-brine contamination.
The probable oil-brine source is directly to the east of the study area at the location of the Johnson oil field. The discovery well of the Johnson Field opened in early 1932 in Sec. 35, T. 19 S., R. 3 W., the section immediately to the east of the study area. There were 16 wells in the field by the beginning of 1939 (Ver Wiebe, 1939). Although not a large field, it was relatively productive. Studies by the State Board of Health (former KDHE), the City of Wichita, the USGS, and the KGS in the 1930s (Williams and Lohman, 1949) indicate that the standard practices for disposal of oil brine in McPherson, Harvey, and Reno counties until the late 1940s was to surface ponds, but also included road ditches and diversion to surface streams. Large amounts of oil brine are known to have contaminated fresh ground waters in the Ritz-Canton Field to the east of the Johnson Field and in other oil fields to the south. There is no indication that saltwater disposal practices in the Johnson Field would have been any different from those in nearby fields.
There were two saltwater disposal wells on the west side of the Johnson oil field just to the east of the study area that were located in Sec. 34DD, T. 19 S., R. 3 W. and Sec. 3AAA, T. 20 S., R. 3 W. Both of these wells were plugged in 1975. Another brine disposal well in the Johnson field to the east of the study area that was plugged is located in Sec. 2ABB, T. 20 S., R. 3 W. (plugged in 1996). Disposal wells listed in the KGS oil and gas database as active and permitted are located in Sec. 35CCC, T. 19 S., R. 3 W. (the same location as the brine sampled from the Johnson Field listed in Table 3) and Sec. 2BBB and Sec. 2CD, T. 20 S., R. 3 W. Enhanced oil recovery wells listed in the KGS database that are plugged are located in Sec. 35BBD (plugged in 1989) and Sec. 35BBA (plugged in 1993), T. 19 S., R. 3 W. An enhanced recovery well to the east of the study area listed as active and permitted in the KGS database is located in Sec. 2BBD, T. 20 S., R. 3 W. Thus, there are 2 plugged disposal wells 0.9 mile and two active and permitted disposal wells 1.1 miles directly east of the easternmost monitoring wells in the study area. The two plugged wells formerly used for enhanced recovery in Sec. 35 lie about 1.3 miles to the east-northeast of MW 120, and the active and permitted enhanced recovery well in Sec. 2 lies approximately 1.2 miles east of MW 122. If there were leaks associated with these disposal or enhanced recovery wells, that could have been an additional source of saltwater contamination to the Equus Beds aquifer. The KGS database also includes wells farther to the south in the Johnson oil field that are not in the direction of the probable oil brine source.
The dense saltwater from the past surface disposal of oil brine in the Johnson Field would be expected to flow primarily downwards through the permeable unconsolidated sediments until reaching less permeable clay layers or the shale of the Permian bedrock. If some brine were allowed to flow along surface drainages, infiltration of part of the brine could also contaminate the underlying aquifer. Brine diluted by movement through the aquifer to less dense saltwater would migrate in the direction of ground-water flow generally to the west. The saltwater still dense enough to be driven by gravity flow would spread along the top of the clay layers until reaching locations where the clay thinned or disappeared, then would again migrate downward. Leaky saltwater disposal or injection wells in the oil field could have allowed direct entry of the brine to the shallow portion of the aquifer. Dense saltwater at the base of the unconsolidated aquifer would move along the shale bedrock surface generally in a westward direction due to the slope of the aquifer base to the west toward the McPherson channel. The westward migration of denser saltwater and dispersion of saline water by the ground-water flow would likely carry the contamination into the study area. Brine that reached the aquifer base would typically seek low elevations along the small local valleys in the bedrock surface to produce a distributed pattern of varying salinity in the ground water. This could partially explain the spatial variation in the ground-water salinity observed in the study area. The local distribution and thickness of sand and gravel versus clay units would also affect the salinity range found at the different well locations. In addition, the rate and direction of movement of contaminated water in the aquifer would be influenced by production wells being pumped south of McPherson.
A small amount of slightly saline water in Dry Turkey Creek could be infiltrating into the Equus Beds aquifer and adding to the chloride content of shallow ground waters just west of the creek in the study area. Most of the chloride in the creek downstream of the entrance of treated municipal wastewater of McPherson is expected to have come from the dissolution of rock salt discharged from conventional home water softeners that are used in McPherson. The greatest addition of chloride from the water-softener salt source to the shallow ground waters that were sampled is estimated to be less than 200 mg/L. Analysis of water collected from Turkey Creek indicates that samples with greater chloride content and higher bromide/chloride ratios have additional chloride from oil-brine contamination. Whether this oil-brine contamination is in the source ground water or in the municipal wastewater is unknown at this time.
Barbara Johnson of Wilson & Company, Inc., and Doug Louis of the Kansas Corporation Commission (KCC) facilitated arrangements for the study. Jeff Klock of the KCC collected the waters sampled in 2003 for this study. Lawrence Hathaway analyzed the water samples sent to the KGS. National Cooperative Refinery Association provided funding for the analysis of the 17 water samples collected in 2003. Barbara Johnson and Elizabeth Johnson of Wilson & Company, Inc., and Jeff Klock of the KCC reviewed and edited the report.
Gogel, T., 1981, Discharge of saltwater from Permian rocks to major stream-aquifer systems in central Kansas: Kansas Geological Survey Chemical Quality Ser. 9, 60 p.
Hathaway, L.R., Waugh, T.C., Galle, O.K., and Dickey, H.P., 1981, Chemical quality of irrigation waters in the Equus Beds area, south-central Kansas: Kansas Geological Survey, Chemical Quality Ser. 10, 45 p.
Leonard, R.B., and Kleinschmidt, M.K., 1976, Saline water in the Little Arkansas River basin area, south-central Kansas: Kansas Geological Survey, Chemical Quality Ser. 3, 24 p.
Ver Wiebe, W. A., 1939, Exploration for oil and gas in western Kansas during 1939: Kansas Geological Survey, Bulletin 28, 106 p.
Whittemore, D.O., 1984, Geochemical identification of salinity sources, in R.H. French (ed.), Salinity in Watercourses and Reservoirs (Proceedings of the International Conference on State-of-the-Art Control of Salinity): Ann Arbor Science, Butterworth Publishers, Stoneham, MA, p. 505-514.
Whittemore, D.O., 1988, Bromide as a tracer in ground-water studies: Geochemistry and analytical determination: Proceedings Ground Water Geochemistry Conference, National Water Well Association, Dublin, OH, p. 339-360.
Whittemore, D.O., 1995, Geochemical differentiation of oil and gas brine from other saltwater sources contaminating water resources: Case studies from Kansas and Oklahoma: Environmental Geosciences 2, p. 15-31.
Whittemore, D.O., 1997, Geochemical identification of sources of salinity in surface and ground waters in central McPherson County, Kansas: Kansas Geol. Survey, Open-File Report 97-78, 25 p. [available online]
Whittemore, D.O., Basel, C.L., Galle, O.K., and Waugh, T.C., 1981, Geochemical identification of saltwater sources in the Smoky Hill River Valley, McPherson, Saline, and Dickinson counties, Kansas: Kansas Geol. Survey, Open-File Report 81-6, Lawrence, KS, 78 p.
Williams, C.C., and Lohman, S.W., 1949, Geology and ground-water resources of a part of south-central Kansas: Kansas Geological Survey, Bull. 79, 455 p. [available online]
Young, D.P., Buddemeier, R.W., and Whittemore, D.O., 1998, Equus Beds mineral intrusion project report, FY 1998: Kansas Geol. Survey, Open-File Report 98-24, 100 p.
Kansas Geological Survey, Geohydrology
Placed online Jan. 10, 2006
Comments to webadmin@kgs.ku.edu
The URL for this page is http://www.kgs.ku.edu/Hydro/Publications/2004/OFR04_04/index.html