Kansas Geological Survey, Open-file Report 2003-14
by
P. Allen Macfarlane and Gary Hecox
KGS Open-file Report 2003-14
February 2003
The undifferentiated Quaternary and Ogallala Formation sequence in the Northwest Kansas Groundwater Management District 4 (GMD 4) is best described as a highly heterogeneous assemblage of fluvial and eolian sediments. These sediments form the Ogallala portion of the High Plains aquifer. An improved understanding of the local hydrogeology of this sequence will enhance delineation of aquifer subunits. This effort could potentially require township-scale characterization of the aquifer framework to refine the spatial trends in hydraulic conductivity and specific yield observed on regional scale maps developed in the 1980s as part of the USGS High Plains RASA project from a small sample of the available subsurface information.
Initially, this study was undertaken in two 9-township size areas of the GMD 4 to produce a fine-scale three-dimensional characterization of the Ogallala aquifer framework. The data sources for this project were the driller's logs from the WWC-5 records and sample logs from test-hole drilling documented in the geology and groundwater county reports of the Kansas Geological Survey. Subsequent screening of the well logs indicated that the data density was insufficient to achieve this goal. Hence, a more traditional two-dimensional approach to aquifer characterization was followed by first tabulating the sand, sand and gravel, and coarse fractions for each well location and mapping the fraction distributions as percentiles for the upper and lower half of the sequence.
The total thickness of the deposits above the Cretaceous bedrock surface that form the Ogallala portion of the High Plains aquifer is greater in the Sherman than in the Sheridan County areas. In the aggregate, the coarse fraction proportion (and thickness) is only slightly greater in the Sherman than in the Sheridan County study area. In both areas, the coarse fraction proportion is slightly greater in the fluvially dominated lower half than in the fluvial and eolian upper half of the framework. A comparison between the Sheridan County study area lithofacies maps and the regional hydraulic conductivity maps indicates that the spatial distribution of hydraulic conductivity could be noticeably improved at the township scale by including more of the WWC-5 driller's log information in the mapping. No correlation was found between the Sheridan County study area lithofacies maps and regional specific yield map.
Future management of the Ogallala portion of the High Plains aquifer will focus on aquifer subunits as a way to locally customize the strategy for extending the life of this water source within each of the western groundwater management districts (1, 3, and 4) in Kansas. A key component of being able to delineate these aquifer subunits is an understanding of the impact of aquifer heterogeneity on water availability and yield (Hecox, et al., 2002). Even though the Ogallala has been in widespread use as a source of water in Kansas for the last half century, its heterogeneous nature is poorly understood at the subregional and local levels. Recent studies in Texas have shown that the heterogeneity in the Ogallala has the potential for vertical and lateral compartmentalization of the aquifer (Gustavson, 1996). Evidence of the local influence of the aquifer framework on the subsurface flow of water in Kansas is abundant. The downward movement of recharge from the surface is controlled by the occurrence of clay layers in the unsaturated zone, moderated by macropore flow and perhaps by the movement of water across clay layers in the backfill and gravel pack within the annular space of installed wells. It is now recognized that even though the Ogallala is considered to be regionally unconfined, there are subregions where the aquifer is a leaky confined system. This leaky confined condition most likely results from the local arrangement of sand and clay, caliche or cemented lenses in the saturated part of the aquifer.
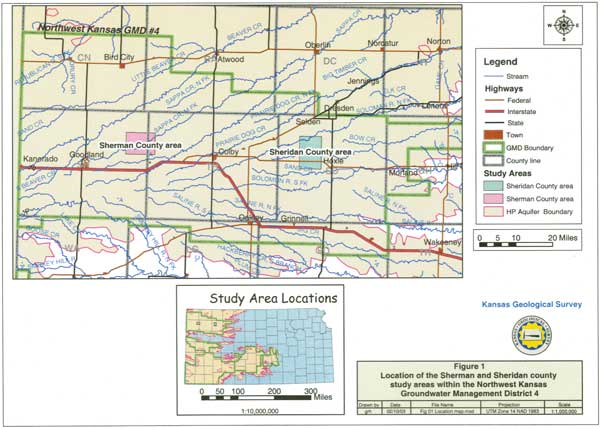
Efforts are currently underway to better understand the township-scale hydrogeology of the Ogallala by conducting detailed investigations in two small study areas in the Northwest Kansas Groundwater Management District 4 (GMD 4; Figure 1). Information resulting from this study will have implications for the fine-scale definition of aquifer subunits and the development of tailored management plans that are applied to both of these local areas. The investigation reported on here is a pilot project that will serve as a model for other Ogallala aquifer characterization projects in the future.
Figure 1. Location of the Sherman and Sheridan county study areas within the Northwest Kansas Groundwater Management District 4. This figure is also available in a larger PDF format.
Evaluation of the aquifer framework relies primarily on the sample logs contained in the county bulletins of the Kansas Geological Survey (KGS) and the WWC-5 driller's log data source also maintained by the Survey. Water-well drillers have been required to submit well completion records on the wells they complete to the Kansas Department of Health and Environment since 1975. Because of the dependence of western Kansans on ground-water sources for water supply, the records of wells drilled in the Ogallala portion of the High Plains aquifer since 1975 number in the thousands. However, the quality of the driller's logs is highly variable and the reported location of the completed well may be significantly in error. Additional drawbacks include the use of nonstandard terms for lithologic description and the overall lack of detail in the description of the units that were encountered during drilling. Thus, the logs must be carefully screened prior to use, which requires a subjective evaluation of the information reported by the well driller on the WWC-5 form with respect to accuracy and quality. The KGS also maintains an extensive data base of geophysical logs and a core library from boreholes drilled primarily for oil and gas. However, few of the logs extend to the surface in the Ogallala region and no cores of the Ogallala are available for inspection. As a result, this study relies entirely on the driller's logs from the WWC-5 data base.
The stratigraphic units that form the Ogallala portion of the High Plains aquifer are the Ogallala Formation and the overlying Quaternary sediments (Gutentag et al., 1984; Macfarlane, 2000). Since predevelopment the regional water table has undoubtedly remained within the Ogallala Formation interval. However, the overlying Quaternary sediments are included in the High Plains aquifer because they are sufficiently permeable to permit significant vertical movement of water and thus form part of the unsaturated zone above the regional water table.
Initially, the project goal of this pilot study was to develop three-dimensional characterizations of the Ogallala and the undifferentiated Quaternary for both study areas. However, this goal could not be achieved because the density of control points needed is insufficient for the subsurface characterization of local heterogeneity within these deposits. Nevertheless, sufficient work was completed on the data from the two study areas to develop an initial characterization of heterogeneity using summary statistics and traditional, two-dimensional, lithofacies mapping techniques.
The purpose of this report is two-fold: (1) to provide an assessment of driller's log quality and (2) to present a preliminary characterization of the Ogallala aquifer framework primarily with respect to lithology. With regard to (1), no attempt was made to field-check well locations due to funding and time limitations.
The study areas for this aquifer characterization project are located in Sherman, Thomas, and Sheridan counties within GMD 4 (Figure 1). The Sherman-Thomas and the Sheridan county study areas are referred to as the Sherman and Sheridan county study areas, respectively, in this report and include T. 6-8 S., R. 28-30 W. and T. 6-8 S., R. 36-38 W., respectively. Detailed hydrogeologic studies are being conducted jointly by the KGS and GMD 4 in T. 7 S., R. 37 W. in Sherman County and the western third of T. 7 S., R. 36 W. in Thomas County and T. 7 S., R. 29 W. and T. 8 S., R. 29 W. in Sheridan County.
Pierre Shale underlies the Ogallala portion of the High Plains aquifer in the Sherman and most of the Sheridan county study areas (Merriam and Frye, 1954; Merriam, 1963). The uppermost Smoky Hill Chalk Member of the Niobrara Shale is the uppermost bedrock unit in the eastern part of Sheridan county study area. The top of the bedrock surface is a regional unconformity separating Late Cretaceous units from the overlying Late Tertiary Ogallala Formation and the Ogallala top is also a regional unconformity separating Tertiary from Quaternary units (Merriam, 2003).
Most of what is known about the Ogallala is from field study of outcrops and recovered cuttings from test drilling. Much of what we know of the geology and stratigraphy of the Ogallala comes from a classic study of the Ogallala of northern Kansas that was conducted by and reported in Frye et al. (1956). In northern Kansas, the Ogallala Formation is subdivided into three members, which are (from oldest to youngest): the Valentine, Ash Hollow, and Kimball (Bayne and O'Connor, 1968; Merriam, 2003). Each member is a distinct time-stratigraphic unit. However, their lithologic characteristics are only sufficient to distinguish them one from another in a general way and are not adequate to allow for the sharp delineation of stratigraphic boundaries at any particular location (Frye et al. 1956). The boundaries between members are based primarily on the occurrence of preserved plant and molluscan fossils.
Most of the Ogallala sediments are believed to be fluvial in origin in northern Kansas and belong to either the Valentine or the Ash Hollow members. The Kimball has been largely eroded in this part of the state (Frye et al., 1956; Merriam, 1963). Valentine Member deposits are confined entirely to valleys cut into the underlying bedrock, buried beneath Ash Hollow and Kimball sediments. Ash Hollow sediments overlap laterally the bedrock valleys and in many places bury former stream divides. Kimball sediments spread laterally as a broad sheet to form a plain of alluviation that culminated in the deposition of the "Algal limestone".
Valentine sediments consist predominantly of fine to medium, relatively well sorted, gray to greenish-gray arkosic sand, containing disseminated calcium carbonate and tubules and irregular concretions of opal. Greenish-gray, olive drab, and gray silts containing irregular nodules and streaks of calcium carbonate are common; greenish gray to drab bentonitic clays and lentils of volcanic ash are fairly common.
In outcrop, the base of the Ash Hollow is arbitrarily placed where the greenish-gray color of the sediments is replaced by pink and pinkish drab hues. Upward from the Ash Hollow base a progressive change in color occurs within the unit from pink and pinkish drab to hues of red. Fine to coarse arkosic sand is the predominant clastic constituent, but gravel and silt may locally predominate in some zones. Exposures at the surface reveal lenticular bodies of sand and gravel that are typically cross-bedded and appear to have a fluvial origin. Clay is present in very small amounts but volcanic ash may constitute up to 5% of the lower half of the member. Calcium carbonate-cemented and caliche zones are common as well freshwater limestones and marls have been documented in the Ash Hollow section. Unlike the gravels of the Valentine that contain locally derived clasts, the Ash Hollow gravels are typically arkosic. Overall, Ash Hollow sediments appear to be more uniform with respect to sediment source than the Valentine sediments. Within the Ash Hollow there is little textural variability vertically. The internal stratigraphy of the member is relatively simple and nondescript. Exposures of caliche and cemented zones simulate bedding but these false beds are not traceable at the surface for more than a few hundred yards. Frye et al. (1956) concluded that some of the caliche zones in the Ash Hollow probably represented paleosols resulting from small intervals of nondeposition.
A full section of the Kimball resting on the Ash Hollow has an average thickness of about 30 ft in northwest Kansas (Frye et al., 1956). The Kimball is generally fine-textured and calcareous. Arkosic medium to fine sands and silts predominate. In some areas the Sidney gravel lentil is present at the base of the Kimball and calcium carbonate content generally increases upward through the unit. The upper one-third to one-half of the Kimball generally consists of impure soft limestone capped by the "Algal limestone." Where the calcium carbonate content is low, Kimball sediments are reddish tan to red brown in color in outcrop. Where the calcium carbonate is high, the cementation masks the reddish hues and the unit is ash-gray in color.
The oldest Pleistocene sediments above the Ogallala in northern Kansas are believed to be Illinoian or Wisconsinan age, which indicates a long interval of surface exposure of the alluvial plain surface (the "Algal limestone") (Frye et al., 1956). The uplands are mantled by Quaternary sediments that consist of loess and locally dune sands. Thin Pleistocene (post-Kansan) and Holocene deposits can be found in the valleys that traverse the study area (Ross, 1991).
The Tertiary-Quaternary sequence above the Cretaceous bedrock surface consists of a complex assemblage of unconsolidated sediments that were deposited by fluvial, lacustrine, and eolian processes (Frye et al., 1956). Schultz (1977) characterized the Ogallala in the Texas and Oklahoma panhandle as a random intermixture of channel and floodplain sediments. Using Markov chains to analyze the lithologic transitions in outcrop sections in western Nebraska, Breyer (1975) concluded that the vertical distribution of lithofacies is random and characteristic of deposition by braided streams. In braided stream deposits, small scale fining upward and coarsening upward sequences of may occur in the same section, thereby giving the entire sequence a "random" appearance (Miall, 1996). In eastern New Mexico and the Texas panhandle, Seni (1980) found the three-dimensional framework of the Ogallala to be consistent with a wet alluvial-fan depostional model. Medial fan facies were characterized as a broad sand and gravel sheet deposited by braided streams and grade in the down-dip direction into distal fan facies, which are characterized by digitate, bifurcating sand and gravel bands. Distal fan facies are separated laterally by thinner sand and gravel deposits as well as fine grained material similar to the interchannel deposits found on the flood plains of meandering streams. Gustavson (1996) described and analyzed outcrops and continuous core samples of the Ogallala and the Blackwater Draw formations and other subsurface data in Texas and eastern New Mexico and developed a significantly different interpretation of the Ogallala from Sent (1981). Gustavson concluded that the Ogallala consists of fluvial paleovalley fills capped by eolian deposits. He recognized 7 distinct lithofacies within the Ogallala: (1) gravel, (2) sand and gravel, (3) fluvial sands, (4) abandoned channel or floodplain fine sand and mud, (5) floodplain or ephemeral pond laminated fine sand and silt and laminated to massive clay, (6) eolian sand, and (7) fine sand to loess. Gustavson found only fining upward sequences within the lower fluvial part of the Ogallala and associated these deposits with high-energy ephemeral streams.
The Ogallala portion of the High Plains aquifer consists of the Miocene-Pliocene Ogallala Formation and overlying Quaternary unconsolidated sediments (Frye, 1945; Bayne, 1956; Prescott, 1953; Gutentag et al., 1984; and Merriam, 2003). Included within the Quaternary section are Pleistocene- and Holocene-age sediments. Combined Pliocene and Quaternary sediment thickness ranges from less than 100 ft up to more than 300 ft. Total thickness is generally less in the Sheridan than in the Sherman county study areas.
From a statistical analysis of several thousand driller's logs from the High Plains aquifer region, Gutentag et al. (1984) concluded that hydraulic conductivity and specific yield are randomly distributed properties vertically within the water-saturated part of the Ogallala that can be represented by vertically averaged values in regional ground-water models. Gutentag et al. believed this random behavior in property values in the vertical direction to be consistent with braided stream deposits. Stullken et al. (1985) reported similar conclusions based on a geostatistical analysis of 359 driller's logs from Sherman County. However, neither study examined the entire interval of the Ogallala Formation and might have included overlying water-saturated Quaternary deposits. Also, the more recent work of Gustavson (1996) indicates that Ogallala sediments were deposited under a diverse set of environmental conditions by fluvial and eolian processes.
The sources of data used to analyze the distribution of lithologies within the Ogallala portion of the High Plains aquifer in the Sherman and Sheridan county study areas were the driller's logs in the WWC-5 records and the sample logs in the Sherman, Thomas, and Sheridan county bulletins of the Kansas Geological Survey. In this project a total of more than 1,000 WWC-5 records of wells and 17 sample logs from the Sheridan, Sherman, and Thomas county bulletins were available for both 9-township study areas.
On completion of their water-well installation projects in Kansas, the drilling companies submit WWC-5 records to the Kansas Department of Health and Environment. These records contain location, well construction information, and a driller's log of the sediments penetrated by the borehole. The logs contained in these records are prepared from notes made by the driller presumably while the borehole for the well is being drilled. Few, if any, of the drillers that operate in Kansas have had any formal training in geology. As a result, the driller's interpretations and descriptions of the drill cuttings returning to the surface often do not typically follow the methods or terminology used in geology. The overall level of detail in the driller's log may also limit its usefulness for aquifer characterization. In some cases the entire sediment interval is summarized by only a few entries in the driller's log. Often, the upper half of the borehole geology is summarized by a single entry but detailed descriptions are available for the lower part of the Ogallala.
In contrast, the sample logs contained in the Kansas Geological Survey bulletins are typically descriptions made by trained professionals during test-hole drilling. Test-hole drilling is typically used to gather subsurface data to assist in developing an understanding of a county's hydrogeology. The level of detail presented in these logs is also important in how they are interpreted with respect to the relative proportions of the various lithologies that constitute the drilled sequence. The KGS county bulletins also contain carefully selected driller's logs of wells completed in the particular county under investigation. Often, the authors of the report have used their local knowledge of the subsurface geology to make stratigraphic interpretations of the described section in the driller's log.
WWC-5 records were selected for lithologic analysis in this study using four criteria. First, the WWC-5 record had to refer to the drilling of a well, not it's decommissioning. Second, the directions to the well from the nearest town were checked against the legal location to insure that the reported location was reasonably accurate, and placed the well within the section indicated in the public land survey location provided in the log. Third, WWC-5 records were selected only if the driller's log indicated that the borehole had penetrated the bedrock surface beneath the Ogallala. Bedrock is usually indicated on the logs as shale, black shale, or ochre (for weathered shale). Finally, WWC-5 records were selected if the total number driller's log entries exceeded 9 and if the total number of entries for the upper half of the section above the bedrock surface exceeded 4. Along this line, WWC-5 records were also rejected if the driller's log did not start at the surface. Failure to meet any of these criteria eliminated the driller's log as a source of information for this project. Initially, it was hoped that the sample logs from the county bulletins could be used as a baseline to evaluate nearby WWC-5 driller's logs. However, none of the KGS test hole locations are within 0.5 mi of any of the WWC-5 well locations.
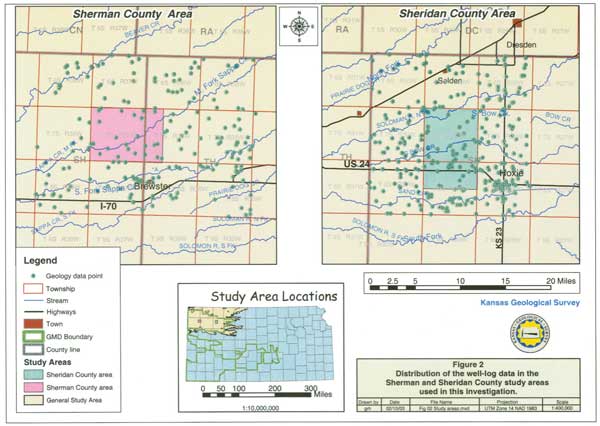
As a result of the screening process, the number of WWC-5 records that were used for the lithologic analysis was reduced to 69 for the Sherman and 181 for the Sheridan county study areas. This amounts to less than 25% of the original pool of WWC-5 records from both areas. None of the WWC-5 record wells have been field checked in this project to verify the public land survey location. Figure 2 shows the distribution of data points with driller's and sample logs that were used in this project. The relatively sparse distribution of useable logs (« 1/mi2) in both study areas is insufficient to generate detailed three-dimensional visualizations of the geologic framework at the scale of the radius of influence of a pumping (assumed to be on the order of 2 mi in diameter).
Figure 2. Distribution of the well-log data in the Sherman and Sheridan county study areas used in this investigation. This figure is also available in a larger PDF format.
Depth to bedrock from land surface is readily identified on the logs selected for lithologic analysis and some of the logs not selected where the location information appeared to be correct. 298 and 195 data points were available from the Sheridan and Sherman county study areas, respectively, for mapping the bedrock surface. Under the assumption that the relative datum for the WWC-5 driller's log was land surface, the bedrock surface elevation was determined by subtracting the depth to bedrock from the land surface elevation. Land surface elevations in the Sherman County study area were determined manually using the USGS 1:24,000 scale 7.5-min topographic quadrangle sheets. In the Sheridan County study area, land surface elevations were determined based on a digital elevation model of the land surface and using the GIS methods.
The identification of the Ogallala top in the sediments above the bedrock surface is generally not possible because the driller's logs lack sufficient lithologic and any paleontologic detail. Thus, the section described in each of the logs was arbitrarily subdivided into upper and lower halves prior to quantitative analysis. The upper half most likely contains both Quaternary and Ogallala sediments. Hydrogeologically, the upper half of the sediment section includes most or all of the unsaturated zone above the pre-development regional water table and the lower half includes the entire pre-development saturated thickness and in some cases, the lower part of the unsaturated zone.
The sediments above the bedrock surface are highly heterogeneous mixtures of clay, silt, sand, and gravel with many calcium-carbonate-cemented and caliche-bearing zones. Frye et al. (1956) described the Ogallala as being "homogeneous in its heterogeneity." The lithologic descriptions in the WWC-5 logs and the KGS sample logs are highly individualized and reflect the individual's observation skills in describing the extremely diverse assemblage of cuttings that return to the surface during drilling. On some of the driller's logs only the primary lithology encountered for each depth interval is mentioned and none of the minor constituents represented in the cuttings are mentioned. Often the individual intervals described in these logs are short in an attempt to capture as much detail as possible. Other drillers characteristically provide only a list of the lithologies represented in the well cuttings for each depth interval or may provide some qualifications with respect to the relative proportions of each lithologic constituent present. The length of each interval described in these logs may be set arbitrarily or may coincide with distinct vertical lithologic changes, such as from clay to sand and gravel. Thus, to interpret the logs in order to determine lithologic proportions depends on the formulation of methods that promote consistent interpretation of each log from same driller and from all of the drilling companies that have drilled wells in both study areas.
Review of the driller's and KGS sample log entries from the WWC-5 records and the county bulletins indicated that to reasonably interpret the logs geologically, required a consistent translation of driller's descriptions into lithologic descriptions. Furthermore, to quantify the relative proportions of each lithology where more than one lithology was mentioned with or without qualifiers, a consistent set of algorithms for translation into relative proportions was needed. Because none of the WWC-5 wells were located in close proximity to the KGS-USGS test holes, there was no opportunity to calibrate any of the well driller's descriptions with the descriptions of the Ogallala aquifer sediments generated by KGS professional scientists from test-hole drilling. Consequently, a means to translate driller's interpretations into geologic interpretations had to be devised with no opportunity for calibration. Algorithms to translate the interpreted descriptions into relative proportions of each lithology (clay/silt, sand, and sand & gravel) represented for each interval were formulated based on the author's experience with interpretation of drill cuttings in the field and in some cases, based on reasonable but arbitrarily set rules. Table 1 was used to convert each entry of the WWC-5 and the KGS logs into bulk quantitative estimates of the relative proportions of clay/silt, sand, sand and gravel. Log entries that only mention gravel are included in the sand and gravel category. The clay/silt, sand, and sand & gravel thickness for each interval on the log were calculated by multiplying the interval thickness by the relative proportions. Total thickness for each lithology was obtained for each well location by summing the footage estimates for each interval. Seni (1980) adopted a similar approach using driller's logs for regional lithofacies mapping in the Ogallala in Texas. The distribution of the various fractions is compared to the topography of the bedrock surface to evaluate the influence of that surface on depositional patterns. Sand, sand & gravel, and the total coarse fractions are summarized in this report using histograms.
Table 1. Interpretation of WWC-5 driller's log entries and translation into standard lithology descriptions.
| Clayey sand | 70% sand and 30% clay |
| Sandy clay | 70% clay and 30% sand |
| Rock layer Sand rock, hard Hard sand Sand rock strips Sandstone Cemented Sand & Gravel Limestone and sand Limestone Caliche |
Caliche/Cemented sand & gravel |
| Clay rock Shale Black shale |
Pierre Shale bedrock |
| Ochre Oker Soapstone |
Weathered shale |
| Good sand | Medium- to coarse-grained sand and granule- to pea-size gravel without clay |
| Surface Top soil |
Soil zone, loess |
| Loess Yellow clay Clay |
Loess |
| Joint clay | Compacted clay |
| Gravel | Sand and gravel |
| A with a lens of B | 80% A and 20% B |
| A with B | 90% A and 10% B |
| A, B (as a list) | 60% A and 40% B |
| A, B, C (as a list) | 50% A, 30% B, and 20% C |
Caliche is not treated as a separate lithology in the approach followed in this project, but was combined with the sand category. In many of the WWC-5 logs, the distinction between caliche, cemented sand, cemented gravel, and cemented sand and gravel is unclear. However, the combined thickness of caliche (sometimes referred to as limestone) typically amounts to less than 5% of the Ogallala and Quaternary sediment thickness in the logs. This small fraction of the total sediment thickness is most likely well within the range of uncertainty in making the thickness estimates from the driller's log descriptions. In addition, many of the logs suggest a strong association of the caliche layers or carbonate masses with thin sands and sands and gravels interbedded with clay/silt layers, which implies that the caliche formed as a result of evaporation of perched ground water. Caliche layers and carbonate masses may also be associated with paleosols that occur in the Ogallala and Quaternary sediments (Frye et al., 1956; Gustavson, 1996). There were no instances where these paleosols could be interpreted from descriptions contained in the WWC-5 logs. The frequency of occurrence of caliche and cemented sand or sand and gravel layers was tabulated as part of the log analysis to determine whether caliche and other carbonate-cemented intervals occurred more frequently in the upper or the lower half of the sediments.
In the case where trained professionals produce descriptions of the drill-cuttings samples, the lithology fraction estimates generated by this approach are only slightly sensitive to the influence of the level of detail expressed in each log entry on the quantitative geologic interpretation of the logs. Tables 2 and 3 present two sample log descriptions for a test hole that was drilled in 1943 by the KGS-USGS in the NE corner, Sec. 1, T. 7 S., R. 37 W. The total sediment thickness above the bedrock surface at this location is 298 ft. Frye's (1945) description of this test hole appears in the Thomas County bulletin (Table 2) and Prescott's (1953) description of the test hole appears in the Sherman County bulletin (Table 3). Presumably, Prescott examined the same drill-cuttings samples that were examined by Frye. The total number of log entries for the upper and lower halves of the sediment thickness are 9 and 14 for the Frye's log and 14 and 18 for Prescott's log, respectively. Examination of the two test-hole logs shows that Prescott's description for each depth interval is much more detailed than the Frye description. Using the methodology outlined previously percentage of sand, and sand + sand and gravel fractions were calculated using the two logs of the same test hole. The lithology fractions derived from both sample log descriptions differ by only 10-15%. However, the total number of caliche and cemented sand and sand and gravel intervals noted in Frye's (1945) log is much lower than the number noted in Prescott's (1953) description.
Table 2. Description of the cuttings from a test hole drilled in NE corner Sec. 1, T. 7 S., R. 37 W. as it appears in Frye (1941).
| Thickness (ft) |
Depth (ft) |
||
|---|---|---|---|
| Soil, dark gray-brown | 4 | 4 | |
| Sanborn formation | |||
| Silt, yellow-gray, containing abundant snails | 46 | 50 | |
| Silt, containing clay, sand, and caliche; tan | 17 | 67 | |
| Ogallala formation | |||
| Gravel, containing sand and caliche | 6 | 73 | |
| Silt, containing sand, gravel, and caliche; gray | 15 | 88 | |
| Gravel and sand | 19 | 107 | |
| Silt, containing gravel, sand, and caliche; buff | 23 | 130 | |
| Gravel, fine, caontaining sand and caliche | 6 | 136 | |
| Silt, sand, and caliche; gray to buff | 17 | 153 | |
| Gravel, sand, and caliche | 4 | 157 | |
| Sand and caliche; light brown | 2 | 159 | |
| Gravel and sand | 18 | 177 | |
| Silt, sand, and caliche; gray and tan | 19 | 196 | |
| Gravel, medium to fine, and sand | 4 | 200 | |
| Sand and caliche | 7 | 207 | |
| Gravel, sand, and caliche; gray-buff | 15 | 222 | |
| Silt, yellow-gray, and caliche | 37 | 263 | |
| Clay, sand, and caliche; gray | 9 | 272 | |
| Gravel, fine, and sand; gray | 9 | 281 | |
| Silt and sand; gray-green | 3 | 284 | |
| Gravel and sand; gray | 14 | 298 | |
| Pierre shale | |||
| Shale, light blue-gray and yellow | 2 | 300 | |
| Shale, dark gray | 10 | 310 | |
Table 3. Description of the cuttings from a test hole drilled in NE corner Sec. 1, T. 7 S., R. 37 W. as it appears in Prescott (1953).
| Thickness (ft) |
Depth (ft) |
|||
|---|---|---|---|---|
| Quaternary--Pleistocene | ||||
| Sanborn formation | ||||
| Soil, dark gray-brown | 4 | 4 | ||
| Silt, soft, yellow-gray; contains some very fine sand | 33 | 37 | ||
| Silt, partly clayey, compact, light brown-gray and light-buff; contains a little fine sand; contains a little coarse sand near 50 ft. | 13 | 50 | ||
| Silt, clayey, cream and light-buff; contains a little caliche and fine to medium gravel | 10 | 60 | ||
| Silt, white to tan; contains much caliche, a little fine gravel, and fine to coarse sand | 7 | 67 | ||
| Tertiary--Pliocene | ||||
| Ogallala formation | ||||
| Gravel, coarse to fine, cemented | 3 | 70 | ||
| Gravel, coarse to fine and sand; contains a little caliche | 3 | 73 | ||
| Silt, greenish-gray downward to buff; contains some medium to fine gravel, coarse to fine sand, and a little caliche | 15 | 88 | ||
| Gravel, coarse to fine, and sand; contains a little light-buff silt; contains caliche from 97 to 98 ft | 12 | 100 | ||
| Gravel, medium to fine, and sand; contains some coarse gravel | 7 | 107 | ||
| Silt, buff and white; contains much fine gravel, coarse to fine sand, and caliche | 23 | 130 | ||
| Gravel, fine, and sand, partly cemented by caliche | 6 | 136 | ||
| Silt, gray-green and buff; contains some coarse to fine sand and a little caliche | 4 | 140 | ||
| Silt, soft, light brown-green and gray, contains a little caliche and a little coarse to fine sand | 13 | 153 | ||
| Gravel, fine, and sand; contains a little caliche | 4.5 | 157.5 | ||
| Silt, soft, light green-gray and light brown; contains a little caliche | 1.5 | 159 | ||
| Gravel, coarse to fine, and sand; mostly firmly cemented | 11 | 170 | ||
| Gravel, medium to fine, and sand; contains some caliche | 7 | 177 | ||
| Silt, light-gray and tan; contains much coarse to fine sand and caliche and some fine to medium gravel | 13 | 190 | ||
| Silt, buff and white, and caliche; contains some fine to medium sand | 6 | 196 | ||
| Gravel, medium to fine, and sand | 4 | 200 | ||
| Sand, coarse to fine, buff silt, and caliche | 7 | 207 | ||
| Gravel, medium to fine, and sand; contains much gray and buff silt and a little caliche | 15 | 222 | ||
| Silt, yellow-gray, and caliche | 4 | 226 | ||
| Sand, coarse to fine; contains a little fine gravel and caliche | 24 | 250 | ||
| Sand, coarse to fine; contains some medium to fine gravel and silt; light gray-green | 13 | 263 | ||
| Clay, light gray-green and white; contains some medium to fine sand and some caliche | 9 | 272 | ||
| Gravel, fine, and sand; light-gray | 9 | 281 | ||
| Silt, light gray-green; contains much medium to fine sand | 3 | 284 | ||
| Gravel, fine, and sand; light-gray | 6 | 290 | ||
| Gravel, medium to fine, and sand; gray | 8 | 298 | ||
| Cretaceous--Gulfian | ||||
| Pierre shale | ||||
| Shale, clayey, light blue-gray and yellow | 2 | 300 | ||
| Shale, dark-gray and light-green | 10 | 310 | ||
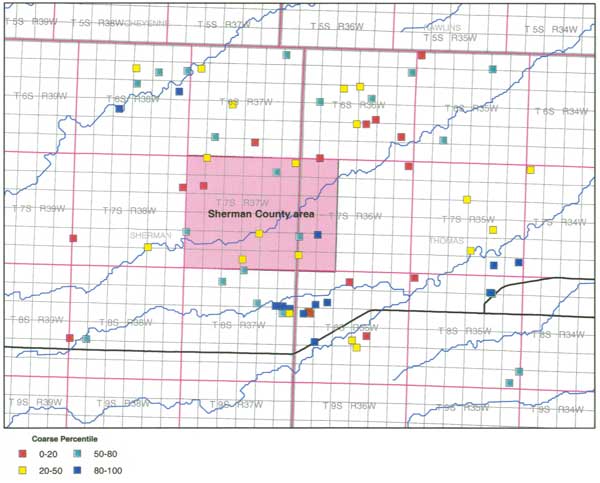
The calculated bedrock elevation, thicknesses, and the sediment fractions were posted on ARCVIEW-generated base maps of the Sherman and Sheridan county study areas. The elevation and thickness data were hand-contoured using a 50-ft contour interval. This large contour interval was selected to show major thickness trends in the data and significant features of the bedrock topography. The lithology fractions for the upper, lower, and aggregate Ogallala aquifer were mapped in each study area and include coarse (sand + sand & gravel), sand, and sand & gravel. The lithology fractions were mapped in two ways. Total lithology thickness was contoured using a 50-ft interval. In these visuals, there is an inherent assumption that there are no significant discontinuities in thickness. Considering sediment heterogeneity and the low density of data points in some parts of the Sheridan County study area and throughout the Sherman County study area, there may not be sufficient information to justify this assumption and to produce an unbiased map. A second way of visualizing the data does not rely on spatial continuity. The lithology fraction distributions (as percent of the total thickness of the interval under consideration) were used to determine the 20th, 50th, and 80th percentiles of the sample population. The percentiles were used to define the limits of 4 lithology fraction classes for mapping in each study area (Table 4). Each data point was classified according to its lithology fraction and posted on the map of its respective study area as a color-coded square. In these maps, the viewer is presented with information on the distribution of the three sediment fractions relative to the data available in the WWC-5 records from each study area and the viewer bases the spatial analysis on pattern recognition.
Table 4. The 20th, 50th, and 80th percentile values of the coarse, sand, and sand and gravel fractions of the aggregate and upper, and lower halves of the combined Quaternary and Ogallala Fm. sections in the eastern and western areas.
| Percentile | ||||
|---|---|---|---|---|
| Distribution | 80th | 50th | 20th | |
| Eastern Area | ||||
| Aggregate | ||||
| Coarse Fraction | 66.9 | 58.2 | 49.1 | |
| Sand Fraction | 58.1 | 45.0 | 30.3 | |
| Sand & Gravel Fraction | 27.6 | 7.9 | 00.0 | |
| Upper | ||||
| Coarse Fraction | 59.4 | 46.3 | 31.0 | |
| Sand Fraction | 53.4 | 35.5 | 17.7 | |
| Sand & Gravel Fraction | 21.5 | 00.0 | 00.0 | |
| Lower | ||||
| Coarse Fraction | 82.9 | 70.7 | 58.0 | |
| Sand Fraction | 72.9 | 52.1 | 35.0 | |
| Sand & Gravel Fraction | 35.0 | 10.4 | 00.0 | |
| Western Area | ||||
| Aggregate | ||||
| Coarse Fraction | 72.9 | 60.0 | 51.5 | |
| Sand Fraction | 53.1 | 41.2 | 20.0 | |
| Sand & Gravel Fraction | 42.8 | 23.9 | 00.0 | |
| Upper | ||||
| Coarse Fraction | 54.0 | 43.9 | 34.5 | |
| Sand Fraction | 41.0 | 23.9 | 20.0 | |
| Sand & Gravel Fraction | 30.5 | 17.9 | 00.0 | |
| Lower | ||||
| Coarse Fraction | 91.8 | 81.7 | 66.3 | |
| Sand Fraction | 83.3 | 49.1 | 25.2 | |
| Sand & Gravel Fraction | 54.9 | 25.1 | 2.5 | |
The number of entries on the driller's logs in the WWC-5 forms is taken as the primary measure of log quality. Examination of the WWC-5 records indicates that log quality varies from driller to driller. It is apparent from the records that some of the water-well drilling companies have been more active in the one or the other study areas than some of the other companies. As a result the overall quality of the driller's logs differs from one study area to the other.
Figure 3 shows that the total number of entries per log is slightly greater in the Sheridan than in the Sherman county study areas, if only the logs selected for lithologic analysis are considered. The median number of entries per driller's log is 19 in the Sheridan County study area and only 17 in the Sherman County study area even though the combined Ogallala Formation and Quaternary section thickness is greater in the Sherman than in the Sheridan county study areas. Also, relatively more of the logs from the Sheridan County study area have greater than 30 total entries, whereas more of the logs from the Sherman County study area have fewer than 15 total entries. More of the logs identify multiple lithologies in each log entry from the Sheridan than from the Sherman county study area. The number of log entries is also variable between the upper and the lower halves of the sediment section in each study area (Figure 4). Overall, significantly more effort is spent by the driller describing the drill cuttings from the lower half of the section than from the upper half.
Figure 3. Histograms showing the level of detail in the WWC-5 driller's logs and the test hole logs of the Kansas Geological Survey in the Sheridan and Sherman county study areas.
Figure 4. Comparison of the level of detail used to describe the sediments in the upper and lower halves of the combined Ogallala Formation-undifferentiated Quaternary sequence in the Sheridan and Sherman county study areas.
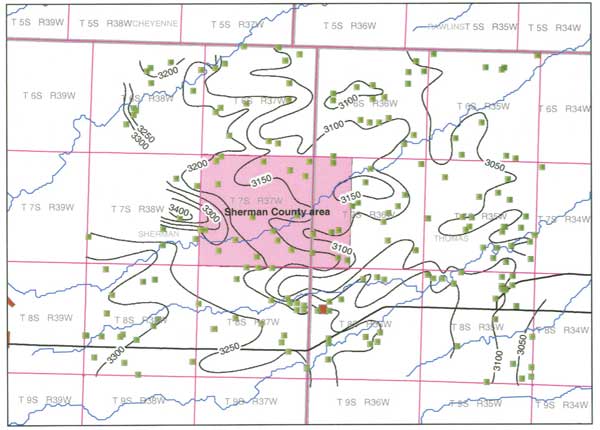
Bedrock surface topography: The regional slope of the bedrock surface is from southwest to northeast across the study area at about 12 ft/mi (Figure 5). Local relief near the incised paleovalleys may exceed 200 ft/mi in some areas. The bedrock elevation map shows a major paleodrainage between the Middle and South Forks of Sappa Creek and between Beaver Creek and the South Fork of Sappa Creek. These are separated by a buried paleotopographic high in the bedrock in the eastern part of T. 7 S., R. 38 W.
Figure 5. The bedrock surface elevation in the Sherman County study area. The complete figure (with legend) is available in a larger PDF format.
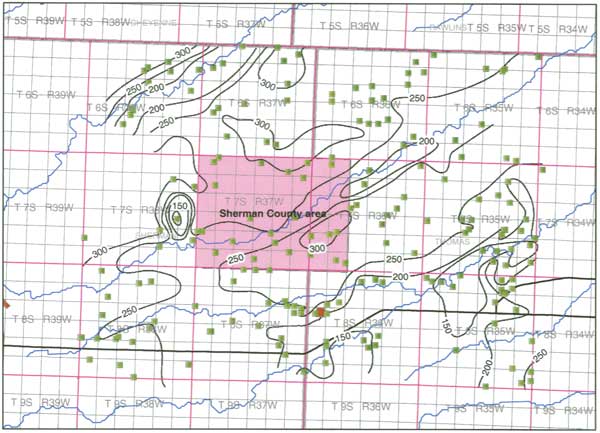
Total sediment thickness: The combined thickness of the Ogallala and overlying Quaternary sediments ranges from less than 100 ft up to more than 300 ft and is directly related to the bedrock and land surface topographies (Figure 6). Thicker deposits are found in uplands away from the modern drainages, whereas thinner deposits are present in the vicinity of the modern drainage and over paleotopographic highs in the bedrock.
Figure 6. The combined Ogallala Formation-undifferentiated Quaternary thickness in the Sherman County study area. The complete figure (with legend) is available in a larger PDF format.
Sand, sand & gravel, and coarse fractions: Mean, median, and standard deviations of the aggregate, upper, and lower sand, sand & gravel, and total coarse (sand + sand & gravel) as fractions of total thickness and as total thickness are tabulated in Tables 5 and 7. Histograms of the various lithologic fractions for each location in the Sherman County study area are presented in Figures 7-12. In general, the mean and median values of the coarse fraction are higher for the lower half of the combined Ogallala and Quaternary sections than for the upper half. For both the upper and the lower halves the sand fraction constitutes the bulk of the coarse fraction of the sediments typically. However, sand and sand & gravel contents are highly variable. Sand content ranges from less than 5% up to 65% and from less than 5% up to 100% in the upper and lower halves, respectively. Sand & gravel content exhibits a similar range of values. The mean and median values of sand content of the lower half are higher than the values in the upper half. The difference in the sand & gravel content mean and median between the upper and lower halves of the section is within the range of uncertainty of the calculations. The distributions of aggregate, upper, and lower sand & gravel, and total coarse thickness and fractions are presented in Figures 13-17. Figures 13 and 17 show that the aggregate and lower half coarse fractions are greatest in the vicinity of Brewster and in the area north of town in the east central part of T. 7 S., R. 37 W., and the least in T. 6 S., R. 35-36 W. The higher coarse fractions and the occurrence of gravel might be associated with the paleodrainage, but the data are too sparsely distributed to determine association with any confidence.
Table 5. Sand, sand & gravel, and coarse fractions in the Ogallala Formation and overlying Quaternary sediments expressed as fractions of thickness in the western study area based on 69 driller's logs.
| Aggregate | Upper Half | Lower Half | |||||||
|---|---|---|---|---|---|---|---|---|---|
| Statistic | Sand (%) |
Sand & Gravel (%) |
Coarse (%) |
Sand (%) |
Sand & Gravel (%) |
Coarse (%) |
Sand (%) |
Sand & Gravel (%) |
Coarse (%) |
| Minimum | 1.4 | 0 | 20.5 | 0 | 0 | 10.8 | 0 | 0 | 37.5 |
| Maximum | 78.1 | 63.0 | 88.1 | 63.5 | 60.3 | 78.2 | 100 | 84.2 | 100 |
| Mean | 38.6 | 23.0 | 61.5 | 26.0 | 18.0 | 44.1 | 52.2 | 27.3 | 79.5 |
| Median | 41.2 | 24.0 | 60.4 | 24.3 | 18.8 | 43.9 | 49.5 | 25.3 | 81.9 |
| Standard Deviation |
20.8 | 18.9 | 11.48 | 17.2 | 16.4 | 14.2 | 29.6 | 25.8 | 13.6 |
Table 6. Sand, sand & gravel, and coarse fractions in the Ogallala Formation and overlying Quaternary sediments expressed as fractions of thickness in the eastern study area based on 181 driller's logs.
| Aggregate | Upper Half | Lower Half | |||||||
|---|---|---|---|---|---|---|---|---|---|
| Statistic | Sand (%) |
Sand & Gravel (%) |
Coarse (%) |
Sand (%) |
Sand & Gravel (%) |
Coarse (%) |
Sand (%) |
Sand & Gravel (%) |
Coarse (%) |
| Minimum | 0 | 0 | 16.7 | 0 | 0 | 4.3 | 0 | 0 | 23.2 |
| Maximum | 85.3 | 76.1 | 85.3 | 87.0 | 58.7 | 87.0 | 100 | 93.4 | 100 |
| Mean | 44.1 | 13.8 | 57.9 | 35.9 | 9.7 | 45.7 | 52.3 | 17.8 | 70.1 |
| Median | 45.1 | 8.0 | 58.3 | 35.6 | 0 | 47.0 | 56.7 | 10.1 | 71.1 |
| Standard Deviation |
17.3 | 16.2 | 11.6 | 19.3 | 13.9 | 16.1 | 22.1 | 21.1 | 14.2 |
Table 7. Total thickness of sand, sand & gravel, and coarse fractions in the Ogallala Formation and overlying Quaternary sediments in the western study area based on 69 driller's logs.
| Aggregate | Upper Half | Lower Half | |||||||
|---|---|---|---|---|---|---|---|---|---|
| Statistic | Sand (ft) |
Sand & Gravel (ft) |
Coarse (ft) |
Sand (ft) |
Sand & Gravel (ft) |
Coarse (ft) |
Sand (ft) |
Sand & Gravel (ft) |
Coarse (ft) |
| Minimum | 3.1 | 0 | 42.4 | 0 | 0 | 14.7 | 0 | 0 | 47.4 |
| Maximum | 232.2 | 108.6 | 232.2 | 91.6 | 79 | 97.2 | 158.5 | 108.6 | 158.5 |
| Mean | 93.3 | 33.6 | 126.9 | 31.4 | 22.0 | 53.4 | 62.6 | 33.6 | 96.2 |
| Median | 86.8 | 27.4 | 132.4 | 28.2 | 20.5 | 52.4 | 63.1 | 27.4 | 101.2 |
| Standard Deviation |
52.8 | 32.9 | 37.5 | 21.9 | 20.9 | 19.1 | 36.4 | 32.9 | 23.7 |
Table 8. Total thickness of sand, sand & gravel, and coarse fractions in the Ogallala Formation and overlying Quaternary sediments in the eastern study area based on 181 driller's logs.
| Aggregate | Upper Half | Lower Half | |||||||
|---|---|---|---|---|---|---|---|---|---|
| Statistic | Sand (ft) |
Sand & Gravel (ft) |
Coarse (ft) |
Sand (ft) |
Sand & Gravel (ft) |
Coarse (ft) |
Sand (ft) |
Sand & Gravel (ft) |
Coarse (ft) |
| Minimum | 0 | 0 | 36 | 0 | 0 | 4.5 | 0 | 0 | 23 |
| Maximum | 173.8 | 113.6 | 190.2 | 86 | 66 | 86.9 | 115.9 | 104.2 | 122.2 |
| Mean | 84.1 | 20.1 | 113.1 | 33.7 | 10.3 | 44.0 | 50.4 | 18.7 | 69.1 |
| Median | 83 | 11.4 | 112.4 | 34.4 | 0 | 43 | 50.3 | 11 | 67.4 |
| Standard Deviation |
34.9 | 25.0 | 32.4 | 17.9 | 15.3 | 16.6 | 23.4 | 23.3 | 21.5 |
Figure 7. Driller's and test-hole log aggregate thickness of sand, sand and gravel, and coarse fractions in the Sherman County study area.
Figure 8. Driller's and test-hole log thickness of sand, sand and gravel, and coarse fractions in the upper half of the combined Ogallala Formation-undifferentiated Quaternary in the Sherman County study area.
Figure 9. Driller's and test-hole log thickness of sand, sand and gravel, and coarse fractions in the lower half of the combined Ogallala Formation-undifferentiated Quaternary in the Sherman County study area.
Figure 10. Aggregate sand, sand and gravel, and coarse fractions as a percent of the total thickness of the combined Ogallala Formation-undifferentiated Quaternary in the Sherman County study area.
Figure 11. Sand, sand and gravel, and coarse fractions as a percent of the total thickness of the upper half of the combined Ogallala Formation-undifferentiated Quaternary in the Sherman County study area.
Figure 12. Sand, sand and gravel, and coarse fractions as a percent of the total thickness of the [lower] half of the combined Ogallala Formation-undifferentiated Quaternary in the Sherman County study area.
Figure 13. The total thickness of coarse fraction sediments in the Sherman County study area. The complete figure (with legend) is available in a larger PDF format.
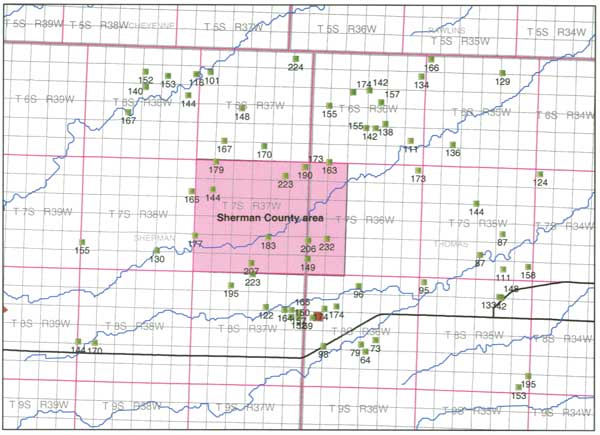
Figure 14. The sand and gravel fraction percentiles in the upper half of the combined Ogallala Formation-undifferentiated Quaternary, Sherman County study area. The complete figure (with full legend) is available in a larger PDF format.
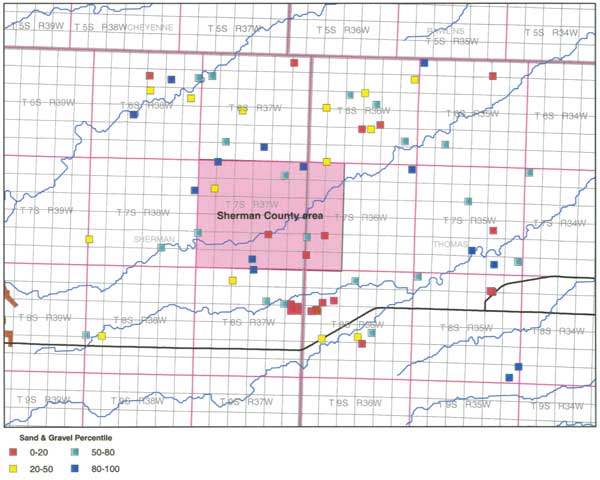
Figure 15. The coarse fraction percentiles in the upper half of the combined Ogallala Formation-undifferentiated Quaternary, Sherman County study area. The complete figure (with full legend) is available in a larger PDF format.
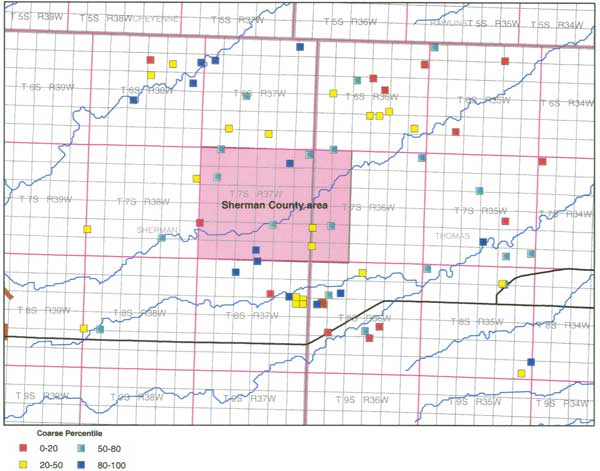
Figure 16. The sand and gravel fraction percentiles in the lower half of the combined Ogallala Formation-undifferentiated Quaternary, Sherman County study area. The complete figure (with full legend) is available in a larger PDF format.
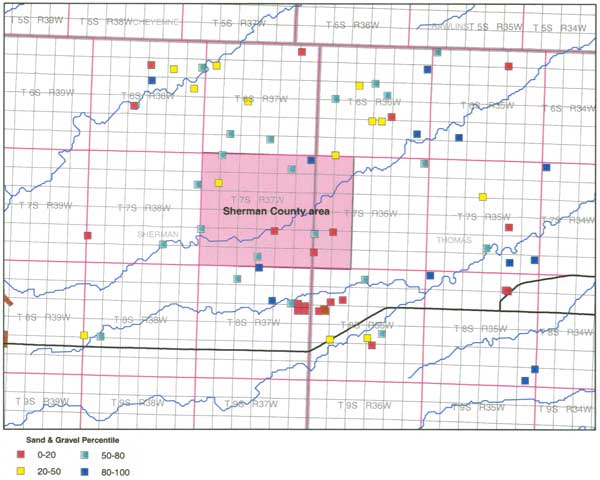
Figure 17. The coarse fraction percentiles in the lower half of the combined Ogallala Formation-undifferentiated Quaternary, Sherman County study area. The complete figure (with full legend) is available in a larger PDF format.
The occurrence of caliche and cemented sand intervals: Figure 18 is a comparison of the number of reported caliche and cemented sediment layers in the upper and the lower halves of the combined Ogallala and Quaternary sections. The diagonal line represents an equal distribution in the upper and lower halves. The graph shows that more of the logs plot above the line than below the line, which indicates a greater occurrence of these layers in the lower half of the section than in the upper half.
Figure 18. Number of occurrences of caliche and cemented sand layers reported in the driller's and test hole logs in the upper and lower half of the combined Ogallala Formation-undifferentiated Quaternary in the Sherman County study area.
Sheridan County Study Area Bedrock surface topography: Pierre Shale underlies the western two thirds of the study area and the uppermost Smoky Hill Chalk Member (Niobrara Chalk) underlies the eastern third (Merriam and Frye, 1954; Merriam, 1963). The boundary separating the Niobrara Chalk from the overlying Pierre Shale is gradational and is placed at the stratigraphic horizon above which all of the shale is non calcareous (Hattin, 1982). No attempt was made to map this contact using the WWC-5 logs. The bedrock surface is highly dissected by an incised, eastward flowing paleodrainage (Figure 19). This "badlands"-type subsurface topography is typical of the topography of the present-day land surface in the Smoky Hill Chalk outcrop belt in western Kansas (Merriam, 1963; Hattin, 1982). The slope of the bedrock surface is eastward at approximately 15 ft/mi. Local relief is commonly 200 ft/mi or more near incised bedrock channels. However, the regional slope and local relief on the bedrock surface appear to be less in the western third of the study area.
Figure 19. The bedrock surface elevation in the Sheridan County study area County study area. The complete figure (with legend) is available in a larger PDF format.
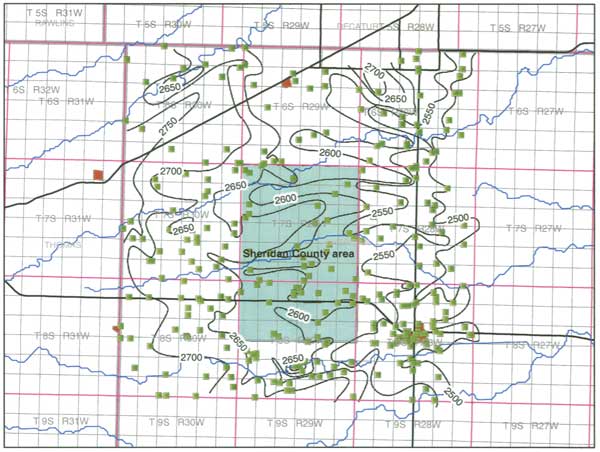
Total sediment thickness: The combined thickness of the Ogallala and overlying Quaternary sediments ranges from less than 100 ft up to more than 250 ft and is related to the bedrock and land surface topographies (Figure 20). As in the Sherman County study area, thicker deposits are found in uplands away from the modern drainages and bedrock lows, whereas thinner deposits are present in the vicinity of the modern drainage and over bedrock highs.
Figure 20. The combined Ogallala Formation-undifferentiated Quaternary thickness in the Sheridan County study area. The complete figure (with legend) is available in a larger PDF format.
Sand, sand & gravel and coarse fractions: Mean, median, and standard deviations of the aggregate, upper, and lower sand, sand & gravel, and total coarse (sand + sand & gravel) as total thickness fractions and as total thickness are tabulated in Tables 6 and 8. Histograms of the various lithologic thickness and fractions at each location in the Sheridan County study area are presented in Figures 21-26. As in the Sherman County study area, the mean and median values suggest that the coarser sediments account for a greater percentage of the lower half of the combined Ogallala and Quaternary sections than the upper half in most cases. For both the upper and the lower halves the sand fraction constitutes the bulk of the coarse fraction of the sediments. However, sand and sand & gravel contents are highly variable. Sand content ranges from less than 5% up to 87% and from less than 5% up to 100% in the upper and lower halves, respectively. Sand & gravel content exhibits a similar range of values. The mean and median values of sand content of the lower half are higher than the values in the upper half. As in the Sherman County study area, the difference in the sand & gravel content mean and median between the upper and lower halves of the section is within the range of uncertainty of the calculations.
Figure 21. Aggregate sand, sand and gravel, and coarse sediment thickness in the combined Ogallala Formation-undifferentiated Quaternary in the Sheridan County study area.
Figure 22. Aggregate sand, sand and gravel, and coarse sediment thickness in the upper half of the combined Ogallala Formation-undifferentiated Quaternary in the Sheridan County study area.
Figure 23. Aggregate sand, sand and gravel, and coarse sediment thickness in the lower half of the combined Ogallala Formation-undifferentiated Quaternary in the Sheridan County study area.
Figure 24. Sand, sand and gravel, and coarse fraction as a percent of the total thickness of the combined Ogallala Formation-undifferentiated Quaternary in the Sheridan County study area.
Figure 25. Sand, sand and gravel, and coarse fraction as a percent of the upper half thickness of the combined Ogallala Formation-undifferentiated Quaternary in the Sheridan County study area.
Figure 26. Sand, sand and gravel, and coarse fraction as a percent of the lower half thickness of the combined Ogallala Formation-undifferentiated Quaternary in the Sheridan County study area.
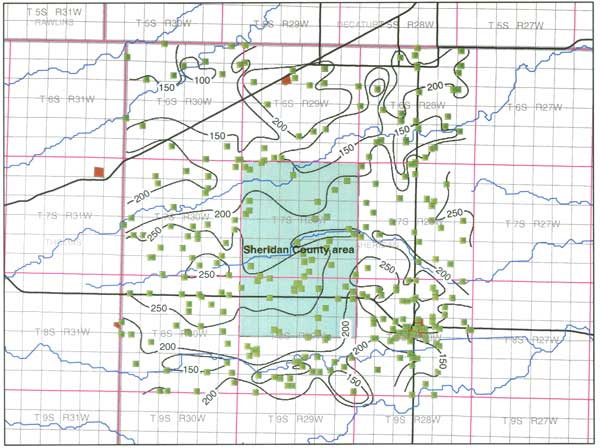
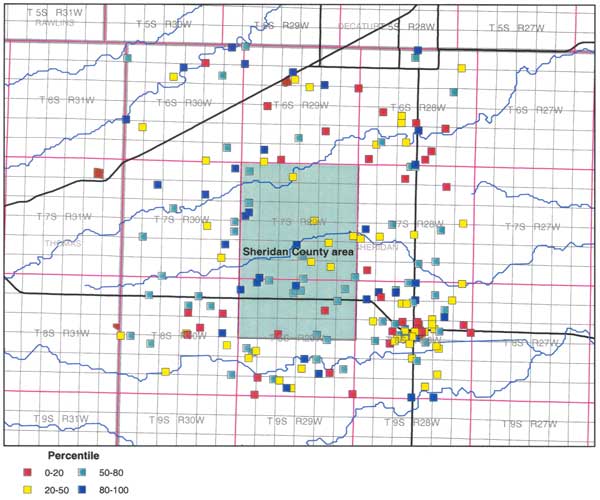
Spatial variation in sediment fractions: Across the study area the distribution of aggregate coarse fraction percentiles is highly variable (Figure 27). This apparent randomness is most likely a reflection of fluvial and eolian deposition and erosional processes that produced these deposits (Gutentag et al., 1984). Postings of the percentiles for the upper and lower halves of the combined Ogallala and Quaternary sequence on maps of the Sheridan County study area provide better definition of areas where coarse sediments are more or less dominant (Figures 28-31). In the lower half the coarse fraction is higher in the study area along the boundary between T. 7 S. and T. 8 S. This trend seems to follow an incised east-west bedrock channel south of South Bow Creek. The sand and gravel fraction accounts for a significant part of the coarse fraction in this area and review of the driller's logs confirms that gravel is reported at or near the base of the Ogallala. This change in lithology represents a fining upward trend in the lower half of the sequence as part of the paleovalley fill. To the north in T. 7 S., R. 30 W. and T. 7 S., R. 29 W. the higher coarse fraction seems to be associated with another part of the paleodrainage and gravels are present near the base of the section. Gravel occurrence as evidenced by the distribution of sand and gravel, also follows these trends (Figure 30). Further north in the southern part of T. 6 S., R. 28-29 W. the coarse fraction in the lower half is relatively low. This is flanked by an east-west coarser sediment trend that extends from Prairie Dog Creek eastward to area around Seldon in T. 6 S., R. 29 W. In the upper half of the combined Ogallala and Quaternary sequence, coarse sediments dominate the section in the southern third of T. 6 S., R. 28 W.; at many localities around Hoxie; and along the South Fork of the Solomon River in the southern part of T. 8 S., R. 29 W., and west central T. 8 S., R. 30 W.
Figure 27. The total thickness of coarse fraction sediments in the Sheridan County study area. The complete figure (with legend) is available in a larger PDF format.
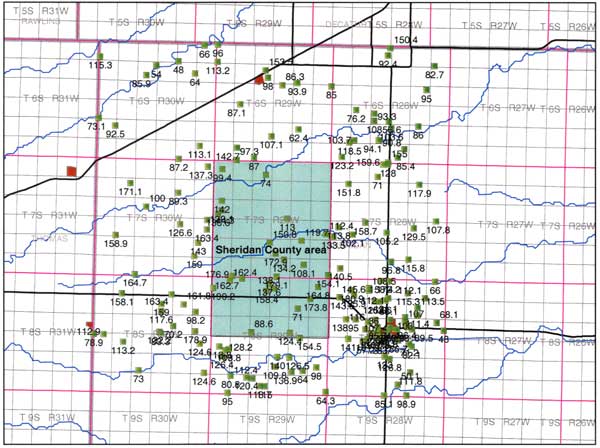
Figure 28. The sand and gravel fraction percentiles in the upper half of the combined Ogallala Formation-undifferentiated Quaternary, Sheridan County study area. The complete figure (with legend) is available in a larger PDF format.
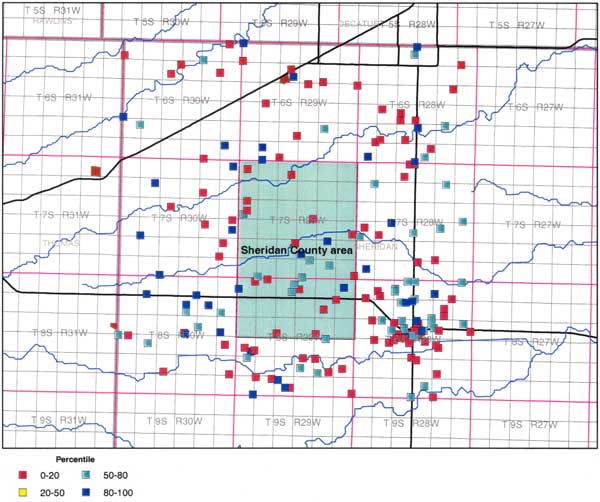
Figure 29. The coarse fraction percentiles in the upper half of the combined Ogallala Formation-undifferentiated Quaternary, Sheridan County study area. The complete figure (with legend) is available in a larger PDF format.
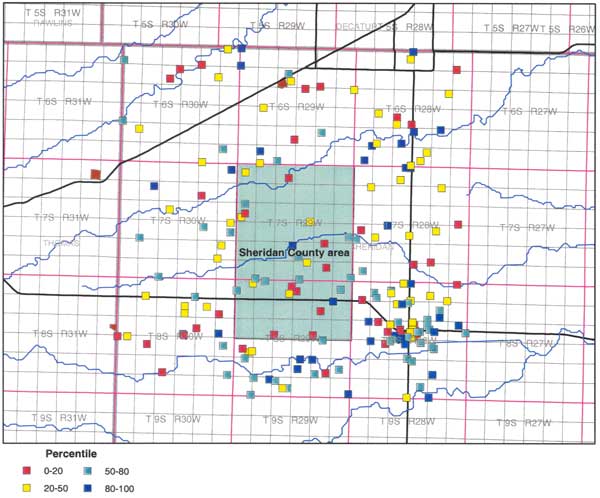
Figure 30. The sand and gravel fraction percentiles in the lower half of the combined Ogallala Formation-undifferentiated Quaternary, Sheridan County study area. The complete figure (with legend) is available in a larger PDF format.
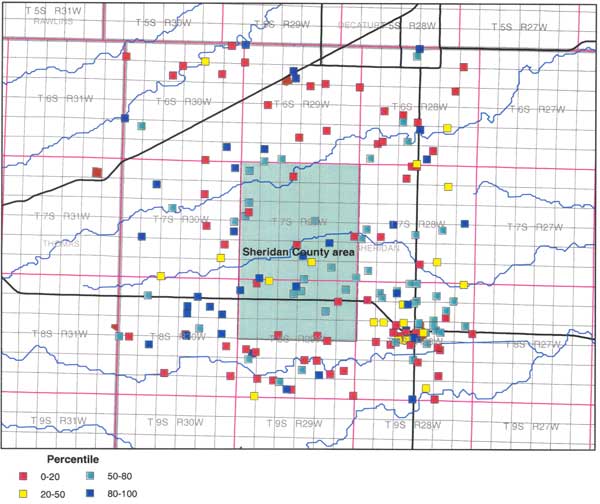
Figure 31. The coarse fraction percentiles in the lower half of the combined Ogallala Formation-undifferentiated Quaternary, Sheridan County study area. The complete figure (with legend) is available in a larger PDF format.
The occurrence of caliche and cemented sand intervals: Figure 32 is a comparison of the number of reported caliche and cemented sediment layers in the upper and the lower halves of the combined Ogallala and Quaternary sections. The graph shows that slightly more of the logs plot above the line than below the line, which indicates slightly greater occurrence of these layers in the lower half of the section than in the upper half overall.
Figure 32. Number of occurrences of caliche and cemented sand layers reported in the driller's and test hole logs in the upper and lower half of the combined Ogallala Formation-undifferentiated Quaternary in the Sheridan County study area.
Comparison between the aggregate coarse fraction percentage histograms reveals little difference between the combined Ogallala and Quaternary sections in each of the areas investigated (Figure 33). Furthermore, there appears to be little significant lithologic difference between the study areas if the coarse fractions in both the upper and lower halves of the combined section are used as the basis for comparison (Figure 34). However, when the total thickness is considered, differences between the sediment sections in the two study areas are magnified and it is apparent that the total coarse sediment thickness in the lower half is noticeably thicker in the Sherman than in the Sheridan county area (Figure 35). Differences in the coarse sediment thickness in the lower half of the section between the Sherman and Sheridan county study areas could play a significant role in the rate of water-level decline in both areas.
Figure 33. Box plot comparison between the Sherman and Sheridan county study area agregate coarse fractions. Each box plot summarizes a distribution by taking note of its percentile values and outliers below the 10th percentile and above the 90th percentile. In the box plot, the horizontal lines represent, from bottom to top, the 10th, 25th, 50th, 75th, and 90th percentiles. Data points falling below the 10th and above the 90th percentiles are shown as circles.
Figure 34. Box plot comparison between the Sherman and Sheridan county study area upper and lower half coarse fractions. Each box plot summarizes a distribution by taking note of its percentile values and outliers below the 10th percentile and above the 90th percentile. In the box plot, the horizontal lines represent, from bottom to top, the 10th, 25th, 50th, 75th, and 90th percentiles. Data points falling below the 10th and above the 90th percentiles are shown as circles.
Figure 35. Box plot comparison between the Sherman and Sheridan county study area lower half coarse total thickness. Each box plot summarizes a distribution by taking note of its percentile values and outliers below the 10th percentile and above the 90th percentile. In the box plot, the horizontal lines represent, from bottom to top, the 10th, 25th, 50th, 75th, and 90th percentiles. Data points falling below the 10th and above the 90th percentiles are shown as circles.
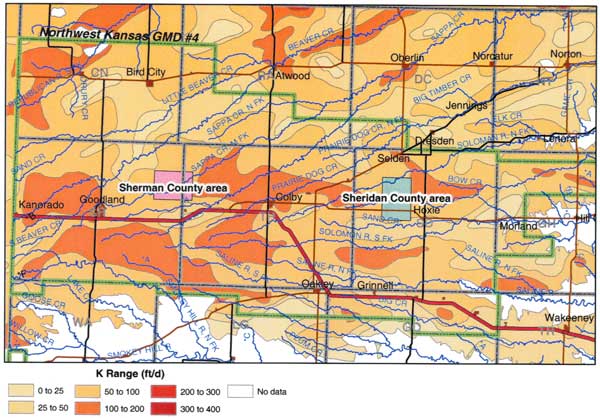
Cederstrand and Decker (1998a, b) developed 1:1,000,000 scale digital contour maps of specific yield and hydraulic conductivity for the High Plains aquifer. The maps are based on the Gutentag et al. (1984) regionalized vertically averaged estimates of these parameters developed from an analysis of several thousand driller's logs of the predevelopment water-saturated aquifer. The Sherman, Thomas, and Sheridan county portions of the hydraulic conductivity and specific yield maps are shown in Figures 36-37. In the two study areas, the predevelopment saturated thickness is approximately equal to or less than the High Plains aquifer lower-half thickness (Schloss et al., 2000). Gutentag et al. estimated hydraulic conductivity and specific yield from parameter values assigned to sediment textures found in the Ogallala. Thus, where the Ogallala is coarser and better sorted, the hydraulic conductivity and specific yield is expected to be higher than where the aquifer framework is finer grained and poorly sorted. Overall, the maps compare poorly with the areas in the Sheridan County study area where the coarse fraction appears to be the highest in the lower half of the High Plains aquifer. However, the maps show similar trends in at least one part of the Sheridan County study area. The regional maps display elongate east-west zones of higher and lower hydraulic conductivity and west southwest-east northeast trending zones of higher and lower specific yield. In the Sheridan County study area, the coarse fraction is much greater along the T. 7 S.-T. 8 S. boundary and thus seems to extend eastward into Sheridan County the trend of higher hydraulic conductivity in eastern Thomas County (Figures 30, 31, and 37).
Figure 36. Spatial distribution of specific yield within the Ogallala portion of the High Plains aquifer Northwest Kansas Groundwater Management District 4 (from Cederstrand and Becker, 1998b). The complete figure (with legend) is available in a larger PDF format.
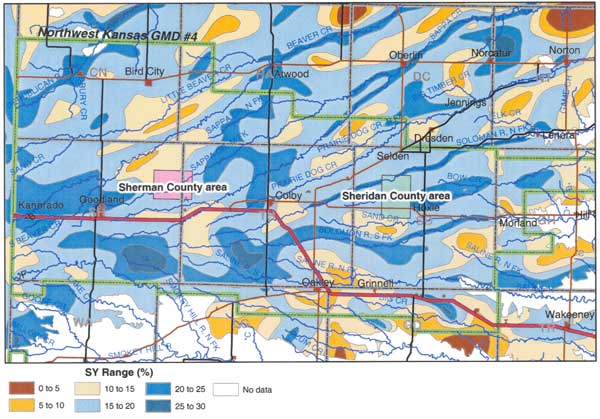
Figure 37. Spatial distribution of hydraulic conductivity within the Ogallala portion of the High Plains aquifer Northwest Kansas Groundwater Management District 4 (from Cederstrand and Becker, 1998b). The complete figure (with legend) is available in a larger PDF format.
This project was undertaken to characterize the Ogallala portion of the High Plains aquifer in two township-scale study areas within the Northwest Kansas GMD 4 and thus provide support for other ongoing Kansas Geological Survey hydrogeologic research projects in these areas. The results of this project reveal that with careful screening, the WWC-5 driller's logs can be a useful resource for aquifer framework characterization. However, as the results of this study have shown, the level of information that can be extracted is limited by the level of detail in the lithologic description and the lack of stratigraphic information contained in these logs and the low density of acceptable data points. Less than 25% of the total number of WWC-5 records available provided an acceptable level of detailed lithologic information. The distribution of data points in both study areas was not sufficient to develop 3-D visualizations of the subsurface lithofacies distribution. On the positive side, the number of WWC-5 records in both study areas was sufficient to produce a reasonably detailed bedrock surface map that could be used to define the paleodrainage.
In both study areas, the High Plains aquifer framework consists of the Ogallala Formation and undifferentiated Quaternary which is a complex consisting of lenses and discontinuous layers of admixtures of gravel, sand, silt, and clay and caliche. The focus in this project was on subsurface mapping of the variations in the proportion and thickness of the coarse, sand, and sand amp; gravel fractions. The coarse fraction is defined as the sum of the sand and the sand & gravel fractions. As a general rule, the greater the proportion of coarse grained deposits, the greater the hydraulic conductivity of the aggregated deposit. Sorting could not be addressed in this project because the degree of sorting was not consistently addressed in the driller's logs. For this project, areas where the coarse fraction is greatest in the lower half are likely to be more permeable than areas where the coarse fraction accounts for less of the lower half thickness.
The total thickness of the deposits above the Cretaceous bedrock surface that form the Ogallala portion of the High Plains aquifer is greater in the Sherman than in the Sheridan county areas. In the aggregate, the coarse fraction proportion (and thickness) is only slightly greater in the Sherman than in the Sheridan county study area. In both areas, the coarse fraction proportion is slightly greater in the lower than in the upper halves of the framework. The smaller coarse fraction proportion in the upper half of the High Plains aquifer framework in both study areas is most likely a reflection of eolian sediments that constitute much of the upper half (Prescott, 1953; Frye, 1945; and Bayne, 1956). In contrast, the lower half of the sequence is fluvial in origin. Inspection of the posted data classified by percentile ranges reveals a complex interfingering of township- to section-scale areas of coarser and finer zones in the upper and lower intervals in the Sheridan County study area. An east-west trend of coarser grained sediments along the T. 7 S.-T. 8 S. boundary and the other coarser grained trends in the lower half of the section in this study area follow the incised paleodrainage in the bedrock. These could reflect deposition by braided (Gutentag et al., 1984) or high-energy ephemeral streams (Gustavson, 1996).
The number of data points in the Sherman County study area was insufficient to make comparisons with the Cederstrand and Becker (1998a, b) regional hydraulic conductivity and specific yield maps. However, one of the trends in the regional hydraulic conductivity map is reflected in the posted data for the Sheridan County study area. Other coarser and finer grained areas identified in the Sheridan County study area are not reflected in the regional hydraulic conductivity map. No similarity could be found between the posted data in the Sheridan County study area and the regional map of specific yield. The patchy areas of similarity between the USGS hydraulic conductivity map and the map of the percent coarse fraction percentiles for the lower half of the sequence in the Sheridan County study area are not surprising. The USGS map is regional in scope and is based on a small sample of the available data from each of the High Plains aquifer states.
The results from this study suggest that the definition of aquifer subunits can be improved by careful analysis of the driller's logs from the WWC-5 record and KGS test-hole log data base. Inclusion of the bedrock elevation data from the WWC-5 records will more accurately portray the distribution of saturated thickness. The mapping of the boundaries separating more permeable from less permeable zones would also benefit by including more of the driller's log information from the WWC-5 records at the aquifer subunit level.
Bayne, C.K., 1956, Geology and ground-water resources of Sheridan County, Kansas: Kansas Geological Survey, Bulletin 116, 94 p. [available online]
Bayne, C.K., and O'Connor, H.G., 1968, Tertiary System, in Zeiler, D.E. (ed.) The Stratigraphic Succession in Kansas: Kansas Geological Survey, Bulletin 168, pp. 58-59. [available online]
Breyer, J., 1975, The classification of Ogallala sediments in western Nebraska, in Studies on Cenozoic Paleontology and Stratigraphy, Claude W. Hibbard Memorial, v. 3: Museum of Paleontology, University of Michigan, Papers on Paleontology no. 12, pp. 1-8.
Cederstrand, J.R., and Becker, M.F., 1998a, Digital map of specific yield for the High Plains aquifer in parts of Colorado, Kansas, Nebraska, New Mexico, Oklahoma, South Dakota, Texas, and Wyoming: U.S. Geological Survey, Open-file Report 98-414, 1 sheet.
Cederstrand, J.R., and Becker, M.F., 1998b, Digital map of hydraulic conductivity for the High Plains aquifer in parts of Colorado, Kansas, Nebraska, New Mexico, Oklahoma, South Dakota, Texas, and Wyoming: U.S. Geological Survey, Open-file Report 98-548, 1 sheet.
Frye, J.C., 1945, Geology and groundwater resources of Thomas County, Kansas: Kansas Geological Survey, Bulletin 59, 110 p. [Available online]
Frye, J.C., Leonard, A.B., and Swineford, A., 1956, Stratigraphy of the Ogallala formtion (Neogene) of northern Kansas: Kansas Geological Survey, Bulletin 118, 92 p.
Gustavson, T.C., 1996, Fluvial and eolian depositional systems, paleosols, and paleoclimate of the upper Cenozoic Ogallala and Blackwater Draw formations, southern High Plains, Texas and New Mexico: Texas Bureau of Economic, Geology Report of Investigations No. 239, 62 p.
Gutentag, E.D., Heimes, F.J., Krothe, N.C., Luckey, R.R., and Weeks, J.B., 1984, Geohydrology of the High Plains aquifer in parts of Colorado, Kansas, Nebraska, New Mexico, Oklahoma, South Dakota, Texas, and Wyoming: U.S. Geological Survey, Professional Paper 1400-B, 63 p. [available online]
Hattin, D.E., 1982, Stratigraphy and depositional environment of Smoky Hill Chalk Member, Niobrara Chalk (Upper Cretaceous) of the type area, western Kansas: Kansas Geological Survey, Bulletin 225, 108 p. [available online]
Hecox, G.R., Macfarlane, P.A., and Wilson, B.B., 2002, Calculation of yield for High Plains wells--relationship between saturated thickness and well yield: Kansas Geological Survey, Open-file Report 2002-25C, 29 p.
Macfarlane, P.A., 2000, Revisions to the nomenclature for Kansas aquifers: Kansas Geological Survey, Bulletin 244, pt. 2, 14 p. [available online]
Merriam, D.F., and Frye, J.C., 1954, Additional studies of the Cenozoic in western Kansas: Kansas Geological Survey, Bulletin 109, pt. 4, pp. 49-64. [available online]
Merriam, D.F., 1963, The geologic history of Kansas: Kansas Geological Survey, Bulletin 162, 317 p. [available online]
Merriam, D.F., (compiler), 2003, The geologic record in Kansas: Kansas Geological Survey, 1 sheet.
Miall, A.D., 1996, The geology of fluvial deposits: Berlin, Springer-Verlag, 582 p.
Prescott, G.C., 1953, The geology and ground-water resources of Sherman County, Kansas: Kansas Geological Survey, Bulletin 105, 130 p. [available online]
Ross, J.A., 1991, Geologic map of Kansas: Kansas Geological Survey, Map M-23, 1 sheet.
Schloss, J.A., Buddemeier, R.W., and Wilson, B.B., (editors), 2000, An atlas of the High Plains aquifer: Kansas Geological Survey, Educational Series 14, 92 p.
Schultz, G.E., 1977, The Ogallala formation and its vertebrate faunas in the Texas and Oklahoma panhandles, in Schultz, G.E., (ed.), Field Conference on Late Cenozoic Biostratigraphy of the Texas Panhandle and Adjacent Oklahoma, August 4-6, 1977 Guidebook: West Texas State University, Department of Geology and Anthropology, Kilgore Research Center, Special Publication no. 1, p. 5-104.
Seni, S.J., 1980, Sand-body geometry and depositional systems, Ogallala formation, Texas: Texas Bureau of Economic Geology, Report of Investigations 105, 36 p.
Stullken, L.E., Watts, K.R., and Lindgren, R.J., 1985, Geohydrology of the High Plains aquifer, western Kansas: U.S. Geological Survey, Water-Resources Investigations Report 85-4198. 86 p. [available online]
Kansas Geological Survey, Geohydrology
Placed online Feb. 22, 2006, original report dated Feb. 2003
Comments to webadmin@kgs.ku.edu
The URL for this page is http://www.kgs.ku.edu/Hydro/Publications/2003/OFR03_14/index.html