![]()
Prev Page--Geology || Next Page--Well Records
Ground Water
Source
The following discussion on the source and occurrence of ground water has been adapted from Meinzer (1923) and the reader is referred to his report for a complete discussion of the subject.
Water that occurs in the pores or openings of the rocks and within the zone of saturation is called ground water. The amount of ground water below the surface in any region and the manner and rate of its movement to wells depend on the nature of the rocks in the region.
In Sheridan County, as well as other parts of northwestern Kansas, ground water is derived almost entirely from precipitation. A part of the water that falls as rain or snow becomes surface runoff; part evaporates directly into the air; and part is absorbed by plants and transpired into the air. The rest percolates downward through the soil and underlying strata until it reaches the water table where it becomes ground water. Estimates of the amount of water entering the ground-water reservoir in northwestern Kansas each year range from 0.1 to 0.5 inch. Although this is a relatively small percentage of the total annual precipitation, it should be noted that 0.25 inch of water entering the ground-water reservoir amounts to more than 13 acre-feet per square mile and more than 11,600 acre-feet in the entire county.
Ground water moves slowly through the rocks in directions determined by the shape and slope of the water table, which are controlled by topography, local variations in quantities of recharge and discharge, and the lithology and structure of the rocks. The water moves down gradient and is eventually discharged through wells and springs, through seeps along valley walls or into the streams, or by evaporation or transpiration in areas where the water table is near the ground surface. Most of the water that is obtained from wells in Sheridan County comes from precipitation within the county and in adjacent areas particularly to the west.
Occurrence
Nearly all rocks that underlie the earth's surface at depths shallow enough to be penetrated by drilling contain voids or interstices, which range in size from microscopic openings to large caverns developed in some limestones. The percentage of the volume of the rock mass consisting of such open spaces is known as the porosity of the rock. Although it is desirable to know the porosity of the rock when considering the availability of ground water in a given area, it is not the porosity but the permeability of the material that determines the rate at which water can move through it. The permeability of an aquifer is determined by the size, shape, and arrangement of the openings in that aquifer. Beds of silt may have a high porosity but openings so small that the water cannot move freely through them and therefore the permeability is low. Limestone with large but poorly connected openings may likewise have a high porosity but low permeability. Several common types of openings or interstices in relation to texture and porosity are shown in Figure 6.
Figure 6--Diagram showing several types of rock interstices and the relation of rock texture to porosity. A, Well-sorted sedimentary deposit having high porosity; B, poorly sorted sedimentary deposit having low porosity; C, well-sorted sedimentary deposit consisting of pebbles that are themselves porous, so that the deposit as a whole has a very high porosity; D, well-sorted sedimentary deposit whose porosity has been diminished by the deposition of mineral matter in the interstices; E, rock rendered porous by solution; F, rock rendered porous by fracturing. (From O.E. Meinzer.)
Permeability of the Water-bearing Materials
The rate of movement of ground water is determined by the size, shape, quantity, and degree of connection of the interstices and by the hydraulic gradient. The capacity of a water-bearing material for transmitting water under hydraulic head is its permeability. The field coefficient of permeability may be expressed in Meinzer's units as the rate of flow of water, in gallons a day, through a cross-sectional area of one square foot under a hydraulic gradient of 100 percent at the prevailing temperature of the ground water. The coefficient of transmissibility is a similar measure and is defined as the number of gallons of water a day transmitted through each 1-foot strip extending the height of the aquifer under a unit hydraulic gradient (Theis, 1935, p. 520). It may also be expressed as the number of gallons of water a day transmitted through each section one mile wide extending the height of the aquifer, under a hydraulic gradient of one foot to the mile. The coefficient of transmissibility is equivalent to the field coefficient of permeability multiplied by the thickness of the aquifer.
The coefficient of permeability of water-bearing materials can be determined in the laboratory (methods summarized by V. C. Fishel in Wenzel, 1942, pp. 56-58) or in the field using any of several methods. The recovery method involving the formula developed by Theis (1935, p. 522) and later described by Wenzel (1942, pp. 94-96) was used in a pumping test on well 8-28-9ab in Sheridan County in the summer of 1952. Results of this test were computed by the Theis recovery formula:
T=[264Qlog10(t/t')] / s'
in which T = coefficient of transmissibility in gallons per day per foot,
Q =pumping rate, in gallons a minute,
t = time since pumping started, in minutes,
t'= time since pumping stopped, in minutes,
s'= residual drawdown at the pumping well, in feet, at time t.
The residual drawdown (s') is computed by subtracting the static (nonpumping) water level from the depth to water level at any time (t') after pumping stops. The proper ratio of log10(t/t'), to s' is determined graphically by plotting log10(t/t') against corresponding values of s'. This procedure is simplified by plotting (t/t') the logarithmic scale and s' on the arithmetic scale of semilogarithmic paper. If log t/t' is taken over one log cycle it will become unity and the equation becomes simply T =264 Q / Δs' in which Δs' is the difference in drawdown (s') over one log cycle.
Well 8-28-9ab, an irrigation well on the farm of A. M. Shatzell, was pumped for approximately 8 hours on October 8, 1952. Measurements of drawdown were made with a tape and an electric gage during the period of pumping, and measurements of recovery were made for a period of nearly 2 hours after the pump was shut down. The well was pumped at an average rate of 403 gallons a minute (determined by a Collins flow gage); at the end of pumping the drawdown was 63 feet and the specific capacity was about 6.4 gallons per minute per foot of drawdown.
The computations for permeability and transmissibility are as follows:
T = (264 x 403) / 2.10 = 50,700 gpd/ft
P = 50,700 / 114 = 445 gpd/sq. ft.
The transmissibility is computed to be about 50,000 gallons per day per foot and the coefficient of permeability, determined by dividing the transmissibility by the thickness of the aquifer (114 feet), is about 450 gallons per day per square foot.
The Water Table and Movement of Ground Water
The water table is defined as the upper surface of the zone of saturation, except where that surface is formed by an impermeable rock. If the upper surface is formed by an impermeable rock, the water will rise in a drill hole to a point where the pressure from the aquifer is equalized. Under such conditions the aquifer is said to be under artesian pressure and the upper surface of the water when it rises in the drill hole is a point on the piezometric surface. The piezometric surface is the surface to which water from a given aquifer will rise under its full head. There may be small local areas in Sheridan County where the water is under slight artesian pressure because the rock at the surface of the zone of saturation is relatively impermeable clay or silt, but these areas are negligible; ground water generally will not rise in a well or drill hole above the level at which it is tapped. The water table is not a level surface but rather a sloping surface having many irregularities caused by differences in permeability or thickness of the aquifer or by unequal additions to or withdrawals from the ground-water reservoir.
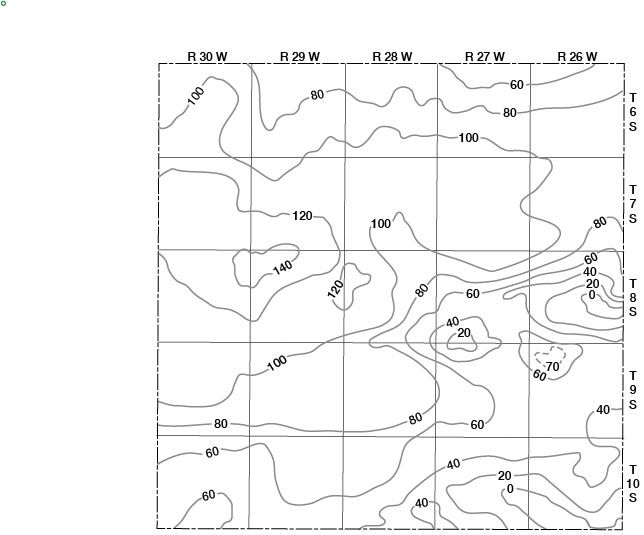
The shape and slope of the water table in Sheridan County are shown on the map (Pl. 1) by means of contour lines drawn on the water table. Each point on the water table along a given contour line has the same altitude. The contour lines show the configuration of the surface of the ground-water body just as topographic contour lines show the configuration of the land surface. The direction of movement of ground water is at right angles to the contour line in the direction of the downward slope. The water-table contour map is generalized and minor variations in the surface of the groundwater body cannot be shown because the wells in Sheridan County are spaced too widely.
The water-table contour map (Pl. 1) shows that the water moves across Sheridan County in a general easterly direction. The minor exceptions probably are caused by variations in recharge, discharge, and topographic conditions. Along the major streams ground water moves toward the valleys and in some places it moves nearly at right angles to the direction of the general movement of ground water. In the upland area where the water-table contours are fairly uniform the water table slopes eastward at the rate of approximately 15 feet per mile. In areas along the edges of the major valleys where the water moves toward the streams, the slope of the water table is as much as 50 feet per mile. The major valleys in the county exert much influence on the shape of the water table. Contours bend upstream along all the streams in the eastern half of the county, indicating that the ground-water reservoir is losing water to the streams. In parts of western Sheridan County the water-table contours bend downstream indicating that the ground-water body is gaining water from the streams. At the point where the contour lines change from bending downstream to upstream, the stream changes from intermittent to perennial. Figure 7 shows the relation between streams and the water table. Streams that lose water to the ground-water reservoir are called influent streams and streams that gain water from the ground-water reservoir are called effluent streams.
Figure 7---Diagrammatic sections showing influent and effluent streams.
The water table does not remain in a stationary position but fluctuates much the same as the water level in a surface reservoir. Precipitation may cause recharge to the ground-water reservoir with the result that the water table will rise. If the rate of discharge of ground water exceeds the rate of recharge the water table will decline. In Sheridan County, as well as in the greater part of northwestern Kansas, these changes in water table are not great. No long-term records of the depth to water in wells in Sheridan County are available, but records of wells in Thomas County show that over a period of about 10 years the water levels there have fluctuated a maximum of about 6 feet.
Recharge and Discharge
Recharge is the addition of water to the ground-water reservoir and may be accomplished in several ways. All ground water in Sheridan County that lies within a practicable drilling depth, which in this report is considered to include the ground water in the Pleistocene and Pliocene deposits, is derived from precipitation either within the county or in adjacent areas to the west. Once the water becomes a part of the ground-water body, it moves in the direction of the slope of the water table to be discharged by wells, into streams, or by evaporation and transpiration in the valleys where the water table is relatively shallow. Some ground water is discharged as underflow into adjacent areas to the east.
Although the normal annual precipitation at Hoxie in Sheridan County is 19.35 inches, only about 0.25 inch of this amount enters the ground-water body as recharge. The depth to the water table exerts an important influence on the quantity of recharge in any given area. Probably the most important factor controlling recharge in Sheridan County is the type of material overlying the water table. The upland areas mantled by thick deposits of Pleistocene loess are relatively impervious and permit very little water to move downward to the water table; hence, the recharge in these areas is relatively small. Along the flanks of the major valleys where permeable beds of the Ogallala formation crop out, recharge probably is considerably greater. In those valleys where the younger valley deposits consist of sandy silt and sand, the permeability is relatively high and the amount of recharge is also high.
In areas where the beds of streams he above the water table there is considerable recharge by infiltration through stream channels during periods of stream runoff. In times of flood when the level of a perennial stream rises above the water table in adjacent alluvial and terrace deposits, some water is added to the ground-water reservoir from the stream, but much of the water may return to the stream after the flood has passed. Farm ponds in the upland areas probably contribute water to the ground-water reservoir, but the quantity is small because of the low permeability of the materials in which the ponds generally are built.
Water moving into the county from the west by means of subsurface inflow is a form of recharge in Sheridan County although the water actually enters the ground-water reservoir outside Sheridan County. The map showing the thickness of saturated Pliocene and Pleistocene sediments (Fig. 8) and the cross sections (Fig. 4) indicate a greater thickness of saturated material on the west side of the county than on the east side. If the permeability of water-bearing materials is everywhere the same, it is apparent that more water enters the county by subsurface flow than leaves the county by this method. This is no doubt true and the difference in quantities of ground water moving into and out of the county are accounted for in part by the discharge of ground water into streams and the resultant gain in flow of streams as they cross the county. The most important factor in accounting for the difference in subsurface inflow and outflow in Sheridan County is the loss of water by evaporation and transpiration in the valleys and along the valley flanks where the water table is relatively shallow and the rates of evaporation and transpiration are high.
Figure 8--Map of Sheridan County showing saturated thickness of Tertiary and Quaternary deposits.
Before wells were drilled in Sheridan County the ground-water reservoir was in a state of approximate equilibrium, that is, the average annual recharge balanced the average annual discharge. Discharge was accomplished primarily by seepage into streams, outflow into adjacent areas, and evaporation and transpiration. Much ground water is now being discharged by wells as they supply water for all domestic and most stock needs. The cities of Hoxie and Selden obtain water from wells, and some ground water is used for irrigation. The discharge of ground water from wells in Sheridan County, however, is small in comparison with the total discharge of ground water.
Recovery
When water is standing in a well, there is an equilibrium between its head and the head of the water in the aquifer outside the well. When the head of the water in the well is reduced by pumping or some other lifting device, the resultant differential head causes the water outside the well to move toward and into the well. When water is pumped from a well, the water level in the well declines and the water table outside the well is lowered to form a depression resembling an inverted cone-the cone of depression. The distance that the water level is lowered is called the drawdown.
The total capacity of a well is the rate at which it will yield water when the water stored in it has been removed. The capacity depends on the thickness and permeability of the aquifer, the amount of water available, and the construction and condition of the well. The capacity of a well is generally expressed in gallons a minute. The specific capacity of a well is its rate of yield for each unit of drawdown and is determined by dividing the yield of the well in gallons a minute by the drawdown in feet.
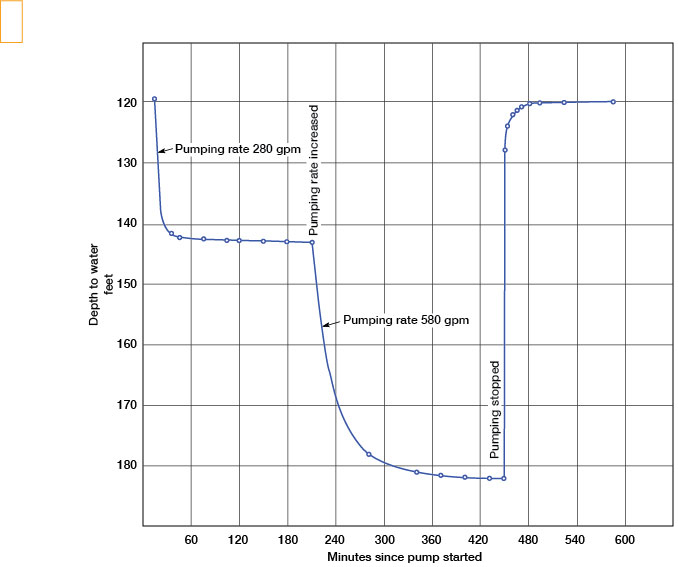
When water is withdrawn from a well at a constant rate, the water level declines rapidly at first and then more slowly until the water level becomes nearly stationary. An increase in the pumping rate will again lower the water level until it again becomes nearly stationary. li"en the pumping of a well is stopped, the water level rises rapidly at first and then more slowly until it eventually reaches or approaches its original position. Curves showing the drawdown and recovery of the water level in well 8-28-9ab during a pumping test are illustrated in Figure 9.
Figure 9--Graph showing the drawdown and recovery of the water level in well 8-28-9ab.
Utilization
Data on 160 wells in Sheridan County were obtained during the course of this investigation. All types of wells in all parts of the county were visited and studied. Ground water in Sheridan County is used chiefly for domestic and stock purposes. Two cities obtain their public water supplies from wells but the quantity of ground water they use is only a small fraction of the total amount of ground water used in the county. Five irrigation plants were observed during this investigation but only one well (8-28-9ab) was in operation during the summer of 1952. Records of wells inventoried during the field work for this report are given in Table 7.
Domestic and Stock Supplies
Nearly all domestic and stock-water supplies in the rural areas in Sheridan County are derived from wells, although a few stockwater supplies are obtained from ponds. Smaller towns in the county that do not have public supplies use water from wells. Analyses of water from typical wells in the area indicate that the water is of good quality although water from some wells is relatively hard. The data for the domestic and stock wells are given in Table 7 and the chemical character of the water is shown in Table 5.
Public Supplies
Two cities in Sheridan County have public water supplies. Hoxie, the county seat, is supplied by two wells at the west edge of the city that yield water from the Ogallala formation. The Hoxie supply has a rated capacity of 800,000 gallons per day and the average daily use is about 300,000 gallons. Water is chlorinated at the wells and receives no other treatment.
Selden pumps water from two wells near the center of the city. The wells obtain water from the Ogallala formation and are 200 feet deep. The wells are spaced about 20 feet apart and only one well is pumped, the other being used as an emergency well in case of mechanical difficulty in the main well. Rated capacities are 140 gallons per minute for the main well and 60 gallons per minute for the "stand by" well. The wells are equipped with turbine pumps powered by electric motors. The average daily use of water at Selden is about 30,000 gallons. The water is of good quality and is not treated.
The city of Grinnell in Gove County has a public water supply derived from a well in Sheridan County. The well obtains water from the Ogallala formation and is 150 feet deep. It is equipped with a turbine pump powered by an electric motor. The average daily use is about 30,000 gallons. The water is of good quality and is not treated.
Data concerning the city-supply wells are given in Table 7.
Irrigation Supplies
A relatively small amount of water is used in Sheridan County for irrigation. Five irrigation wells were observed during the course of this investigation (Table 7) but only one (well 8-28-9ab) was in operation during the summer of 1952. The well is 205 feet deep, has a static water level of 119 feet below land surface, and is equipped with a turbine pump powered by a gasoline engine. During a pumping test, the well yielded 580 gallons per minute with a drawdown of 63 feet. The specific capacity of the well was 9.2 gallons per minute per foot of drawdown. The well is used to irrigate about 140 acres.
Two of the irrigation wells observed in the county (6-27-3dd and 10-29-20cc) obtain water from both the Ogallala formation and from Pleistocene deposits; the others obtain water entirely from the Ogallala formation. The chemical analyses of water from typical wells in the county indicate that the water is suitable for irrigation use (Table 3).
Availability of Ground Water for Future Irrigation Development
The availability of ground water for future development of irrigation in Sheridan County is determined by the geology and hydrology of the area. The amount of water available for irrigation depends on the permeability, areal extent, and thickness of the water-bearing materials. The areal extent and thickness of the water-bearing materials in Sheridan County are shown in Figure 8 by means of contours. This map was prepared by superposing the water-table contour map (Pl. 1) on the bedrock contour map (Fig. 5), then subtracting the altitude of the bedrock from the altitude of the water table at points of intersection. Contour lines were then drawn through points of equal thickness.
The contours indicate that the thickness of saturated materials is more than 140 feet in west-central Sheridan County and decreases considerably in the southeastern part of the county in the Saline River valley and in the east-central part of the county along the South Fork Solomon River valley. Well 8-28-9ab yields 580 gallons per minute of water from about 114 feet of saturated material. In other areas with as much saturated material wells should yield comparable quantities of water if the water-bearing materials are as permeable as they are at well 8-28-9ab. In general, the permeability of the Ogallala formation is comparatively low and the lithology of the formation changes in short distances. However, test drilling should locate permeable sand and gravel in much of the county. A well that yields 500 gallons a minute will pump an amount of water in a 24-hour period equal to two-thirds inch on 40 acres.
In some of the valley areas the map of saturated thickness indicates a thinning of saturated material. This water-bearing material is generally more permeable than water-bearing beds in the Ogallala formation, however, so wells of large capacity can be developed.
Chemical Character of Ground Water
The chemical character of ground water in Sheridan County is shown by analyses of water from 18 wells representing the principal water-bearing formations (Table 3). Figure 10 shows graphically the chemical character of waters from the Ogallala formation, terrace deposits, and alluvium.
Figure 10--Graphical representation of analyses of water from wells in Sheridan County.
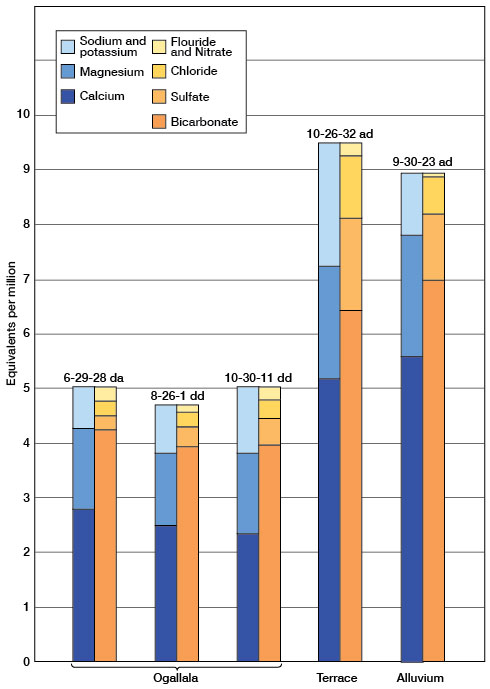
The concentration of mineral constituents is given in equivalents per million in Figure 10, and in parts per million in Table 3. To convert parts per million to equivalents per million the valence of each mineral constituent is divided by its atomic weight; then this factor (listed in Table 4) is multiplied by the parts per million given in Table 3 for each mineral constituent.
Table 4--Factors for converting parts per million to equivalents per million.
| Mineral constituents |
Chemical symbol |
Factor |
|---|---|---|
| Calcium | Ca++ | 0.0499 |
| Magnesium | Mg++ | 0.0822 |
| Sodium | Na+ | 0.0435 |
| Carbonate | CO3- | 0.0333 |
| Bicarbonate | HCO3- | 0.0164 |
| Sulfate | SO4-- | 0.0208 |
| Chloride | Cl- | 0.0282 |
| Nitrate | NO3- | 0.0161 |
| Fluoride | F- | 0.0526 |
The samples of water from typical wells in Sheridan County were analyzed by Howard A. Stoltenberg, chemist, in the Water and Sewage Laboratory of the State Board of Health at Lawrence. The analyses show only the dissolved mineral content of the water and do not indicate sanitary conditions. The analyses indicate that the water is suitable for most uses.
Chemical Constituents in Relation to Use
The following discussion of the chemical constituents of ground water has been adapted in part from publications of the U. S. Geological Survey and the State Geological Survey of Kansas. A summary of the dissolved solids, hardness, iron, and fluoride of samples of water from typical wells in Sheridan County is given in Table 5.
Dissolved Solids
Ground water dissolves some of the rock materials with which it comes in contact. After a natural water has been evaporated, the residue consists of mineral matter and some organic matter and water of crystallization. The kind and quantity of these minerals in water determine its suitability for various uses. Water containing less than 500 parts per million of dissolved solids generally is considered satisfactory for domestic use, except for difficulties resulting from hardness or excessive iron content. Water containing more than 1,000 parts per million of dissolved solids may contain enough of certain constituents to cause a noticeable taste or to make the water unsuitable for use in some other respect. The amount of dissolved solids in the 18 samples collected in Sheridan County is given in Table 3. Of the 18 samples collected, 15 contained less than 500 parts per million of dissolved solids, 2 contained between 500 and 1,000 parts per million, and 1 contained more than 1,000 parts per million.
Hardness
Hardness is the property of water that generally receives the most attention, probably because it is recognized easily by its effect when soap is used with water. Hard water requires more soap to form suds. Nearly all hardness in water is caused by calcium and magnesium and these constituents also cause most of the scale formed in steam boilers or other vessels in which water is heated. In addition to total hardness Table 3 gives the carbonate and noncarbonate hardness. The carbonate hardness is due to the presence in the water of calcium and magnesium bicarbonate and may be almost entirely removed by boiling or by a simple softening treatment. Noncarbonate hardness is caused by the presence of sulfates, chlorides, nitrates, and fluorides of calcium and magnesium. Carbonate hardness is called temporary hardness and noncarbonate hardness is called permanent hardness.
Water having a hardness of 50 parts per million or less is considered soft and treatment of such water is not necessary under ordinary circumstances. Water having 50 to 150 parts per million hardness is suitable for most purposes but the use of soap increases and water in the upper part of this range of hardness should be treated for use in boilers or vessels in which water is heated. A hardness of more than 150 parts per million is easily noticeable and the water should be softened for many uses. If the hardness is 200 parts per million or more, the water should be softened for most uses. Where municipal supplies are softened the hardness generally is reduced to less than 100 parts per million.
Table 5--Summary of dissolved solids, hardness, iron, and fluoride in water from typical wells in Sheridan County.
| Range in parts per million | Number of samples | ||
|---|---|---|---|
| Ogallala formation |
Terrace deposits |
Alluvium | |
| Dissolved solids | |||
| Less than 250 | 1 | 0 | 0 |
| 251-500 | 12 | 1 | 1 |
| 501-1,000 | 0 | 2 | 0 |
| More than 1,000 | 0 | 1 | 0 |
| Total hardness | |||
| 150-300 | 13 | 1 | 0 |
| 301-500 | 0 | 2 | 1 |
| More than 500 | 0 | 1 | 0 |
| Iron | |||
| Less than 0.1 | 3 | 2 | 0 |
| 0.1-0.3 | 2 | 1 | 1 |
| 0.31-1.0 | 5 | 1 | 0 |
| More than 1.0 | 3 | 0 | 0 |
| Fluoride | |||
| 0.5-1.0 | 8 | 3 | 1 |
| 1.1-1.5 | 15 | 1 | 0 |
| More than 1.5 | 0 | 0 | 0 |
None of the samples of water collected in Sheridan County had a hardness less than 150 parts per million, 14 had a hardness between 150 and 300 parts per million, and 4 had a hardness of more than 300 parts per million (Table 5).
Iron
Next to hardness, iron is the mineral constituent in ground water that receives the most attention in everyday use. The quantity of iron in ground water may differ considerably from place to place even within the same formation. If iron is present in water in a concentration greater than 0.3 part per million, the excess may precipitate upon exposure to air. The rusty stain on vessels and plumbing fixtures is commonly caused by excess iron in the water. Generally, where iron is present in sufficient quantity to give a disagreeable taste or to stain utensils, it may be removed by aeration and filtration but in some water further treatment is necessary to remove the iron. The chemical analyses (Table 3) indicate that the concentrations of iron in samples of water from Sheridan County ranged from 0.02 to 12 parts per million. Nine samples contained less than 0.3 part per million, 6 samples contained between 0.3 and 1 part per million, and 3 samples contained more than 1 part per million (Table 5).
Fluoride
Although quantities of fluoride are relatively small as compared with other common constituents of natural water, the amount of fluoride in drinking water that is used by children should be known. Fluoride in water has been associated with the dental defect known as mottled enamel, which may appear on the teeth of children who habitually drink water containing excessive amounts of fluoride during the formation of their permanent teeth. Water containing 1.5 parts per million or more of fluoride is likely to produce mottled enamel (Dean, 1936). Small quantities of fluoride in the drinking water not sufficient to cause mottled enamel are likely to be beneficial by preventing or decreasing the incidence of caries in the permanent teeth of children (Dean and others, 1941). Fluoride has been added to some public water supplies in recent years, generally in concentrations of about 1 part per million.
The concentration of fluoride in samples of water collected in Sheridan County ranged from 0.5 to 1.6 parts per million; only one sample contained more than 1.5 parts per million (Table 3).
Nitrate
Nitrate in natural water has received considerable attention during the last few years because of the discovery that a large amount of nitrate in water may cause cyanosis when the water is used in infant feeding. The Kansas State Board of Health considers water containing less than 50 parts per million of nitrate (as NO3) safe for use and water containing more than 90 parts per million likely to cause cyanosis.
The concentration of nitrate in the samples of water collected in Sheridan County (Table 3) ranged from 0.6 to 11 parts per million--well within the limit for safe use.
Chemical Quality of Water for Irrigation
The suitability of water for irrigation is dependent principally on the concentration of dissolved solids in the water and the percent of sodium. High concentrations of some mineral constituents are detrimental to plant growth although some plants are more tolerant to certain minerals than others. Plants may be classed in groups as to their tolerance to salinity of the soil. In the first group, which includes those plants that are the least tolerant to salinity, are beans, celery, radishes, red clover, and white clover; in the second group, which includes plants more tolerant to salinity, are rye, oats, wheat, sweet clover, alfalfa, and peas; and in the third group, which includes the most tolerant plants, are barley, milo, sugar beets, cotton, and most grasses.
The approximate critical concentrations or percentages of different constituents in irrigation water (below which it is safe for irrigation use and above which it may be unsafe for irrigation use) are given in Table 6 (Marr, 1944).
Table 6--Suitability of water for irrigation use.
| Classes of water |
Dissolved solids, ppm |
Percent sodium |
Boron, ppm |
Chloride, ppm |
Sulfate, ppm |
|---|---|---|---|---|---|
| 1. Good | Less than 525 | Less than 40 | Less than 2.0 | Less than 248 | Less than 336 |
| 2. Permissible | 525-1,400 | 40-60 | 2.0-3.0 | 248-426 | 336-576 |
| 3. Doubtful | 1,400-2,100 | 60-80 | 3.0-3.75 | 426-710 | 576-960 |
| 4. Unsuitable | more than 2,100 | more than 80 | more than 3.75 | more than 710 | more than 960 |
The permissible ranges of concentration of solids given in Table 6 will differ somewhat for different soil, climate, and drainage. Water with high concentration of dissolved solids will have less effect on plant growth in well-drained soils than it will have in poorly drained soils. The use of irrigation water having a high mineral content may cause the soil to become less porous or permeable and, in time, the soil may become alkaline.
The concentrations of dissolved solids, chloride, and sulfate and the percent sodium in samples of water collected in Sheridan County were all within the limits of suitability for irrigation (Table 3). Although the content of boron in ground water in Sheridan County was not determined, the content in ground water from the same aquifers in adjacent areas is within the limits of suitability for irrigation (Leonard, 1952, p. 76).
Prev Page--Geology || Next Page--Well Records
Kansas Geological Survey, Geology
Placed on web Feb. 10, 2009; originally published May 1956.
Comments to webadmin@kgs.ku.edu
The URL for this page is http://www.kgs.ku.edu/General/Geology/Sheridan/05_gw.html