![]()
Prev Page--Ground-water Areas || Next Page--Utilization
Ground Water, continued
Chemical Character of Ground Water
The chemical character of the ground water in Sedgwick County is indicated by analyses or partial analyses of 297 samples of water collected from wells, test holes, springs, and municipal water systems. The results of the analyses are given in Tables 5 to 8.
- Table 5—Analyses of water from wells and springs in Sedgwick County, Kansas
- Table 6—Analyses of water from municipal water systems in Sedgwick County, Kansas
- Table 7—Partial analyses of water from wells in Wichita "Bentley Reserve" and "local" well fields
The analyses were made by the Water and Sewage Laboratory of the Kansas State Department of Health, the Wichita Water Department, and the Wichita Chemical and Testing Laboratory. The laboratory which made the analyses is given in the tables. In general, the analyses do not indicate the sanitary condition of the water (U. S. Public Health Service, 1962).
Chemical Constituents, in Relation to Use
Dissolved solids--When water is evaporated the residue consists mainly of those mineral constituents listed in the table of analyses, (Tables 5, 6, and 7). In addition to the mineral constituents, the residue generally includes small quantities of organic matter and a small amount of water of crystallization. Water containing less than 500 ppm (parts per million) of dissolved solids is suitable for domestic use, except for difficulties resulting from hardness or the presence of iron in excessive amounts. Water containing more than 1,000 ppm of dissolved solids is likely to contain enough of certain constituents to cause noticeable taste or otherwise make the water undesirable or unsuitable for use. The dissolved solids in water samples collected in Sedgwick County ranged from 203 to 4,080 ppm.
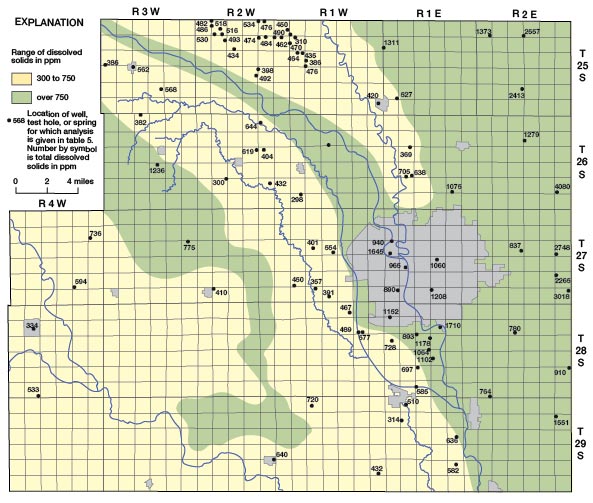
The distribution of dissolved solids in the ground water in Sedgwick County is shown on Figure 24 and is closely related to the geology and hydrology of the County. The largest concentrations of dissolved solids are in water from the Wellington Formation in the eastern part of the County where the shale contains much gypsum and anhydrite and locally thin seams of salt. West of the Arkansas Valley in the area where loess overlies the Wellington Formation and Ninnescah Shale, the water is highly mineralized, but the dissolved solids are less than in the eastern part of the County. Recharge conditions are more favorable in the loess-covered area, and some dilution of the highly mineralized water in the bedrock may take place. Within the Arkansas Valley a zone of highly mineralized water is present adjacent to the Arkansas River and between Big Slough Creek and the river. The dissolved solids content of the water is quite variable with location and depth, but it is usually over 750 ppm. The high mineralization of the water adjacent to the Arkansas River is attributed to movement of highly mineralized water from the river into the aquifer. The Arkansas River above its junction with the Little Arkansas is normally in equilibrium with the water table, and the water-table gradient is parallel to the general direction of river flow (Pl. 1). Thus water in the river moves freely into the aquifer where its direction of flow locally is different from the direction of the water-table gradient. In Wichita ground water has been pumped from many municipal, industrial, and small irrigation wells for many years and has probably caused the movement of highly mineralized water into the aquifer from the Arkansas River and Big Slough Creek. In the southwestern part of the County where ground water is obtained from sand and gravel on the uplands and in stream valleys and from the Ninnescah Shale, the dissolved solids content of the water is only moderately large. The Ninnescah Shale does not contain an abundance of readily soluble minerals as does the Wellington Formation and thus does not contribute as greatly to the mineralization of the ground water.
Figure 24—Map of Sedgwick County, Kansas, showing the distribution of dissolved solids in ground water.
Hardness--The hardness of water is most commonly recognized by its effect when soap is used in the water. Salts of calcium and magnesium cause nearly all the hardness of ordinary water. These constituents also are the active agents in the formation of scale in steam boilers and in other containers in which water is heated or evaporated.
The total hardness, carbonate hardness, and non carbonate hardness of water samples from Sedgwick County are given in Tables 5 and 6 and total hardness only in Tables 7 and 8. The carbonate hardness, or "temporary hardness," is caused by calcium and magnesium carbonates and can be almost entirely removed by boiling the water. The non carbonate hardness, or "permanent hardness," is caused by sulfates and chlorides of calcium and magnesium and other salts and cannot be removed by boiling. Carbonate hardness and non carbonate hardness react in the same manner in relation to the addition of soap. In boilers, water that has non carbonate hardness forms a harder scale than water that has only carbonate hardness.
Water having a hardness of less than 50 ppm is classified as soft, and treatment for reduction of hardness is not necessary for ordinary uses. Hardness between 50 and 150 ppm does not seriously interfere with the use of water for most purposes, but does increase the consumption of soap. Laundries and other industries using large quantities of soap, or using water for purposes in which this amount of hardness is objectionable in other ways, may find it profitable to soften the water. Water of this range of hardness forms scale in steam boilers so it generally is softened before being used for this purpose. Hardness of more than 150 ppm is universally noticeable. The hardness of water samples collected in Sedgwick County ranged from 49.9 to 2,211.0 ppm.
Iron--Next to hardness, iron is the constituent in natural waters that generally is the most objectionable. The quantity of iron in water seemingly differs greatly from place to place, even in the same aquifer. If the water contains more than 0.3 ppm of iron in solution, the iron, upon oxidation, may settle out as a reddish sediment. Iron, if present in sufficient quantity, gives a disagreeable taste to water, stains clothing, cooking utensils, and plumbing fixtures, and is objectionable in foods and beverages. Iron generally can be removed by aeration and filtration, but some waters require chemical treatment for removal of iron.
The iron content of water samples collected in Sedgwick County ranged from 0 to 26 ppm. Iron in the ground water is a problem throughout the County, but the exceptionally high iron content of the water obtained from wells 26-1E-17ab, 26-2W-2bcc. 26-2W-29aaa, and 27-1W-24cda are thought to be due in part to contamination of the sample by rust or scale from associated plumbing. The chemistry of iron in natural waters is quite complex and beyond the scope of this report, but several factors related to the geology and hydrology of the County seem to influence the occurrence of iron in ground water. The iron content of water seems to be related to such factors as depth in the aquifer, the type of rocks compromising the aquifer, the length of time the water has been in the aquifer, the pH of the water, the dissolved gases in the water (which may affect the pH), the presence or absence of iron bacteria, and many other factors. Some iron problems seem to be associated with the well construction and the pumping schedule of the well. Wells using galvanized iron casing commonly produce water with a high iron content within a few months after installation, particularly when the pumping periods of the well are intermittent and of short duration. Wells with steel casings commonly develop similar problems with respect to iron in the water when pumped intermittently but not as soon as wells with galvanized casing. Wells with high yields that are pumped regularly, such as municipal and industrial wells, do not commonly produce water excessively high in iron, and the iron content of water from such wells probably is more nearly representative of the dissolved iron content of the water in the aquifer.
Manganese in ground water has properties similar to iron except that the manganese is more difficult to remove and stains plumbing fixture black. Iron and manganese are considered together in evaluating the usefulness of water, and on some water analyses are reported together as iron. The manganese content of ground water in Sedgwick County is shown on the water analyses in Tables 5, 6, and 7.
Chloride--Chloride ions are very abundant in nature. They are found in quantity in sea water and oil-field brines and are dissolved in small quantities as sodium chloride from many rock materials. Sodium chloride has little effect on the suitability of water for use unless it is present in such concentrations as to make the water unpotable or corrosive. The removal of sodium chloride from water is difficult and too costly for most water uses.
The chloride content of water samples collected in Sedgwick County ranged from 4 to 1,695 ppm. Plate 4 shows the distribution of chloride in the ground water of the County as determined from the water samples collected. The depth from which the individual water samples were obtained is plotted with the chloride concentration on Plate 4. Within the aquifer underlying the Arkansas Valley the highest chloride concentrations are found adjacent to the Arkansas River on the south and west side of the river channel. An increase in chloride concentration with depth occurs locally within the area south and west of the Arkansas River, but the reason for this has not been definitely determined.
The Arkansas River water normally has a chloride concentration that averages about 600 ppm, and the river is in equilibrium with the water table most of the time. If this equilibrium were lost, the direction of ground-water movement near the river as indicated by the water-table contours shown in Plate 1 would enable river water in the reach of the stream northwest of Wichita to move into the aquifer and thence to the southeast. The area in which movement of water from the river would take place is also an area where the water table is near the land surface and evapotranspiration would tend to concentrate the dissolved minerals in the ground water.
Ground water in the area adjacent to Big Slough Creek in T 26 S, R 1 W also has a high chloride content. The low land bordering the creek is swampy and seepage of ground water into the creek takes place most of the time. The above conditions are indicative of a ground-water discharge area, and the creek is down gradient from the reach of the Arkansas River where seepage of river water into the aquifer takes place. Concentration of dissolved minerals in the ground water by evapotranspiration probably accounts for the high chlorides in this area.
The solution zone in the salt beds of the Wellington Formation west of the Arkansas Valley contains saturated brine of unknown quantity and extent and may have hydraulic communication with the aquifer underlying the Arkansas Valley. The hydraulic head in the solution zone is reported to be about equivalent to the water-table altitude in the Arkansas Valley. Available data indicate that no water moves from the solution zone into the valley. If the reported relationship between the head in the solution zone and the water table in the valley is correct, the greater density of the brine and the low permeability of the sediments separating the two would probably prevent upward movement of the brine under natural conditions.
Fluoride--Fluoride is present in ground water only in small quantities, but a knowledge of the fluoride content of water is important because the use of water containing fluoride in excess of 1.5 ppm by children during formation of their permanent teeth may cause mottling of the tooth enamel. If the fluoride content is as great as 4 ppm, about 90 percent of the children using the water may have mottled tooth enamel (Dean, 1936). Although too much fluoride in water is undesirable, a fluoride concentration of about 1 ppm in drinking water lessens the incidence of tooth decay (Dean. et al., 1941). The fluoride concentration in samples of water collected in Sedgwick County ranged from 0 to 0.9 ppm.
Nitrate--Investigations in the last two decades into the effect of nitrate in drinking water have shown that large concentrations of nitrate in water may cause cyanosis in infants (so-called "blue babies"') when the water is used for drinking and in the preparation of formulas for feeding. Infant cyanosis is usually not fatal if diagnosed in time but may be fatal with continued use of water containing excessive nitrate. Water that contains more than 90 ppm of nitrate is regarded by the Kansas State Department of Health as likely to cause infant cyanosis (Metzler and Stoltenberg, 1950). Moderate nitrate concentrations are seemingly not harmful to older children or adults. Nitrate cannot be removed from water by boiling. The nitrate concentration in samples of water collected in Sedgwick County ranged from 0 to 567 ppm. The exceptionally high concentration of nitrates in ground water were found in water samples obtained from wells in the Wellington Formation in the eastern part of the County. In all cases the wells were large-diameter dug or bored farm wells that were not adequately cased or sealed to prevent surface water from seeping into the well.
Chemical Constituents in Relation to Irrigation
The following discussion of the suitability of water for irrigation use is adapted from Agriculture Handbook 60 of the U. S. Department of Agriculture (U. S. Salinity Laboratory Staff, 1954).
The development and maintenance of successful irrigation projects involve not only the supplying of irrigation water to the land but also the control of salt and alkali in the soil. The quality of irrigation water, irrigation practices, and drainage conditions are involved in salinity and alkali control. Soil that was originally non saline and non alkaline may develop saline and alkaline character if excessive soluble salts or exchangeable sodium are allowed to accumulate in the soil as the result of improper irrigation or soil-management practices, or inadequate drainage.
In areas of sufficient rainfall and ideal soil conditions the soluble salts originally present in the soil or added to the soil with water are carried downward by the water and ultimately reach the water table. The process of solution and transportation of soluble salts by water moving through the soil is called "leaching." If the amount of water applied to the soil is not in excess of the amount needed by plants, there will be no downward percolation of water below the root zone and mineral matter will accumulate at that level. Impermeable zones in the soil near the surface can retard the downward movement of water, resulting in water logging of the soil and deposition of salts. Unless drainage is adequate, attempts at leaching may not be successful, because leaching requires the free passage of water through and away from the root zone.
The characteristics of water for irrigation that seem to be most important in determining its quality are: (1) total concentration of soluble salts; (2) relative proportion of sodium to other principal cations (magnesium, calcium, and potassium); (3) concentration of boron or other elements that may be toxic to plants; and (4) the bicarbonate concentration, under some conditions, as related to the concentration of calcium plus magnesium.
The total concentration of soluble salts in irrigation water can be adequately expressed in terms of electrical conductivity for purposes of diagnosis and classification. Electrical conductivity is a measure of the ability of the ionized inorganic salts in solution to conduct an electric current, and is usually expressed in micromhos per centimeter at 25° C. The electrical conductivity can be determined accurately in the laboratory, or an approximation of the electrical conductivity can be obtained by multiplying the total equivalents per million (epm) of calcium, magnesium, sodium, and potassium by 100 (Table 9). In general, water having a conductivity below 750 micromhos per centimeter is satisfactory for irrigation insofar as salt content is concerned, although salt-sensitive crops may be adversely affected by irrigation water having an electrical conductivity in the range of 250 to 750 micromhos per centimeter. Water having a range of 750 to 2,250 micromhos per centimeter is widely used, and satisfactory crop growth is obtained under good management and favorable drainage conditions, but saline conditions will develop if leaching and drainage are inadequate. Use of water having a conductivity of more than 2,250 micromhos per centimeter is not common, and very few instances can be cited where such waters have been used successfully.
Table 9—Factors for converting parts per million of mineral constituents to equivalents per million.
| Cation | Conversion factor |
Anion | Conversion factor |
|---|---|---|---|
| Ca++ | 0.0499 | HCO3- | 0.0164 |
| Mg++ | 0.0823 | SO4-- | 0.0208 |
| Na+ | 0.0435 | Cl- | 0.0282 |
| NO3- | 0.0161 | ||
| F- | 0.0526 |
In the past, the relative proportion of sodium to other cations in irrigation water usually has been expressed simply as the percentage of sodium among the principal cations (expressed in epm)--the percent sodium, so called. According to the U. S. Department of Agriculture the sodium-adsorption ratio (SAR), used to express the relative activity of sodium ions in exchange reactions with soil, is a better measure of suitability of water for irrigation with respect to the sodium (alkali) hazard. The sodium-adsorption ratio may be determined by the formula
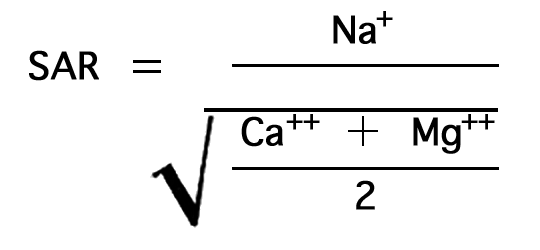
where the ionic concentrations are expressed in equivalents per million.
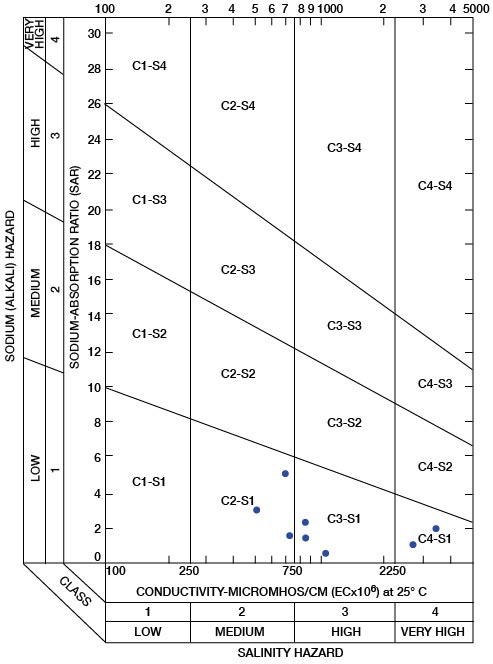
The sodium-absorption ratio may be determined also by use of the nomogram shown in Figure 25. In using the nomogram to determine the sodium-absorption ratio of water, the concentration of sodium expressed in equivalents per million is plotted on the left-hand scale, and the concentration of calcium plus magnesium expressed in equivalents per million is plotted on the right-hand scale. The point at which a line connecting these two points intersects the scale for the sodium-absorption ratio indicates the sodium-adsorption ratio of the water. When the sodium-adsorption ratio and the electrical conductivity of a water are known, the classification of the water for irrigation can be determined by plotting these on the diagram shown in Figure 26. Table 10 gives the sodium-adsorption ratio and electrical conductivity of selected water samples from Sedgwick County that are plotted on Figure 26 and for which analyses are given in Table 5. Low-sodium water (S1) can be used for irrigation on almost all soils with little danger of developing harmful levels of exchangeable sodium. Medium-sodium water (S2) will present an appreciable sodium hazard in certain fine-textured soils, especially poorly leached soils. Such water may be used safely on coarse-textured or organic soils having food permeability. High-sodium water (S3) may produce harmful levels of exchangeable sodium in most soils and will require special soil management such as good drainage and leaching and addition of organic matter. Very high sodium water (S4) is generally unsatisfactory for irrigation unless special action is taken, such as addition of gypsum to the soil.
Figure 25—Nomogram for determining sodium-adsorption ratio of water.
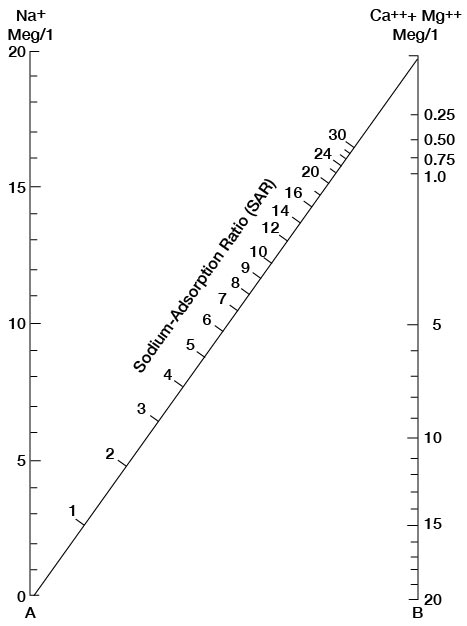
Table 10—Sodium-adsorption ratios (SAR) and conductivities of selected water samples from Sedgwick County, Kansas. These are plotted on Figure 26 and analyses are given in Table 5.
| Well Number | Sodium-adsorption ratio |
Conductivity (Micromhos per centimeter) |
|---|---|---|
| 25-2E-28ada | 0.5 | 2,740 |
| 25-2W-8adb | 2.2 | 800 |
| 25-2W-12bbb | 1.6 | 740 |
| 26-1W-31aac | 3.0 | 510 |
| 27-2E-13ccc2 | 1.8 | 3,540 |
| 27-1W-33dad | 5,1 | 700 |
| 28-4W-32ddd | 1.3 | 880 |
| 29-2E-36aaaf | 0.3 | 1,050 |
Low-salinity water (C1) can be used for irrigation of most crops on most soils with little likelihood that soil salinity will develop. Medium-salinity water (C2) can be used if a moderate amount of leaching occurs. Crops of moderate salt tolerance can be irrigated with C2 water without special practices. High-sanity water (C3) cannot be used on soils of restricted drainage. Very high salinity water (C4) is not suitable for irrigation water under ordinary circumstances. It can be used only on crops that are very tolerant of salt and then only if special practices are followed, including the provision for a high degree of leaching.
Boron is essential to normal plant growth, but the quantity required is very small, and large quantities are harmful. Crops vary greatly in their boron tolerance, but, in general, crops ordinarily grown in Kansas are not adversely affected by boron concentrations of less than 1 ppm.
In water having a high concentration of bicarbonate, there is a tendency for calcium and magnesium to precipitate as the water in the soil becomes more concentrated as a result of evaporation and plant transpiration. This reaction ordinarily does not go to completion, but when it does, there is a reduction in the concentration of calcium and magnesium, and, therefore, a relative increase in sodium. The calcium and magnesium are precipitated as carbonates, and any residual carbonate or bicarbonate is left in solution as sodium carbonate. The potential amount of such residual sodium carbonate may be computed
(Na2CO3) = (CO3-- + HCO3-) - (Ca++ + Mg++),
where the ionic concentrations are expressed as milliequivalents per liter or equivalents per million.
On the basis of limited data and using the concept of residual sodium carbonate described above, the Department of Agriculture has concluded that water having more than 2.5 epm of residual sodium carbonate is not suitable for irrigation. Water containing 1.25 to 2.50 epm of residual sodium carbonate is marginal, and water containing less than 1.25 epm can be safely used for irrigation.
In appraising the quality of an irrigation water, first consideration must be given to salinity and alkali hazards by reference to Figure 26. Then consideration should be given to other characteristics such as content of boron and other toxic elements and of bicarbonate, any one of which may change the quality rating. The use of water of any quality must take into account such factors as drainage and management practices.
Figure 26—Diagram showing suitability of water for irrigation. Points plotted on diagram are from Table 10.
Prev Page--Ground-water Areas || Next Page--Utilization
Kansas Geological Survey, Geology
Placed on web Nov. 1998; originally published Dec. 1965.
Comments to webadmin@kgs.ku.edu
The URL for this page is URL=http://www.kgs.ku.edu/General/Geology/Sedgwick/gw07.html