![]()
Prev Page--Water Table || Next Page--Ground-water Recharge
Ground Water, continued
Fluctuations of the Water Table
Natural Fluctuations
If a ground-water reservoir was in equilibrium with its environment, that is, if recharge to and discharge from the reservoir at all places and at all times remain the same, the water table would remain in a fixed position. Such conditions are rare in nature, however, and in practically all places the water table fluctuates up and down in response to additions to or withdrawals from the ground-water reservoir. However, under natural conditions the changes in ground-water storage reflected by water-table fluctuations should balance out over a period of years or during a climatic cycle. Fluctuations of the water table in Sedgwick County have been determined by periodic measurements of the depth to water in selected wells since 1937. The results have been published annually by the U. S. Geological Survey through 1955 (see References) and thereafter by me State Geological Survey of Kansas (Fishel and Mason, 1957, 1958: Fishel. et al., 1959; Fishel and Broeker, 1960; Broeker and Fishel, 1961; Broeker and Winslow, 1962). A list of the wells in which water levels are currently being measured and those that are no longer being measured but for which some record is available are given in Table 3.
Table 3—Observation wells in Sedgwick County, Kansas.
| Well number this report |
Well number City of Wichita* |
Depth of well, feet below land surface |
Period of record |
|---|---|---|---|
| 25-1W-26dbb | 12 | 54 | 1937-62§ |
| 27-1E-18ccc | 26 | 47 | 1937-62§ |
| 25-2W-7aaa | 114 | 32 | 1954-62 |
| 25-2W-22bbb | 115 | 32 | 1954-62 |
| 25-1W-17bbb | 116 | 30 | 1954-60** |
| 25-1W-20ccc | 117 | 39 | 1954-62 |
| 25-1W-5ddd | 124 | 70 | 1955-62 |
| 25-1W-10ccc | 125 | 69 | 1956-62 |
| 25-1W-22bbb | 126 | 40 | 1955-62 |
| 25-2W-1cbb | 307 | 92 | 1937-54; 1956-62 |
| 26-1W-16ddd | 804 | 26 | 1938-62 |
| 26-1W-19abb | 805 | 41 | 1928-62 |
| 26-2W-10bbb | 807 | 37 | 1938-62 |
| 26-3W-18bcc | 808 | 49 | 1938-53; 1958-62 |
| 26-1E-21bbb | 809 | 32 | 1938-62 |
| 25-1W-35daa | 810 | 25 | 1938-62 |
| 25-1W-33ddd | 811 | 25 | 1938-58** |
| 25-1W-27bbb | 812 | 25 | 1938-62 |
| 25-1W-14ddd | 814 | 31 | 1938-62 |
| 25-1W-17aaa | 815 | 31 | 1938-62 |
| 25-1W-7ccc | 816 | 31 | 1938-62 |
| 25-1W-3aaa | 825 | 25 | 1938-62 |
| 25-1W-5aaa | 826 | 18 | 1939-49; 1955-62 |
| 25-2W-30ccc | 830 | 57 | 1938-62 |
| 25-3W-9ccc | 834 | 18 | 1938-62 |
| 25-3W-33baa | 838 | 49 | 1938-53; 1955; 1958-62 |
| 25-2W-3ccc | 840a | 26 | 1952-62 |
| 25-2W-16bbb | 842 | 15 | 1939-62 |
| 27-1E-6dcc | 847 | 25 | 1939-62 |
| 25-2W-18aab | 870 | 19 | 1939-62 |
| 25-2W-4aaa | 1171 | 30 | 1950-62 |
| 25-1W-5ccc | 1176 | 33 | 1950-62 |
| 25-3W-1ddd | 3004 | 20 | 1949-62 |
| 25-2W-11cbc | 3030 | 32 | 1950-62 |
| 25-3W-3ddd | 3041 | 17 | 1953-62 |
| 25-2W-14ccc | 3044 | 24 | 1953-62 |
| 25-2W-13bbc | 3045 | 65 | 1954-62 |
| 25-2W-24ddd | 3050 | ... | 1952-62 |
| 25-2W-1baa | M25b | 51 | 1939-62 |
| 25-2W-2bbb | M27 | 215 | 1947; 1949-62 |
| 25-2W-3aaa | M27b | 80 | 1947-62 |
| 25-2W-2baa | M28 | 220 | 1947; 1949-62 |
| 25-2W-2abb | M28b | 82 | 1947-62 |
| 25-2W-11bbb1 | M29 | 225 | 1947; 1949-62 |
| 25-2W-11bbb2 | M29b | 103 | 1947-62 |
| 25-2W-11baa | M30 | 225 | 1947; 1949-62 |
| 25-2W-11abb | M30b | 61 | 1947-62 |
| 25-2W-12bbb1 | M31 | 197 | 1947; 1949-62 |
| 25-2W-12bbb2 | M31b | 62 | 1947-62 |
| 25-2W-12baa1 | M32 | 185 | 1947; 1949-62 |
| 25-2W-12baa2 | M32b | 71 | 1947-62 |
| 25-2W-1daa | M33 | 170 | 1947; 1949-62 |
| 25-2W-1add | M33b | 75 | 1947-62 |
| 25-1W-6ccc1 | M34 | 150 | 1947; 1949-62 |
| 25-1W-6ccc2 | M34b | 85 | 1947-62 |
| 25-1W-7baa | M35 | 130 | 1947; 1949-62 |
| 25-1W-6caa | M35b | 86 | 1947-62 |
| 25-1W-7bcc1 | M36 | 184 | 1958-62 |
| 25-1W-7bcc2 | M36b | 51 | 1958-62 |
| 25-1W-7bcc3 | M26d | 180 | 1958-62 |
| 25-1W-18abb1 | M37 | 170 | 1958-62 |
| 25-1W-18abb2 | M37b | 53 | 1958-62 |
| 25-1W-18abb3 | M37d | 160 | 1958-62 |
| 25-1W-18aaa1 | M38 | 128 | 1958-62 |
| 25-1W-18aaa2 | M38b | 46 | 1958-62 |
| 25-1W-18aaa3 | M38d | 127 | 1958-62 |
| 25-1W-17cbb1 | M39 | 154 | 1958-62 |
| 25-1W-17cbb2 | M39b | 52 | 1958-62 |
| 25-1W-17cbb3 | M39d | 143 | 1958-62 |
| 25-1W-17ccc1 | M40 | 127 | 1958-62 |
| 25-1W-17ccc2 | M40b | 41 | 1958-62 |
| 25-1W-17ccc3 | M40d | 121 | 1958-62 |
| 25-2W-5bbb1 | M51 | 185 | 1958-62 |
| 25-2W-5bbb2 | M51b | 38 | 1958-62 |
| 25-2W-5bbb3 | M51d | 162 | 1958-62 |
| 25-2W-5bcc1 | M52 | 40 | 1958-62 |
| 25-2W-5bcc2 | M52b | 40 | 1958-62 |
| 25-2W-5ccd1 | M53 | 92 | 1958-62 |
| 25-2W-5ccd2 | M53b | 36 | 1958-62 |
| 25-2W-dbb1 | M54 | 80 | 1958-62 |
| 25-2W-dbb2 | M54b | 38 | 1959-62 |
| 25-2W-dcd1 | M55 | 47 | 1958-62 |
| 25-2W-dcd2 | M55b | 40 | 1958-62 |
| 27-1W-26ddd | ... | 87 | 1959-62§ |
| 28-1W-2cb | ... | 30 | 1959-62 |
| 28-1W-36adc | ... | 58 | 1959-62 |
|
*Well number is also used in State Geological Survey of Kansas Buletins of ground-water levels in observation wells. §Continuous water-stage recorder installed on well. **Measurement discontinued. |
|||
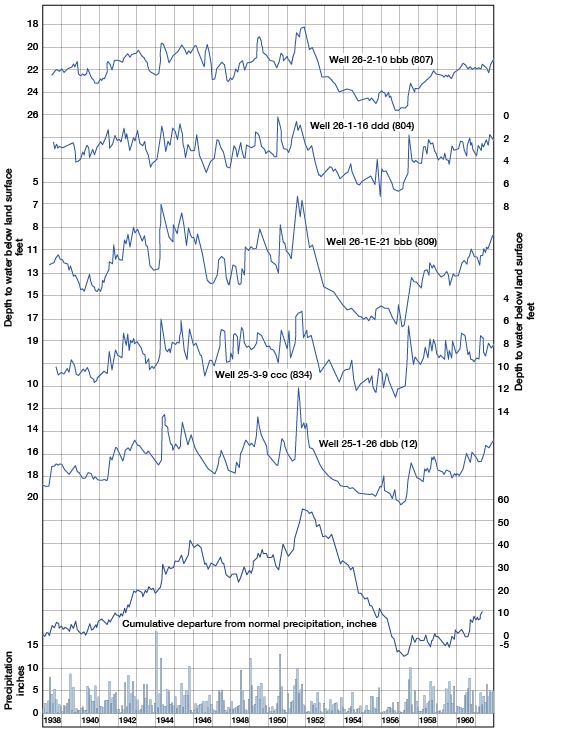
Figure 15 is a hydrograph showing fluctuations of the water level in selected wells in the County and the monthly precipitation, monthly precipitation normals, and the cumulative departure from normal precipitation at Wichita. These wells are remote from centers of pumping and are believed to reflect natural fluctuations of the water table caused by recharge from precipitation and natural discharge. If the distribution of precipitation in the area were always normal, the hydrographs would display a cyclic pattern much like that shown by the monthly precipitation normals. However, during the period of record shown in Figure 15 the climatic pattern has gone from the severe drought in the late 1930's to a period of above normal precipitation through the 1940's, a severe drought during the early 1950's, and a return to normal or above-normal precipitation during the late 1950's to the present. This pattern is well displayed by the curve showing cumulative departure from normal precipitation, and the water-table fluctuations due to recharge and discharge closely follow the same pattern. This relationship should be expected if the ground-water reservoir is full and in equilibrium for the normal conditions of its environment. The amount of water-table fluctuation at a particular point resulting from a given volume of recharge to or discharge from an aquifer is determined by the specific yield of the aquifer in the zone of fluctuation at that point. This may account for some of the differences in the degree of water-table fluctuations on the hydrographs shown in Figure 15. These differences could also be caused, in part, by uneven distribution of precipitation in the area, local differences in the infiltration rate, location of wells with respect to areas of natural discharge, and depth to the water table below land surface.
Figure 15—Hydrographs showing fluctuations of the water table in selected wells not affected by pumping, monthly precipitation, and cumulative departure from normal precipitation at Wichita, Kansas.
Fluctuations Caused by Pumping
When a well begins to discharge water from a water-table aquifer, the water table adjacent to the well is lowered, establishing a hydraulic gradient toward the well. The water table around the well soon assumes a form similar to that of an inverted cone, with the apex at the well. For a short time most of the water pumped from a well is derived from the aquifer close to the well. As pumping continues, more of the aquifer is de-watered, and a gradient is established toward the well sufficient to move to the well the quantity of water that is being pumped. Most of the water being pumped is derived from an ever increasing distance from the well, and as the cone of depression expands, the water table within the cone of depression continues to decline gradually. The cone of depression around the well will continue to increase in size until sufficient recharge is added to the aquifer or until the natural discharge of the aquifer is decreased, by an amount equal to that removed by pumping.
After discharge from the well has ceased, water will continue to move toward the well, for the water table gradient remains in that direction, but instead of being discharged from the well the water refills the cone of depression created by pumping. As the aquifer near the well is refilled the hydraulic gradient toward the well is gradually decreased, and the recovery of the water level becomes progressively slower. Near the edge of the cone of depression the water level may continue to decline for a time after pumping has stopped, because the water continues to move toward the well. In time there is a general equalization of water levels over the area affected, and the water table will assume its original form, although it may temporarily remain slightly lower than before water was withdrawn.
In general, in a group of pumping wells the hydrologic events are similar to those described above for a single well, but the effect on the water table is much more widespread. Figure 16 is a hydrograph of selected observation wells in the Wichita well field, the annual pumpage from the well field, and the cumulative departure from normal precipitation at Newton, Kansas. About the southern one-third of the well field, containing 19 wells, is in northern Sedgwick County and the remaining 36 wells are in Harvey County. The well field was constructed in three stages to meet increasing water demand: the original 25 wells in Harvey County were placed in production in 1940; in 1949, 10 wells, nine of them in Sedgwick County, were added; and in 1959, 20 additional wells, 10 of them in Sedgwick County, were added to the system.. All of the hydrographs of wells shown in Figure 16 except one are from wells in Sedgwick County, and these most strongly reflect the water-level fluctuations caused by pumping since 1949. Well 24-2-9ccc is near the center of the pumping wells in Harvey County and shows the pattern of water-level changes in the well field since pumping began in 1940.
Figure 16.--Hydrographs showing fluctuations of the water table in selected wells in the Wichita well field, annual pumpage from the well field, and cumulative departure from normal precipitation at Newton, Kansas.
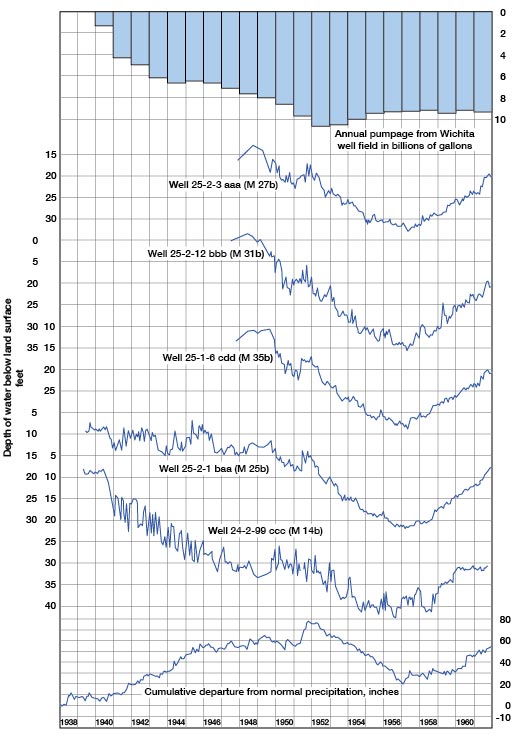
Inspection of the hydrograph shows the water table to be sensitive to changes in the hydrologic regimen of the area. The history of water-level fluctuations in the well-field area prior to 1938 is not known, but water levels were probably near normal or very slightly below normal following the drought of the 1930's. When pumping started in Harvey County in 1940, precipitation was near or slightly above normal, but the water table dropped steadily. The trend of the decline follows very closely the trend of increasing pumpage from the well field. During this period of development most of the water being pumped was coming from storage within the aquifer as a water-table gradient toward the well field was being established. By 1946 the downward trend of water levels in the well field ceased, owing to a combination of above-normal precipitation, a leveling off in pumpage from the field, and establishment of a water-table gradient toward the well field sufficient to balance withdrawals from and recharge to the aquifer. Withdrawals from the field increased steadily from 1947 through 1953, but water levels in the Harvey County area remained fairly steady through 1951, owing to above-normal precipitation. In 1949, 10 new wells were added to the well field, nine of them in Sedgwick County. Pumpage from the new wells caused a steady decline of the water table in adjacent areas that was reversed briefly during the very wet year of 1951. From 1952 through 1956 the area experienced the most severe drought on record. Pumpage from the well field increased greatly and water levels declined sharply until 1957 when precipitation returned to normal. Pumping from the field has decreased since 1957 and water levels have risen steadily through 1961. In 1959 20 wells were added to the well field, 10 in Harvey County and 10 in Sedgwick County, and a part of the water-level rise is probably due to spreading the withdrawal of water over a larger area. If pumpage from the well field does not increase and precipitation remains near normal, the water table in the well field will stabilize. Thereafter only minor fluctuations will take place as the pattern of pumping in the field is changed to spread withdrawals over the field. An increase in withdrawals or return to drought conditions would cause another period of declining water levels in the well field.
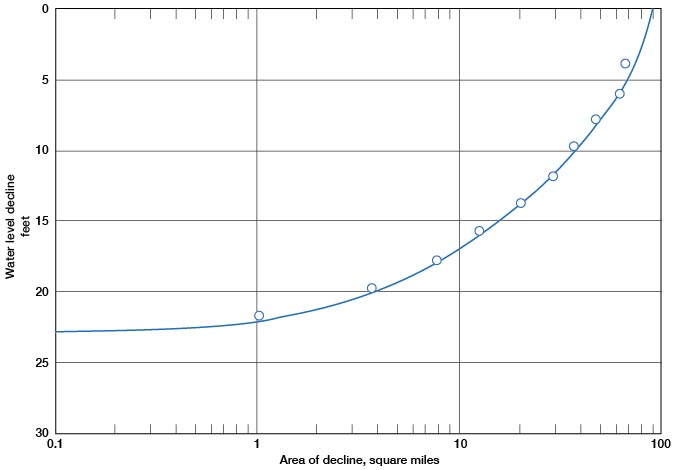
Water-table fluctuations in the Wichita well field have been measured regularly in a large number of observation wells since the installation of the field, and careful records of pumpage have been kept by the city. Maps are prepared periodically that show by means of contours, or lines of equal water-table change, the progressive change in shape and extent of the cone of depression created by pumping in the well-field area since pumping started in 1940. From these maps are prepared graphs showing the amount of decline plotted against the area in which the decline has taken place. Figure 17A shows a change map and 17B shows an aerial decline curve between August 30, 1940, when pumping started, and October 1, 1956. The latter date is near the end of the severe drought of the 1950's, and Figure 17B shows the maximum decline of the water table in the well field.
Figure 17a.—Map of Wichita well-field area showing lines of equal change in water level from August 30, 1940 to October 1, 1956.
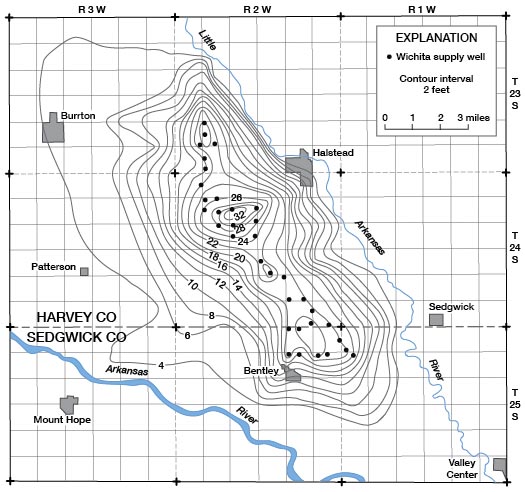
Figure 17b.—Area decline curve for October 1, 1956, Wichita well-field area.
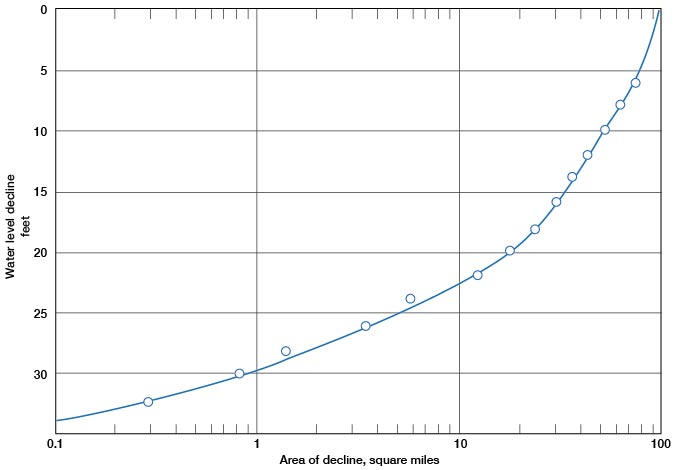
In October 1956 the maximum decline of the water table was 32 feet in an area of less than 1 square mile in Harvey County. Measurable draw down attributed to pumping affected an area of about 100 square miles. Figure 18A shows a water-level change map and 18B, aerial decline curve between August 30, 1940, and January 1, 1960. The latter date follows a period of 3 years in which precipitation was normal or above normal and pumpage from the well field was relatively stable. In January 1960 the maximum decline of the water table was 22 feet in an area of about 1 square mile. The area in which measurable draw down due to pumping could be determined had decreased to about 90 square miles, and throughout this area water levels showed an appreciable rise above the lowest level of 1956. The maximum fluctuation of the water table in the well-field area under natural conditions of recharge and discharge through a climatic cycle is believed to be about 8 feet, but it is not uniform owing to local conditions.
Figure 18a—Map of Wichita well-field area, showing lines of equal change in water level from August 30, 1940, to January 1, 1960.
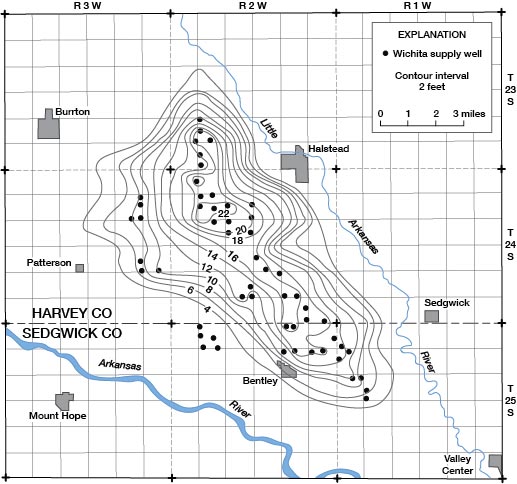
Figure 18B—Area decline curve for January 1, 1960, Wichita well-field area.
Fluctuations Caused by Changes in Atmospheric Pressure
In addition to the fluctuations of the water-table caused by addition or withdrawal of water from a ground-water reservoir, minor fluctuations caused by changes in atmospheric pressure are observed in some wells. In wells that penetrate water-bearing beds having a relatively impervious confining bed above the zone of saturation the water level may fluctuate inversely with the atmospheric pressure. The pressure on the water surface in a well changes directly in proportion to the change in atmospheric pressure. If the change in pressure is not transmitted uniformly to the ground water body, but acts only on the exposed water surface in the well, the water level in the well fluctuates according to the changes in pressure. If the pressure is transmitted freely to the water table through the pore spaces of the soil, the water level in the well will reflect no appreciable barometric effect.
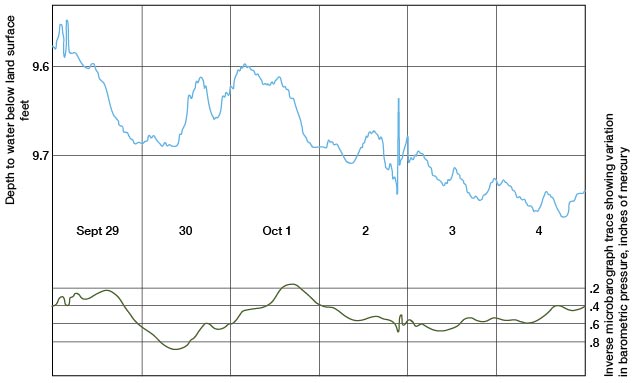
A hydrograph of well 27-1W-26ddd obtained from an automatic water-stage recorder and an inverted barograph trace obtained from a recording micro barograph at the same location are shown in Figure 19. On the hydrograph the fluctuations caused by barometric changes are superimposed on a gradually declining water level, but they correlate very closely. The rapid barometric fluctuations occurring on September 29 and October 2 produced a greater water-level fluctuation than more slowly occurring barometric fluctuations of the same magnitude and may indicate some leakage of air through the clayey silt overlying the aquifer with gradual changes in air pressure.
Figure 19—Water-level fluctuations in well 27-1W-26ddd caused by changes in atmospheric pressure, September 29 to October 4, 1960.
Prev Page--Water Table || Next Page--Ground-water Recharge
Kansas Geological Survey, Geology
Placed on web Nov. 1998; originally published Dec. 1965.
Comments to webadmin@kgs.ku.edu
The URL for this page is URL=http://www.kgs.ku.edu/General/Geology/Sedgwick/gw03.html