![]()
Prev Page—Ground Water || Next Page—Geologic Formations
Ground Water, continued
Utilization of Water
During the course of the investigation, data were obtained on 241 wells in Reno County (Table 11). The wells listed in Table 11 include 150 domestic and stock wells, 16 public-supply wells, 9 industrial wells, 3 irrigation wells, and 63 not in use or used only for observing water levels.
Domestic and Stock Supplies
Most domestic and stock water supplies in Reno County are obtained from wells. In a few places ponds are used to supply stock water. The ground water in this area generally is suitable for domestic use except for an area in the southeastern part of the county where the water comes from Permian rocks and is very hard. There, a few families use cistern water for drinking and washing but others use the well water even though it is not desirable. In a few local areas the ground water has become polluted from industrial wastes. In Reno County the supply of ground water available is generally sufficient for all domestic uses.
Public Water Supplies
Eight communities in Reno County have public water supplies. Descriptions of the water systems and wells in these communities are given below, and additional information may be found in the table of well records at the end of this report (Table 11).
Hutchinson—Hutchinson, the largest city in Reno County (population 33,575), is supplied water by the privately owned Hutchinson Water Co. from eight gravel-walled wells in the city. These wells obtain water from the alluvium and Wisconsinan deposits and range in depth from 50 to 75 feet. Yields of the wells range from 750 to 2,000 gallons a minute. Water is pumped directly into the distribution system and the required pressure is maintained by varying the number of wells pumping. The pumps of six wells are controlled from a central station to facilitate the maintenance of pressure. Two wells (23-6-1bdc and 23-6-12cd) are used continuously and provide most of the water. At times of peak loads additional wells are used. The average daily use of water is about 3 million gallons. The monthly and annual pumpage is given in Table 4. The quality of water varies from well to well. The wells providing the water of poorest quality are pumped only during periods of peak loads or for emergency use. The water at Hutchinson is very hard and is not treated except by chlorination at the wells (Table 5).
Table 4—Monthly and annual pumpage of water for the City of Hutchinson, in million of gallons (data provided by the Hutchinson Water Co.).
| Month | 1941 | 1942 | 1943 | 1944 | 1945 | 1946 | 1947 | 1948 | 1949 | 1950 | 1951 | 1952 | 1953 | 1954 |
|---|---|---|---|---|---|---|---|---|---|---|---|---|---|---|
| Jan | 82.0 | 68.0 | 74.8 | 81.7 | 71.0 | 81.0 | 92.7 | 83.0 | 81.5 | 79.5 | 88.4 | 94.2 | 100.1 | 118.4 |
| Feb | 75.5 | 61.7 | 67.8 | 72.5 | 64.3 | 75.1 | 83.0 | 78.6 | 75.3 | 73.3 | 80.7 | 84.5 | 90.1 | 108.4 |
| Mar | 68.1 | 68.9 | 77.8 | 73.2 | 73.2 | 84.1 | 91.9 | 82.5 | 84.5 | 85.9 | 90.1 | 89.8 | 106.6 | 120.9 |
| Apr | 59.5 | 65.4 | 82.4 | 66.3 | 69.5 | 93.5 | 95.3 | 92.6 | 88.8 | 98.6 | 87.4 | 91.3 | 131.4 | 142.7 |
| May | 68.6 | 77.5 | 81.3 | 74.6 | 80.8 | 95.3 | 102.3 | 111.6 | 88.8 | 109.0 | 98.0 | 113.3 | 156.0 | 134.4 |
| June | 78.2 | 70.4 | 91.4 | 95.8 | 81.2 | 127.5 | 100.3 | 111.5 | 106.3 | 137.4 | 99.2 | 198.3 | 208.2 | 188.5 |
| July | 106.6 | 93.6 | 103.4 | 91.3 | 100.2 | 175.2 | 154.5 | 114.6 | 131.6 | 109.7 | 117.3 | 200.5 | 183.1 | 265.4 |
| Aug | 89.7 | 78.0 | 114.3 | 90.6 | 100.4 | 147.2 | 167.3 | 116.8 | 123.7 | 98.8 | 136.8 | 168.3 | 201.6 | 242.8 |
| Sept | 78.0 | 71.9 | 83.1 | 76.2 | 95.1 | 121.4 | 142.4 | 113.3 | 93.5 | 95.1 | 112.6 | 169.2 | 181.0 | 213.4 |
| Oct | 68.9 | 71.5 | 81.6 | 64.2 | 80.0 | 102.0 | 113.1 | 89.3 | 91.7 | 97.8 | 98.1 | 141.6 | 148.8 | 140.3 |
| Nov | 65.3 | 63.1 | 79.1 | 68.8 | 76.7 | 88.4 | 107.6 | 77.5 | 80.6 | 86.9 | 90.5 | 106.8 | 113.7 | 115.1 |
| Dec | 64.7 | 68.2 | 85.8 | 71.3 | 82.1 | 86.7 | 82.6 | 79.2 | 80.4 | 87.2 | 90.6 | 106.0 | 116.1 | 107.9 |
| Annual | 905.1 | 858.2 | 1,022.8 | 926.5 | 974.5 | 1,277.4 | 1,333.0 | 1,150.5 | 1,126.7 | 1,159.2 | 1,189.7 | 1,563.8 | 1,736.7 | 1,898.2 |
Haven—The town of Haven (population 720) is supplied by three gravel-walled wells on the west edge of town. The wells obtain water from the Meade formation and Wisconsinan deposits south of the Arkansas River. Two of the wells are equipped with centrifugal pumps and yield about 250 gallons a minute each. The third well is equipped with a turbine pump and also yields about 250 gallons a minute. The water is pumped directly into the mains, and the system is equipped with a 55,000-gallon elevated steel tank for storage and pressure maintenance. The daily consumption of water varies from 60,000 gallons to 100,000 gallons. The water is hard and is not treated (Table 5).
Buhler—Prior to 1938 the water supply for Buhler was obtained from three wells in the Little Arkansas River valley. These wells were abandoned because of low yield and infiltration of fine sand. In 1938 two wells (22-4-l2dd1 and 22-4-12dd2) were drilled in the Meade formation 4 miles east of the city. These wells are 88 and 98 feet deep and are on the west edge of the McPherson Valley. Well 22-4-l2dd1 had a yield of 269 gallons a minute and a drawdown of 7.7 feet; well 22-4-12dd2 had a yield of 201 gallons a minute and a drawdown of 2 feet. The wells are gravel packed and are equipped with turbine pumps. For many years water was pumped directly into the distribution system, but in 1949 a treatment plant was built and the water has been treated since then. The water from the wells is high in carbon dioxide and thus is corrosive. The untreated water has a hardness of 461 parts per million, of which about two-thirds is of the carbonate type. The water is softened to a hardness of about 130 parts per million. The daily consumption of water averages about 35,000 gallons. The system includes an elevated steel storage tank having a capacity of 50,000 gallons.
Nickerson—The water supply for Nickerson is obtained from two wells that penetrate the alluvium of the Arkansas River valley in the center of the city. The wells are equipped with turbine pumps and have a combined yield of about 900,000 gallons a day. The average daily use of water is about 100,000 gallons. The water is pumped directly into the mains, and the system is equipped with a 50,000-gallon elevated steel tank for storage and pressure maintenance. The water is hard and is not treated (Table 5).
Arlington—The water supply for Arlington is obtained from two drilled wells in the Meade formation at the west edge of the city. The wells are equipped with turbine pumps that pump the water directly into the distribution system. The capacity of the two wells is about 170,000 gallons a day, and the average consumption is about 30,000 gallons a day. An elevated steel tank having a capacity of 50,000 gallons is used for storage. The water has a hardness of 141 parts per million and is not treated.
Sylvia—The water supply for Sylvia is obtained from two wells tapping the Meade formation and the Crete member of the Sanborn formation in the northwestern part of town. The wells are equipped with turbine pumps. When tested, each well had a yield of about 250 gallons a minute and a drawdown of 1 foot. The total capacity of the two wells as equipped is about 720,000 gallons a day and the consumption is about 20,000 gallons a day. Water is pumped to an elevated steel storage tank having a capacity of 50,000 gallons. The water has a hardness of 136 parts per million and is not treated.
Turon—The town of Turon obtains its water supply from two wells penetrating gravel of the Meade formation and the Crete member of the Sanborn formation in the northwestern part of town. Well 26-10-5dd1 is equipped with a turbine pump, which discharges water into an elevated steel storage tank having a capacity of 50,000 gallons. Well 26-10-5dd2 is equipped with a centrifugal pump and is used only in an emergency. Well 26-10-5dd2 yields an estimated 50 gallons a minute and well 26-10-5dd1 yields 125 gallons a minute. The average daily use is about 20,000 gallons. The water has a hardness of 196 parts per million and is chlorinated.
Pretty Prairie—The Pretty Prairie water supply is obtained from two wells penetrating the Meade formation and gravel of Blancan age in the western part of town. The wells are equipped with turbine pumps, which discharge water to an elevated storage tank having a capacity of 40,000 gallons. The water has a hardness of 129 parts per million (Table 5).
Industrial Supplies
Many industrial wells are in use in Reno County, principally in and near Hutchinson. The largest users of water are the Central Fiber Products Co., the Kansas Power and Light Co., the Carey Salt Co., and the Atchison, Topeka and Santa Fe Railway Co. Water from industrial wells is used for cooling, washing, ice manufacturing, and air conditioning, and by meat-packing plants, creameries, and foundries.
The Central Fiber Products Co. is supplied by four wells ranging in depth from 62 to 68 feet. Water is obtained from terrace deposits near the foot of the sandhills in the NE cor. sec. 8, T. 23 S., R. 5 W. The combined yield of the wells is 2,500 to 3,000 gallons a minute. The Atchison, Topeka and Santa Fe Railway Co. is supplied by two wells in the NE SE sec. 4, T. 23 S., R. 5 W. These wells are 40 feet deep and obtain water from terrace deposits near the foot of the sandhills. The yield from each well is 215 gallons a minute, and the annual pumpage is about 54 million gallons. In the fall of 1949 the Kansas Power and Light Co. had three wells drilled in the SE SW sec. 4, T. 23 S., R. 5 W. These wells are 50 to 55 feet deep and obtain water from terrace deposits of Wisconsinan age. Well 23-5-4cda was pumped at the rate of 1,600 gallons a minute for 4 hours and had a drawdown of 17 feet. The other wells were not tested, but an examination of samples of the gravel penetrated by the wells indicates that the yields from these wells should be almost as great as that of the well tested. About 300 gallons a minute is pumped from each well. The water from these wells is used to cool the condensers in the powerplant northeast of Hutchinson.
Not all industrial wells in Reno County were inventoried, so the total amount of water pumped from industrial wells is not known; however, the amount unquestionably exceeds the pumpage of the Hutchinson Water Co.
Irrigation Supplies
During the drought period from 1930 to 1939, some irrigation wells were drilled in parts of Reno County. Most of these wells have been abandoned, and at the time of the report no large plants were in operation. Water from several small wells was used for irrigating gardens and orchards, but an inventory was not made of the amount of water pumped in 1949. The total pumpage for irrigation was small in comparison with other uses, however, even before the larger wells were abandoned.
Character of Water
The chemical character of the water in Reno County is shown by analyses of 154 samples of water collected from 152 test holes and wells. The results of the analyses are given in Table 5. Partial analyses were made of 78 samples and more detailed analyses were made of 76 samples. In general, the analyses do not indicate the sanitary condition of the water. The analyses were made by Howard A. Stoltenberg, Chemist, in the Water and Sewage Laboratory of the Kansas State Board of Health.
Chemical Constituents in Relation to Use
Dissolved solids—When water is evaporated the residue consists mainly of the mineral constituents given in the table of analyses (Table 5). In addition to the mineral constituents, the residue generally includes small quantities of organic materials and a small amount of water of crystallization. Water containing less than 500 parts per million of dissolved solids is suitable generally for domestic use, except for difficulties resulting from hardness or the presence of iron in excessive amounts. Water containing more than 1,000 parts per million is likely to contain enough of certain constituents to cause noticeable taste or otherwise to make the water undesirable or unsuitable for use.
The dissolved solids in 76 samples collected in Reno County ranged from 152 to 18,200 parts per million; 13 of these samples contained between 500 and 1,000 parts per million and 12 samples contained more than 1,000 parts. Seven of these samples were from test holes and were taken directly above shale bedrock, which fact in part accounts for the high concentration of dissolved solids. Test holes 23-5-21aa, 23-5-15dd, and 23-5-23dd probably are affected by local contamination from industrial wastes.
Figure 16 shows the range in dissolved solids in the water from wells in Reno County. Samples of water from four wells contained more than 5,000 parts per million of dissolved solids. Two of these are Hutchinson municipal wells drilled in the alluvium of the Arkansas River and two are domestic wells drilled into or near to the Permian shales.
Figure 16—Dissolved solids in samples of water from wells and test holes.
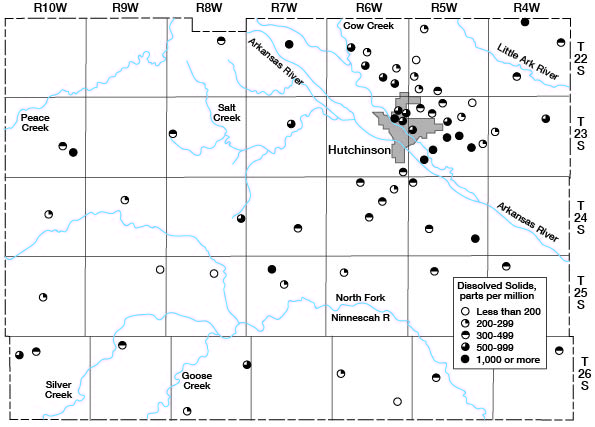
The water samples from about two-thirds of the wells and test holes contained less than 500 parts per million of dissolved solids (Table 6).
Table 6—Dissolved solids in samples of water from wells and test holes in Reno County.
| Dissolved solids (parts per million) |
Number of Samples |
|---|---|
| Less than 200 | 6 |
| 201 to 300 | 21 |
| 301 to 500 | 24 |
| 501 to 750 | 9 |
| 751 to 1,000 | 4 |
| 1,001 to 5,000 | 8 |
| 5,001 to 15,000 | 3 |
| More than 15,000 | 1 |
| TOTAL | 76 |
Hardness—The hardness of water, the property that generally receives the most attention, is most commonly recognized by its effect when soap is used with the water. Calcium and magnesium cause nearly all the hardness of ordinary water. These constituents also are the active agents in the formation of scale in steam boilers and in other containers in which water is heated or evaporated.
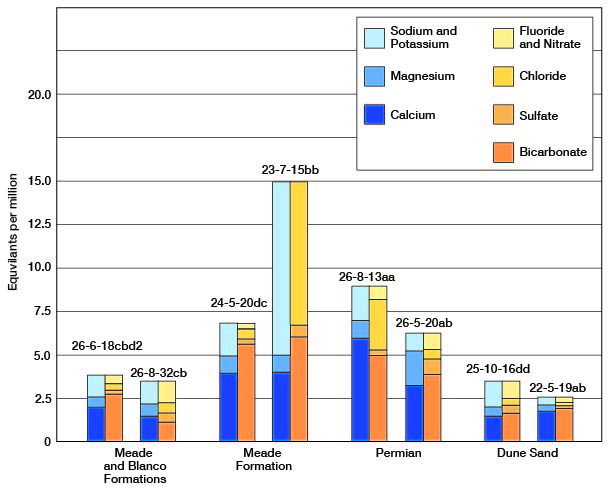
The total hardness, the carbonate hardness, and the noncarbonate hardness of the water samples from Reno County are given in Table 5 and Figures 17 and 18. The carbonate hardness, or "temporary hardness," is caused by calcium and magnesium bicarbonates and can be removed almost entirely by boiling. The noncarbonate hardness, or "permanent hardness," is caused by sulfates and chlorides of calcium and magnesium and other salts and cannot be removed by boiling. Carbonate and noncarbonate hardness react in the same manner in relation to the use of soap. Generally, water having noncarbonate hardness forms a harder scale in boilers than water having only carbonate hardness.
Figure 17—Analysis of water from the principal water-bearing formations.
Water having a hardness of less than 50 parts per million is rated as soft, and treatment for removal of hardness under ordinary circumstances is not necessary. Hardness between 50 and 150 parts per million does not seriously interfere with the use of water for most purposes, but it does increase the consumption of soap; laundries and other industries using large quantities of soap, or to which hardness is objectionable in some way other than through excessive soap consumption, may profitably soften such water. Water of this range of hardness will form scale in steam boilers and generally is softened before being used. Hardness of more than 150 parts per million is noticeable by almost everyone, and if it is much higher than 150 parts per million the water may be softened. (Rain water stored in cisterns may be used for domestic supply.) When municipal water is softened, generally the hardness is decreased to about 100 parts per million, depending to some extent upon the original hardness of the water. The advantages of further softening a municipal supply may not be economically justified.
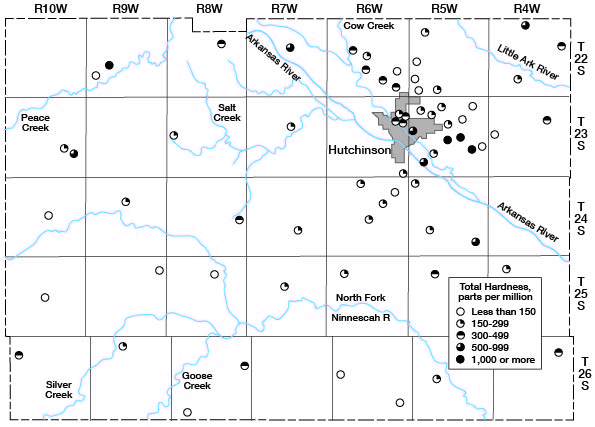
The hardness of water samples collected in Reno County ranged from 56 to 9,990 parts per million. Twenty-two of the samples had a hardness of less than 150 parts per million (Table 7). Most of the water from the Arkansas River valley had a hardness of more than 300 parts per million. The softest waters were those from the sandhills area north of Hutchinson and from the southern part of the county (Fig. 19). The hardest water was from test holes penetrating deposits just above the Permian shales. Some test holes south and east of Hutchinson show local contamination by industrial wastes (hardest waters shown in Fig. 19).
Table 7—Hardness of samples of water from wells and test holes in Reno County.
| Hardness (parts per million) |
Number of Samples |
|---|---|
| Less than 100 | 8 |
| 101 to 500 | 14 |
| 151 to 200 | 11 |
| 201 to 300 | 18 |
| 301 to 500 | 15 |
| 501 to 1,000 | 6 |
| 1,001 to 10,000 | 4 |
| TOTAL | 76 |
Figure 19—Hardness of samples of water from wells and test holes.
Iron—Next to hardness, iron is the constituent in natural waters that generally is the most objectionable. The quantity of iron in water may differ greatly from place to place although the water is obtained from the same formation. If the water contains more than 0.3 part per million of iron in solution, the iron upon oxidation may settle out as a reddish sediment. Iron, present in sufficient quantity, gives a disagreeable taste to water, stains cooking utensils and plumbing fixtures, and is objectionable in the preparation of foods and beverages. Generally, iron may be removed by aeration followed by settling, or filtration, but some waters require treatment with lime or other chemicals. Samples of water from 91 wells and test holes in Reno County were analyzed for iron. Table 8 shows the number of samples in certain concentration ranges of iron. Fifty-six samples contained more than 0.3 part per million.
Table 8—Iron in samples of water from wells and test holes in Reno County.
| Iron (parts per million) | Number of Samples |
|---|---|
| 0.0 to 0.10 | 19 |
| .11 to .3 | 16 |
| .31 to 1.5 | 22 |
| 1.6 to 5.0 | 20 |
| 5.1 to 10.0 | 8 |
| 10.1 to 20.0 | 3 |
| More than 20.0 | 3 |
| TOTAL | 91 |
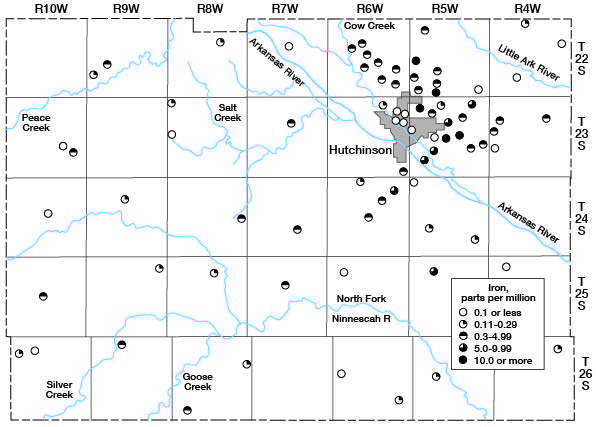
The highest concentration of iron in water is found in the sandhills area north and east of Hutchinson (Fig. 20).
Figure 20—Iron content of samples of water from wells and test holes.
Chloride—Chloride salts are found in nature in abundance. They are found in sea water and in oil-field brines and are dissolved in small quantities from many rock materials. Chloride has little effect on the suitability of water for ordinary use unless present in such concentration as to make the water unpotable. Water high in chloride content may be corrosive if used in steam boilers. The removal of the chloride ion from water is difficult and expensive.
Analyses for chloride were made for 153 samples of water from wells and test holes in Reno County (Table 5). The chloride content of the samples analyzed ranged from 4 to 9,870 parts per million. Table 9 shows the number of samples in various ranges of concentration of chloride. The five samples containing more than 2,500 parts were from test holes.
Table 9—Chloride in samples of water from wells and test holes in Reno County.
| Chloride (parts per million) | Number of Samples |
|---|---|
| Less than 50 | 78 |
| 51 o 250 | 39 |
| 251 to 500 | 21 |
| 501 to 2,500 | 10 |
| More than 2,500 | 5 |
| TOTAL | 153 |
The greatest concentration of chloride is in water from the Arkansas River valley, along Salt Creek, and in the northwestern part of the county. The source of the chloride in the northwestern part of Reno County is probably the marsh area in Stafford County. The high chloride in the area south and east of Hutchinson is probably due to local contamination by industrial wastes.
Fluoride—Fluoride in water occurs only in small quantities, but a knowledge of the fluoride content of water used by children is important because of the effect the fluoride has on permanent teeth. The use of water containing fluoride in excess of 1.5 parts per million may cause mottling of the tooth enamel. If the fluoride content is as high as 4 parts per million, about 90 percent of the children may have mottled teeth (Dean, 1936). Although too much fluoride has a detrimental effect, investigations indicate that concentrations of fluoride of about 1 part per million in drinking water lessen the incidence of tooth decay (Dean and others, 1941). The concentration of fluoride in the samples of water collected from wells in Reno County was less than 0.9 part per million.
Nitrate—Recent investigations have caused considerable interest in the amount of nitrate in drinking water. Large amounts of nitrate in water may cause cyanosis in infants when the water is used for drinking and in the preparation of formulas in feeding. Infant cyanosis may be fatal if water containing a high concentration of nitrate is used continually. Water that contains more than 90 parts per million of nitrate is considered by the Kansas State Board of Health likely to cause infant cyanosis (Metzler and Stoltenberg, 1950). Water containing less than 45 parts of nitrate is generally regarded as safe. In Reno County the nitrate content of the samples of water collected from wells ranged from 0 to 447 parts per million. Thirteen samples contained more than 100 parts per million.
Chemical Constituents in Relation to Irrigation
This discussion of the suitability of water for irrigation use is adapted from Agriculture Handbook 60 of the U.S. Department of Agriculture.
The development and maintenance of successful irrigation projects involve not only supplying of irrigation water to the land but also control of the salinity and alkalinity of the soil. The quality of irrigation water, irrigation practices, and drainage conditions are involved in salinity and alkali control. Soil that was originally nonsaline and nonalkali may become unproductive if excessive soluble salts or exchangeable sodium are allowed to accumulate because of improper irrigation and soil-management practices or inadequate drainage.
In areas of sufficient rainfall and ideal soil conditions the soluble salts originally present in the soil or added to the soil with water are carried downward by the water and ultimately reach the water table. The process of dissolving and transporting soluble salts by the movement of water through the soil is called leaching. If the amount of water applied to the soil is not in excess of the amount needed by plants, there will be no downward percolation of water below the root zone and an accumulation of mineral matter will form at that point. Likewise, impermeable soil zones near the surface can retard the downward movement of water, resulting in waterlogging of the soil and deposition of salts. Unless drainage is adequate, attempts at leaching may not be successful, because leaching requires the free passage of water through and away from the root zone.
The characteristics of an irrigation water that seem to be most important in determining its quality are: (1) total concentration of soluble salts; (2) relative proportion of sodium to other principal cations (magnesium, calcium, and potassium); (3) concentration of boron or other elements that may be toxic; and (4) under some conditions, the bicarbonate concentration as related to the concentration of calcium plus magnesium.
The total concentration of soluble salts in irrigation water can be adequately expressed in terms of electrical conductivity for purposes of diagnosis and classification. Electrical conductivity is the measure of the ability of the ionized inorganic salts in solution to conduct an electrical current, and is usually expressed in terms of micromhos per centimeter at 25°C. The electrical conductivity can be determined accurately in the laboratory, or a rough approximation of the electrical conductivity can be obtained by multiplying the total equivalents per million of calcium, sodium, magnesium, and potassium by 100, or by dividing the dissolved solids in parts per million by a factor of 0.6 to 0.7. In general, water having an electrical conductivity below 750 micromhos per centimeter is satisfactory for irrigation insofar as salt content is concerned, although salt-sensitive crops such as strawberries, green beans, and red clover may be adversely affected by irrigation water having an electrical conductivity in the range of 250 to 750 micromhos per centimeter. Water in the range of 750 to 2,250 micromhos per centimeter is widely used, and satisfactory crop growth is obtained under good management and favorable drainage conditions, but saline conditions will develop if leaching and drainage are inadequate. Use of water having a conductivity of more than 2,250 micromhos per centimeter is not common, and very few instances can be cited where such waters have been used successfully.
In the past the relative proportion of sodium to other cations in irrigation water usually has been expressed simply as the percentage of sodium among the principal cations (expressed in equivalents), or simply the percent sodium. According to the U. S. Department of Agriculture the sodium-adsorption ratio, used to express the relative activity of sodium ions in exchange reactions with soil, is a better measure of the suitability of water for irrigation with respect to the sodium (alkali) hazard. The sodium-adsorption ratio, or SAR, may be determined by the formula
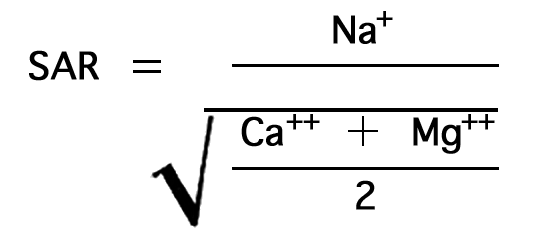
where the ionic concentrations are expressed in equivalents per million. The sodium-adsorption ratio may be determined also by use of the nomogram shown in Figure 21. In using the nomogram to determine the sodium-adsorption ratio of a water, the concentration of sodium expressed in equivalents per million is plotted on the left-hand scale, and the concentration of calcium plus magnesium expressed in equivalents per million is plotted on the right-hand scale. The point at which a line connecting these two points intersects the scale for sodium-adsorption ratio determines the sodium-adsorption ratio of the water. When the sodium-adsorption ratio and the electrical conductivity of a water are known, the classification of the water for irrigation can be determined by graphically plotting these values on the diagram shown in Figure 22. Table 10 gives the index numbers for the wells plotted on Figure 22 and the sodium-adsorption ratio and electrical conductivity of the water samples for which analyses are given in Table 5. Low-sodium water (S1) can be used for irrigation on almost all soils with little danger of the development of harmful levels of exchangeable sodium. Medium-sodium water (S2) will present an appreciable sodium hazard in certain fine-textured soils, especially poorly leached ones. Such water may be used safely on coarse-textured or organic soils having good permeability. High-sodium water (S3) may produce harmful levels of exchangeable sodium in most soils and will require special soil management such as good drainage and leaching and additional organic matter. Very high sodium water (S4) is generally unsatisfactory for irrigation unless special action is taken, such as addition of gypsum to the soil.
Figure 21—Nomogram used to determine the sodium-adsorption ratio of water.
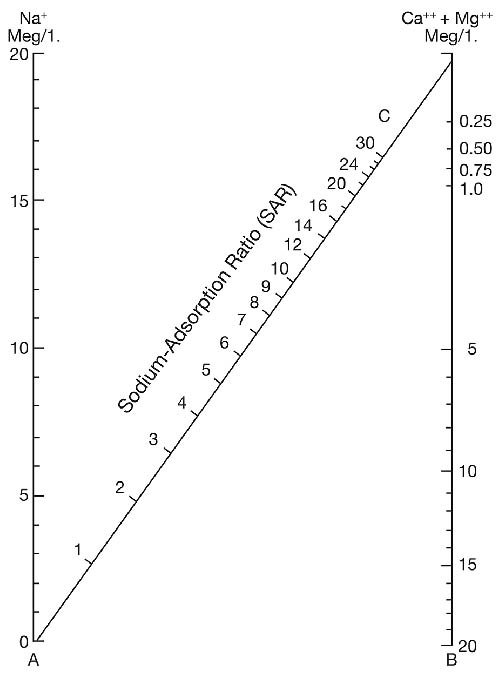
Table 10—Index numbers of samples shown on Figure 22 and the sodium-adsorption ratio (SAR) and conductivity of water samples for which analyses are given in Table 5.
| Well Number | Sodium-adsorption Ratio |
Conductivity (micromhos) 100 x Ca + Mg + Na |
Index Number (Fig. 22) |
|---|---|---|---|
| 22-4-4aad | 3.9 | 2,570 | 1 |
| 22-4-12dd1 | 4.0 | 710 | 23 |
| 22-4-28cb | 1.1 | 740 | 24 |
| 22-5-5cd | .8 | 490 | |
| 22-5-19ab | .3 | 260 | 2 |
| 22-5-30cb | 1.2 | 390 | |
| 22-5-30dc | 1.5 | 320 | 25 |
| 22-5-31ad | 1.4 | 440 | |
| 22-5-32dd | 1.0 | 570 | 26 |
| 22-6-15ccb | 1.0 | 500 | |
| 22-6-15cd | .5 | 500 | 3 |
| 22-6-17ad | 3.1 | 1,210 | 27 |
| 22-6-21dd | 3.3 | 1,360 | 28 |
| 22-6-22ad | .9 | 520 | |
| 22-6-24ccd | 1.1 | 410 | |
| 22-6-26cb | 3.8 | 1,270 | 29 |
| 22-6-36bb | 2.5 | 1,170 | 30 |
| 22-7-15bb1 | 5.7 | 2,290 | 31 |
| 22-8-11ccd | .7 | 820 | 4 |
| 22-9-20dd | 68.5 | 30,900 | |
| 22-9-30aad | 1.8 | 470 | |
| 23-4-11dab | 2.0 | 1,400 | 32 |
| 23-4-18ccb | 2.0 | 340 | 5 |
| 23-5-2dca | 1.1 | 210 | 33 |
| 23-5-4bbd | .8 | 500 | |
| 23-5-6dd | 1.6 | 630 | |
| 23-5-8aa | .8 | 640 | |
| 23-5-11cb | 1.5 | 400 | |
| 23-5-13dd | 1.7 | 290 | 34 |
| 23-5-13dd | 1.2 | 320 | |
| 23-5-14da | 2.4 | 370 | |
| 23-5-15dd | 6.2 | 26,200 | |
| 23-5-16aa | 3.3 | 1,620 | 35 |
| 23-5-18bcd | 6.8 | 2,580 | 6 |
| 23-5-21aa | 16 | 24,200 | |
| 23-5-23dd | 6.1 | 5,280 | 36 |
| 23-5-24ad | 1.1 | 420 | |
| 23-5-29aa | 9.0 | 2,120 | 7 |
| 23-5-32bb | 15 | 6,770 | 37 |
| 23-6-1aa | 1.3 | 820 | |
| 23-6-12ad | 3.2 | 1,260 | |
| 23-6-12bdd | 2.2 | 960 | 38 |
| 23-6-12cc | 4.5 | 1,900 | 9 |
| 23-6-12cd | 2.3 | 1,080 | 39 |
| 23-6-36dd | 3.1 | 730 | 8 |
| 23-7-15bb | 6.5 | 1,500 | 40 |
| 23-8-18cc | 1.9 | 720 | |
| 23-10-23dc | 1.7 | 580 | 10 |
| 23-10-25bb | 51 | 14,500 | |
| 24-5-6bbc | 1.5 | 650 | |
| 24-5-20dc | 1.6 | 690 | |
| 24-5-25cb | 2.1 | 1,850 | 11 |
| 24-6-4ab | 1.4 | 610 | |
| 24-6-11cc | 2.0 | 700 | |
| 24-6-12bb | 1.5 | 460 | 12 |
| 24-6-22bb | 1.0 | 670 | |
| 24-7-22dd | 1.1 | 580 | 13 |
| 24-8-24aa | 3.2 | 1,310 | |
| 24-9-10bc | .5 | 420 | 14 |
| 24-10-15cab | 1.1 | 410 | |
| 25-4-5cab | 1.3 | 780 | 15 |
| 25-5-8aa | .4 | 710 | |
| 25-6-8bab | .6 | 380 | 16 |
| 25-7-16aa | .4 | 450 | 17 |
| 25-8-10abc1 | 2.3 | 550 | |
| 25-9-1dcd | .9 | 270 | |
| 25-10-16dd | 1.6 | 350 | 18 |
| 26-4-2dd | .7 | 760 | 19 |
| 26-5-20ab | .8 | 530 | |
| 26-6-18cdb2 | 1.0 | 380 | 20 |
| 26-6-26da | 1.0 | 320 | |
| 26-8-13aa | 1.1 | 900 | |
| 26-8-32cb | 1.2 | 350 | 21 |
| 26-9-4bba | 1.1 | 490 | |
| 26-10-5dd1 | 2.7 | 790 | 22 |
| 26-10-7abd | 1.7 | 950 | |
Figure 22--Diagram showing suitability of waters for irrigation.
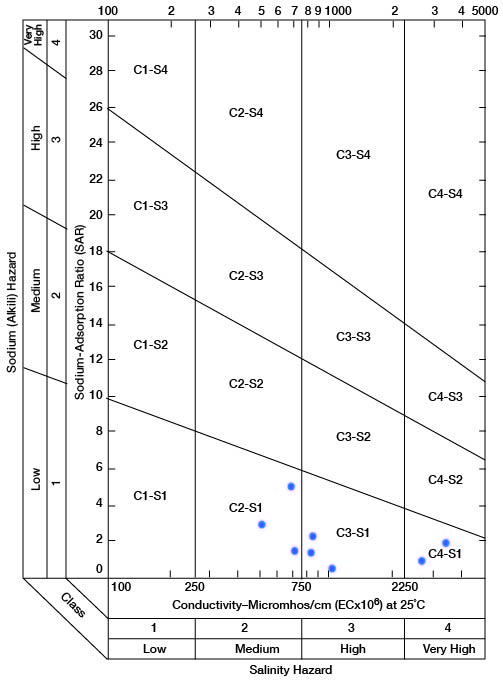
Low-salinity water (C1) can be used for irrigation of most crops on most soils with little likelihood that soil salinity will develop. Medium-salinity water (C2) can be used if a moderate amount of leaching occurs. Crops of moderate salt tolerance, such as potatoes, corn, wheat, oats, and alfalfa, can be irrigated with C2 water without special practices. High-salinity water (C3) cannot be used on soils of restricted drainage. Very high salinity water (C4) is not suitable for irrigation under ordinary conditions. It can be used only on very salt tolerant crops and then only if special practices are followed, including a high degree of leaching.
Boron is essential to normal plant growth, but the quantity required is very small, and larger quantities are harmful. Crops vary greatly in their boron tolerance, but in general it may be said that the ordinary field crops common to Kansas are not adversely affected by boron concentrations of less than 1 part per million.
In water having high concentrations of bicarbonate, there is a tendency for calcium and magnesium to precipitate as the water in the soil becomes more concentrated. This reaction ordinarily does not go to completion, but insofar as it does proceed there is a reduction in the concentration of calcium and magnesium and therefore a relative increase in sodium. The calcium and magnesium are precipitated as the carbonates, and any residual carbonate or bicarbonate is left in solution as sodium carbonate. The potential amount of such "residual sodium carbonate" may be computed (Na2CO3) = (CO3-- + HCO3-) - (Ca++ + Mg++), where the ionic concentrations are expressed as milliequivalents per liter or equivalents per million.
On the basis of limited data and using the "residual sodium carbonate" concept described above, it is concluded by the Department of Agriculture that water having more than 2.5 equivalents per million (eq/in) or milliequivalents per liter (meq/1), of residual sodium carbonate is not suitable for irrigation purposes. Water containing 1.25 to 2.50 eq/m of residual sodium carbonate is marginal, and water containing less than 1.25 eq/m is safe.
In appraising the quality of an irrigation water, first consideration must be given to salinity and alkali hazards by reference to Figure 22. Then consideration should be given to independent characteristics such as boron and other toxic elements, and bicarbonate, any one of which may change the quality rating. The use of water of any quality must take into account such factors as drainage and management practices.
Sanitary Considerations
The analyses of water given in Table 5 show only the amounts of mineral matter in the water and do not, in general, indicate the sanitary quality of the water. An abnormal concentration of several constituents, such as more than a few parts per million of nitrate or a high concentration of chloride in an area in which the water is generally low in chloride, may indicate pollution of the water. Every precaution should be used to protect a water supply from pollution. A well should not be constructed near possible sources of pollution such as barnyards, privies, and cesspools. Every well should be sealed tightly for several feet below the surface. Dug wells are more likely to become polluted than drilled wells because of difficulty in sealing the well at the top. Drilled wells generally are properly sealed by a casing, but sometimes the casing itself is poorly sealed at the surface.
Quality of Water in Streams
In 1934 and 1935 a survey was made of the chloride content of the water of the Arkansas River and its main tributaries from Great Bend to the confluence of Cow Creek and the Arkansas River southeast of Hutchinson. Again in 1946 samples were collected at many of these same points (Fent, 1950), and in 1949 more samples were collected at some of the same locations. Although the analyses show a difference in the chloride concentration at the same points on the different dates of collection, a pattern seems to be established. The water in the Arkansas River at Great Bend has a low chloride content and gains only a small amount of chloride as the river passes through the oil fields in western Rice County. Samples were taken at points on the river just above and below Rattlesnake Creek; the chloride content of the sample taken below the creek was double that of the sample taken above. Farther downstream, just below the mouth of Peace Creek, the chloride content increased again, and just below the sewer outlet at Hutchinson the chloride content increased still more. Below the confluence of Cow Creek and the Arkansas River, the chloride content increased again. From this point to the east edge of Reno County, the chloride concentration remained about the same.
Samples were collected along Rattlesnake Creek in Stafford and Rice counties to determine the source of the chloride in that stream. At a point just west of St. John, the water is very low in chloride. The stream shows only a slight increase in chloride content above the oil fields in eastern Stafford County and no appreciable increase at a point just below the oil fields. At a point in Rice County about 2 miles east of the big marsh area in eastern Stafford County, the chloride concentration was about three times as high as at St. John. Samples were collected along Peace Creek in northwestern Reno County. Peace Creek flows nearly at right angles to the movement of the ground water from the marsh area in Stafford County. The chloride concentration in Peace Creek increases as the stream intercepts the ground water moving from the marshes. Cow Creek was sampled at a point just west of the Rice County line. The chloride content of the water at that point was moderately high. At a point just below the oil fields in northwestern Rice County, the chloride content had decreased to about half the concentration at the county line. The chloride concentration continued to decrease in the stream to a point just below the salt plants at Lyons in Rice County, where an appreciable increase was noted. Below the salt plants the chloride concentration became progressively lower downstream to a point just below Hutchinson, where a large increase was noted.
The chloride content of the Ninnescah River is about 250 parts per million throughout its course in the county. The chloride salts in the Arkansas River and its tributaries are derived from the Permian shale in the marsh area of eastern Stafford County, as shown by the increase in chloride concentration in both Rattlesnake and Peace creeks. Along upper Cow Creek the chloride is derived from the Cretaceous rocks. Downstream from the outcrop of the Cretaceous rocks, the chloride concentration decreases except near Lyons, where a large increase occurs as the result of local contamination. The chloride content increases again below Hutchinson because of local contamination from the salt mines. The oil fields in this area seem to have little effect on the chloride concentration in the streams, as most of the oil-field wastes are injected into deep saltwater aquifers.
Pollution of the Arkansas River and its tributaries in this area has been studied further by the Kansas State Board of Health (1954). The Board of Health has concluded that: (1) The reach of the Arkansas River from a point above Hutchinson to a point below Wichita is seriously polluted by brine from salt plants, by inadequately treated municipal sewage, and by organic industrial wastes. (2) Large quantities of brine from four salt plants are discharged into streams in the area. Two of these plants discharge into Cow Creek, one discharges into Salt Creek, and the other discharges into the Hutchinson industrial sewer, which empties into the Arkansas River. (3) Appreciable quantities of oil-field brines are discharged into surface ponds. (4) Some of the municipal sewage-treatment plants are overloaded and sewage receives inadequate treatment. (5) None of the industries discharging process wastes into the river has adequate treatment facilities.
Until pollution is corrected there is little chance that further use can be made of Arkansas River water especially if the user requires freshwater. Chlorides and other pollutants make it unsatisfactory for use or make treatment prohibitively expensive.
There is a good possibility that if the quality of water in the Arkansas River is improved it can be used in ground-water recharging projects at selected streamflows. This would permit storage for later use of much of the water now lost during higher streamflows. Improvement of quality of water in the streams should also eventually lead to an improvement in quality of water in the alluvium and low terrace deposits in the valley area.
Prev Page—Ground Water || Next Page—Geologic Formations
Kansas Geological Survey, Geology
Comments to webadmin@kgs.ku.edu
Web version Feb. 2001. Original publication date Aug. 1956.
URL=http://www.kgs.ku.edu/General/Geology/Reno/gw04.html