|
|
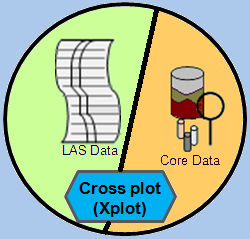
The Cross Plot Applet was created to assist the user in plotting Log ASCII
Standard (LAS) Data and Measured Core Data in a standard 2D Plots. This Applet
is an interactive web application that allows the user to search, load, parse
geological data from the user's PC or from the Kansas Geological Survey (KGS)
database & file server. The user can display the following plots,
- XY Plot User selects the curves from the data curves loaded.
- Rhomaa-Tmaa Plot Apparent Matrix Density (Rhomaa) -
Apparent Acoustic Transit Time (Tmaa) cross plot
- MN PlotLitho-Porosity cross plot "M" and "N" from the
Sonic-Density-Neutron logging data
- Rhomaa-Umaa Plot Apparent Matrix Density (Rhomaa) -
Apparent Photoelectric Factor (Umaa) cross plot
- Rhomaa-NPHI Plot Apparent Matrix Density (Rhomaa) -
Neutron Porosity (NPHI) cross plot
- Porosity Difference Plot (Neutron Porosity-Density Porosity) vs
Neutron Porosity (NPHI) cross plot
- Th-K Plot Thorium - Potassium cross plot
- Th-U Plot Thorium - Uranium cross plot
- Th/K - Th/U PlotSpectral Gamma Ray Ratio cross plot
The program allows the user to filter the data by depth range,
Gamma Ray (API) Log Data, Thorium-Potassium Ratio Mineral data,
Tops Data, Lithology/Texture Descriptions.
|


