Kansas Geological Survey, Public Information Circular (PIC) 7
Prev. Page--Start of the Report || Next Page--Summary and Glossary
![]()
![]()
![]()
![]()
Kansas Geological Survey, Public Information Circular (PIC) 7
Prev. Page--Start of the Report ||
Next Page--Summary and Glossary
Reported well yields in the Dakota aquifer of Kansas range widely and are generally the highest in central and southwestern Kansas. Well yields of up to 1,000 gallons per minute (63.1 L/sec) have been reported from Hodgeman and Ford counties. Well yield depends on the design and condition of the well, the pumping equipment, and the aquifer's ability to produce water. The most important factors governing the ability of the Dakota aquifer to produce water are the thickness of the sandstone and its permeability. In general, the greater the thickness of sandstone adjacent to the well screen, the greater the yield because more of the aquifer is available to the well. The more permeable the sandstone, the greater the yield. Limited laboratory and field tests indicate that the sandstones of the Dakota aquifer are generally more permeable in central Kansas than they are farther to the west.
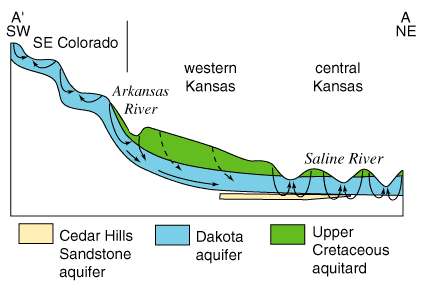
Over most of its extent in Kansas, the Dakota is overlain by a relatively impermeable sequence of younger shale and chalk units that form the Upper Cretaceous aquitard (fig. 3). Outcrops of some of the units that form this aquitard can be seen, for example, in roadcuts in Russell and Ellis counties where I-70 crosses the Blue Hills region. The aquitard increases in thickness toward the northwest corner of the state where it is more than 2,000 feet (610 m) thick. Where this aquitard is present, the Dakota is a confined aquifer. Water levels in wells screened in a confined aquifer are higher than the top of the aquifer (fig. 4A). This occurs because ground water throughout the confined aquifer is under fluid pressure.
Figure 3--Cross section showing ground-water flow patterns in the confined Dakota aquifer and the overlying Upper Cretaceous aquitard from south-eastern Colorado to central Kansas. Note the thick aquitard above the confined Dakota in western Kansas. The negligible amount of recharge entering the Dakota from the aquitard is indicated by the dashed arrows. Trace of cross section shown in fig. 1.
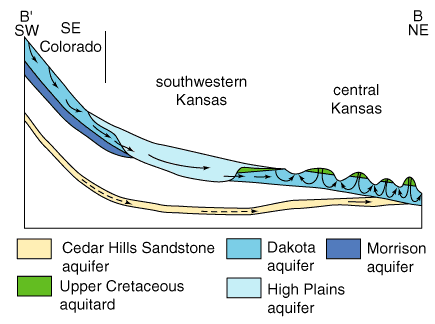
Elsewhere, the Dakota aquifer is unconfined. The water level in a well screened in an unconfined aquifer is approximately equal to the elevation of the water table. Where the Dakota aquifer is at or near the surface, such as in north-central Kansas (fig. 1), the water table defines the top of the aquifer (fig. 4B). However, in some places the Dakota is in contact with an overlying unconfined aquifer, such as the High Plains aquifer in southwestern and south-central Kansas (figs. 1, 5). Water levels in the Dakota aquifer in these parts of the state are approximately at the same elevation as the water table in the overlying aquifer because both aquifers are hydraulically connected and behave as a single system.
Figure 4--Water levels in wells screened in confined (A) and unconfined (B) aquifers.
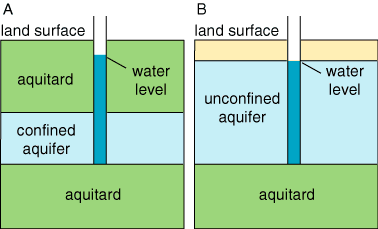
Figure 5--Cross section showing ground-water flow patterns in the mostly unconfined Dakota aquifer, High Plains aquifer, and Cedar Hills Sandstone aquifer from southeastern Colorado to central Kansas. Note the ground-water flow pattern between the Dakota and High Plains aquifers in southwestern Kansas. The negligible flow of ground water in the Cedar Hills Sandstone in the southwestern part of the cross section is indicated by the dashed arrows. Trace of cross section shown in fig. 1.
The recharge area for the confined Dakota aquifer in Kansas is in southeastern Colorado (figs. 1, 3). The cross section shown in figure 3 is along one flow path from the regional recharge area to the discharge area of the confined Dakota aquifer. Much of the northeastward flow in the Dakota from the regional recharge area is intercepted by the Arkansas River near the Kansas-Colorado border. As a result, only a small portion of the recharge entering the aquifer in the regional recharge area actually flows into the confined Dakota aquifer in western Kansas. Research indicates that where the Upper Cretaceous aquitard is thickest, freshwater recharge from overlying sources to the Dakota is negligible. Ground water exits from the confined Dakota aquifer in the regional discharge area in central Kansas where the eastward-flowing rivers have cut down through the Upper Cretaceous aquitard and into the Dakota aquifer.
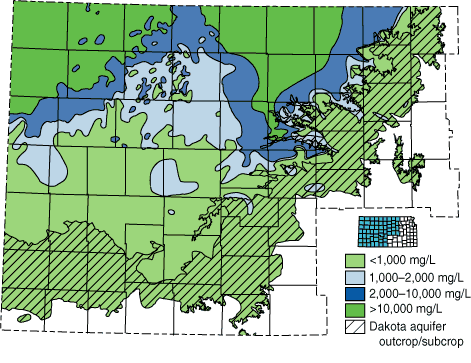
Ground-water flow rates in the confined Dakota are very low compared to those in the High Plains aquifer or stream-aquifer systems. Consequently, depending on the flow path, ground water takes from tens of thousands of years to millions of years to travel from the regional recharge to the discharge area. Over the millions of years that this flow system has been operating, freshwater recharge has flushed the salinity (the total concentration of the dissolved constituents in the water) from a large part of the upper Dakota aquifer in Kansas and southeastern Colorado (fig. 6).
Elsewhere, such as in northwest and north-central Kansas, recharge has not been as effective at removing saline water from the Dakota. The northwest corner of the state is very far away from the regional recharge area and freshwater recharge from the Upper Cretaceous aquitard is negligible. In north-central Kansas, an additional source of recharge to the confined lower Dakota comes from the underlying Cedar Hills Sandstone where both aquifers are in contact (figs. 1 and 6). The Cedar Hills Sandstone contains saltwater from the dissolution of naturally occurring salt and other readily soluble minerals. In much of north-central and northwest Kansas, ground-water salinity exceeds 10,000 mg/L (milligrams per liter) and is far too salty for most uses. Because ground-water salinity generally increases with depth in the upper and lower Dakota aquifers throughout their extent in Kansas, the best quality water is usually found at the top of the Dakota aquifer.
Figure 6--Distribution of total dissolved solids (TDS) concentrations in ground waters in the upper Dakota aquifer in western and central Kansas. Water containing less than 1,000 mg/L TDS is defined as fresh. Water with 1,000-2,000 mg/L TDS is usable for many purposes but is less desirable than freshwater. A concentration of 10,000 mg/L TDS is defined in the State regulations of the Kansas Corporation Commission as the upper limit of usable water; above 10,000 mg/L, a water is classified as unusable or mineralized.
The unconfined Dakota in central Kansas is locally recharged by infiltrating precipitation, averaging about 0.2-0.3 inches/year (0.5-0.8 cm/yr). Ground water moves faster in the unconfined Dakota and is returned to the surface locally through freshwater and saltwater springs, seeps, and marshes. Salt marshes are common in some of the river valleys of north-central Kansas, such as the Jamestown salt marsh in northwestern Cloud and southwestern Republic counties. The discharge of saltwater from the Dakota diminishes surface-water quality during periods of low flow in some of the river systems that cross this part of the state, such as the Saline River.
The unconfined Dakota aquifer is also recharged by water from southeastern Colorado (fig. 5). In southwestern Kansas, the Dakota aquifer, sandstone aquifers in the Morrison, and the High Plains aquifer behave as a single, hydraulically connected system. Ground water from the Dakota and aquifers in the underlying Morrison moves into the High Plains aquifer near the Kansas-Colorado border. In Gray and northern Meade counties, ground-water flow is from the High Plains to the Dakota aquifer.
Prev. Page--Start of the Report || Next Page--Summary and Glossary
Kansas Geological Survey, Public Outreach
bsawin@kgs.ku.edu
Web version April 1997
http://www.kgs.ku.edu/Publications/pic7/pic7_2.html