![]()
![]()
![]()
Kansas Geological Survey, Public Information Circular (PIC) 38
A complete version of this PIC is available as a pdf document.
Robert S. Sawin, Catherine S. Evans, and John W. Dunham
Kansas Geological Survey
Geology is a part of our everyday lives, usually in ways we don't think about. Not anticipating the effect our activities may have on our natural surroundings and the effect geology may have on us can be expensive, both economically and environmentally. In Kansas, geologically related disasters cost businesses and individuals millions of dollars each year and endanger lives. Highways sink, buckle, or are displaced; houses slide down hillsides; buildings crack or are infiltrated by groundwater. Understanding the near-surface geology and incorporating geologic evaluations into planning processes can prevent many structural and environmental problems and keep people safe.
Geologic maps, the principal source of information about the geology and natural resources at or near the surface, are essential for evaluating natural resources, making economic decisions, and guiding public policy. The Kansas Geological Survey (KGS) makes basic geologic information about the state available to the public through its county geologic mapping program. This circular explains what geologic maps are, how they are made, what they are used for, why they are valuable, and where to obtain them for Kansas.
Geologic maps (fig. 1) depict bedrock--the solid rock at the Earth's surface or directly beneath the vegetation, soil, and thin deposits of unconsolidated material collectively called "cover." Limestone, sandstone, and shale are common types of bedrock in Kansas.
Figure 1--Portion of the Tallgrass Prairie National Preserve geologic map (Chase County). The bedrock geology includes layers of limestone--some with embedded chert, or flint--mudstone, and shale representative of the Flint Hills. Colors in the key represent rock units shown on the map.
Soils and thin, unconsolidated surface or near-surface materials derived from bedrock through erosion are considered part of the cover and are generally not shown on geologic maps. However, in areas where bedrock is covered with thick and widespread deposits of sand, gravel, clay, silt, and other materials carried in by wind, water, and ice, the deposited material instead of the deeper bedrock is depicted on the map. Sediment deposits up to tens of feet thick in Kansas include alluvium, loess, sand dunes, and glacial drift. Alluvium consists of unconsolidated sand, gravel, clay, and silt that has been carried in by water in recent geologic time and deposited on flood plains or in stream valleys. Loess (pronounced in various ways but often rhymed with "us") is a thick layer of unstratified sediment--mainly silt derived from glacial materials and deposited by the wind. Sand dunes are formed from windblown material--mainly sand derived from alluvial deposits. Glacial drift is composed of rock fragments and sediment--from massive boulders to silt--eroded, transported, and deposited by glaciers or glacial meltwater.
Each geologic map graphically portrays the type, age, and distribution of surface or near-surface rock units in a state, county, region, or area of interest, such as the Tallgrass Prairie National Preserve in the Flint Hills in Chase County shown in fig. 1. Each unit is identified and named based on distinctive characteristics that can be mapped over large distances. For example, the Wreford Limestone, named after the unincorporated community of Wreford in Geary County, is found throughout the Flint Hills, including in the preserve and in roadcuts along Interstate 70. Attributes that help distinguish Wreford Limestone from other rock units include its thickness and the presence of chert, also called flint.
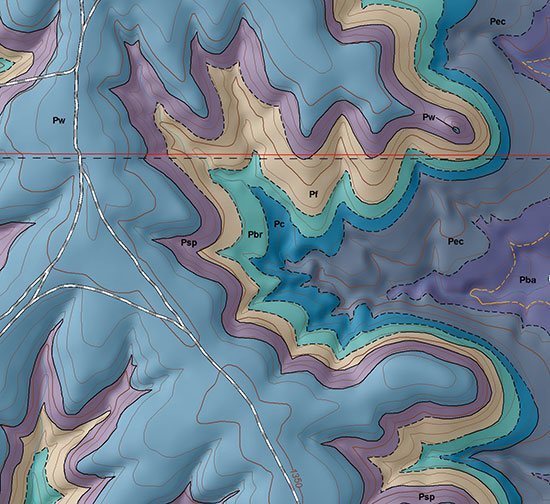
Lines, symbols, and colors are used on a geologic map to show the relationship between rock units and to accentuate the three-dimensionality of the bedrock geology (fig. 2). Folds, faults, fractures, and other geologic features created by deformation and displacement of the rocks are shown where they would appear if the overlying soil were stripped away. Lakes, rivers, roads, towns, and other natural and cultural features are included to help users pinpoint locations. A rock column showing the names and descriptions of each rock unit and the order in which they were deposited over time (fig. 3) is included on each map. The KGS also provides a general description of the local geology and water and mineral resources. Geologic maps often have a geologic cross section that represents a vertical slice of subsurface rock layers through a designated area (fig. 4).
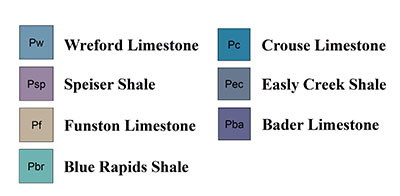
Figure 2--Portion of the Saline County geologic map southwest of Salina, which includes Coronado Heights, the Smoky Hill Buttes, and I-135/U.S. Highway 81 and Kansas Highway 4. Names of the rock units (identified by colors) are shown in fig. 3. Key: Green lines = highways; heavy red lines = primary roads; gray lines = light duty roads; brown lines = contour lines showing elevation; red numbers = section numbers (part of a legal description used to identify properties).
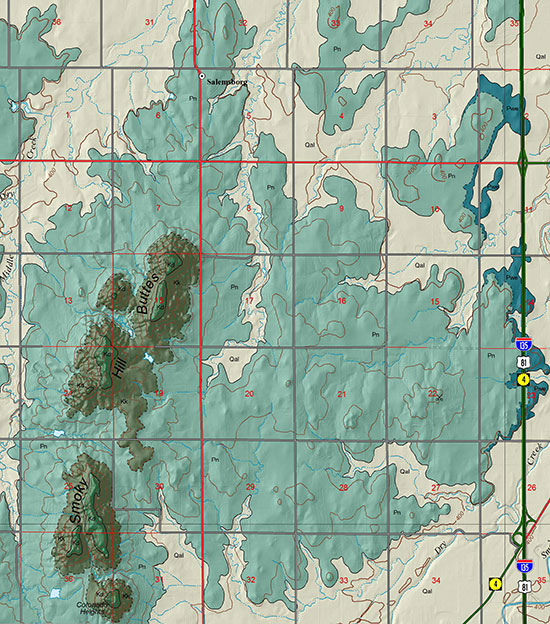
Photo: Coronado Heights, a scenic overlook and park, as seen from the east (bottom left on map).
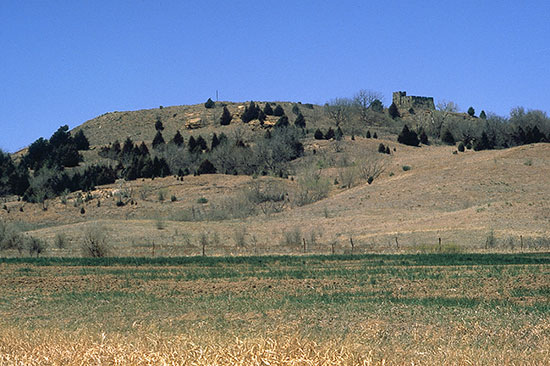
Figure 3--Stratigraphic column showing geologic units on the Saline County map in fig. 2, from oldest to youngest (bottom to top). Mbr = member; Fm = formation; Sh = shale.
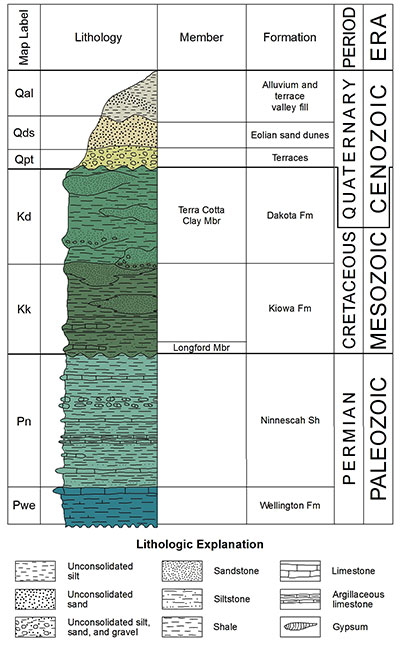
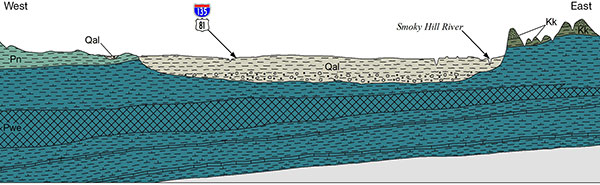
Figure 4--Geologic cross section (from Saline County map) illustrating a vertical section of the subsurface rock layers along a line running west to east across the county. The line runs through southern Salina, which is located in the Smoky Hill River valley. I-135 and the Smoky Hill River in this area run perpendicular to the cross section. Names of the rock units (identified by colors) are shown in fig. 3. Cross hatching in the Wellington Formation represents the Hutchinson Salt Member. The bottom of the cross section is about 350 feet below the surface. Rocks beneath the Wellington, the oldest formation found at the surface in Saline County, are not included on the cross section.
Compiled from the most comprehensive information available--including first-hand field observations and previously published maps and reports--geologic maps and the digital data associated with them are the best starting point for any project concerning the use, conservation, or study of natural resources. They can be useful when
Engineers, architects, developers, and city planners, in particular, use geologic maps to assess the feasibility of construction and development at a specific site to avoid safety, health, and financial risks. When the location of a floodplain or landslide hazard is not considered during urban development, a preventable disaster could occur. If building construction is not adapted to the local geology, concrete may crack, foundations may shift, basements may flood, and large structures may even collapse. Dam failures due to unstable geology endanger downstream communities and farms.
On a smaller scale, a landowner can use a geologic map when choosing a site to drill a domestic water well or construct a farm pond. For example, a pond built in shale containing clay that forms a tight seal should hold water while one built in sand and gravel, on porous sandstone, or on fractured limestone will likely drain.
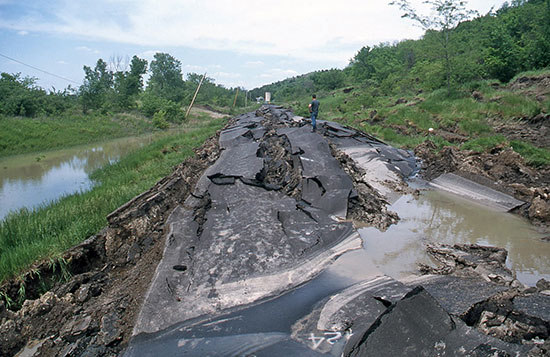
The information on geologic maps is helpful, and often essential, for any project that will affect or be affected by the type and structure of the underlying bedrock, water resources, and other natural resources. Assessing the geology of a site before altering it in any way increases the chance of foreseeing and avoiding construction failures, environmental damage, and natural disasters. Once a problem has occurred, such as the landslide that took out a section of McDowell Creek Road south of Manhattan in 1995 (fig. 5), geologic maps are used to evaluate the surface geology, plan reconstruction, and avoid future problems.
Figure 5--A section of McDowell Creek Road just south of Manhattan, damaged by a landslide after heavy rains in the spring of 1995. The roadway was displaced about 20 feet vertically and 40 feet horizontally.
Geologic maps are made by scientists with the training and experience needed to identify rocks at the surface; make inferences about the near-surface geology underlying the cover of soil, vegetation, and thin deposits of unconsolidated materials; and graphically depict the bedrock as it would appear without the cover.
To create a geologic map, one or more geologists start by assembling existing geologically related materials for the mapping area. These include aerial photographs, remote sensing data, measured stratigraphic sections, highway construction plans, shallow core and borehole records, geologic cross sections, water-well records, soil surveys, and published books, articles, and maps. The information from these sources is used to locate rock units and geologic features during fieldwork and to interpret data collected in the field.
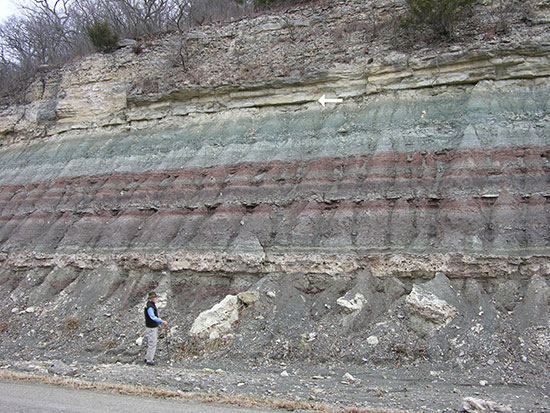
During fieldwork, geologists systematically drive and walk along roads, streams, and hillsides to examine surface materials and locate outcrops--the portions of rock units exposed at the Earth's surface. Outcrops can occur naturally, for example where rock has eroded along streams and cliffs, or they can be human-made, such as those in quarries and roadcuts. Geologists will examine each rock exposure in detail to identify the rock units and geologic contacts, which are the boundaries between the rock units based on the type and age of the rocks (fig. 6).
Figure 6--The geologic contact, or boundary (marked by arrow), between the Blue Springs Shale Member (below) and the more prominent Florence Limestone Member (above) in a Geary County roadcut.
Understanding the stratigraphy, or sequence of rock layers, is an important part of the mapping process. Rocks beneath the surface or visible in outcrops are layered in the order in which they were deposited, unless they were displaced by faulting, folding, or other processes. Bedrock type varies from one place to another, even in a small area, because geological processes (deposition, erosion, etc.) are rarely uniform across a mapping area.
To assure consistency from one county to the next, layers of bedrock are identified according to long-established boundaries and names (fig. 3). Unit boundaries usually represent a change from one predominant rock type to another, such as shale to limestone. In Kansas, the thickness of each unit ranges from a few feet to tens of feet. Geologists often record the locations of outcrops and other information gathered in the field electronically on tablet PCs with built-in GPS (Global Positioning System). They may also digitally photograph the geologic attributes of each outcrop and, if warranted, measure and describe the stratigraphic section, or sequence of rock units, visible at the surface. Outcrop locations are referred to as "control points" because their geologic attributes have been observed and verified.
Geologic maps are compilations of data and inference. Because control points may be a mile or more apart and the bedrock in between is hidden by soil and vegetation, geologists must connect the points and fill in the gaps between them by extrapolating and interpreting the geology. Besides outcrops, other clues are available. For example, certain plants or patterns of vegetation commonly overlie specific types of bedrock; soils contain materials weathered from underlying bedrock; and records for water wells and exploratory boreholes, when available, document near-surface rocks encountered during drilling.
In the field, and later when compiling data used to create a digital map, geologists can use GIS (geographic information systems) to combine data collected in the field with existing data available in other formats, including topographic maps, color aerial imagery, black and white aerial photography, soils maps, and LiDAR (Light Detection and Ranging) imagery. Overlaying the location of rock units identified in the field onto these other maps and images helps geologists visualize, analyze, and interpret the geology within the mapping area.
Geologists--working with a cartographer--use lines, colors, and symbols to distinguish the various rock units and resources of the surface and near-surface geology. The geology is superimposed on a topographic base. That is, the information that appears on existing topographic maps for the area being mapped, including streams, lakes, roads, towns, and contour lines indicating elevation, also appears on the geologic map. Hill shading, generated from LiDAR imagery, is added to give a three-dimensional effect.
The KGS mapping program produces geologic maps by county, but the geologists first plot their field data on more detailed U.S. Geological Survey 7.5-minute topographic maps (fig. 7). On these maps, 1 inch on the map equals about 2,000 feet (a little more than 1/3 mile) on the ground. Each county in Kansas, depending on size, is covered by 15 to 30 of the 7.5-minute maps. Data plotted by geologists on the detailed 7.5-minute maps are eventually combined to build the final product--a county geologic map typically published at a scale of 1:50,000 (1 inch equals about 4,166 feet, or about 4/5 mile). At this scale, county maps are the most convenient size for general-purpose use.
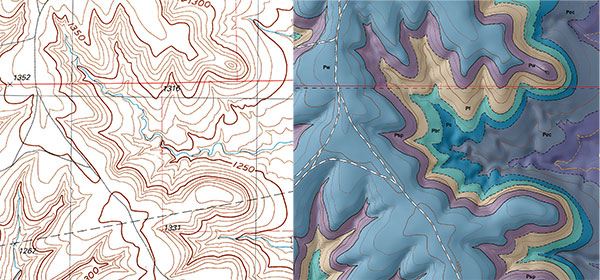
Figure 7--Portion of a topographic map compared to the geologic map of the same area. Same map as in fig. 1, shown here reduced 50%.
The Kansas Geological Survey is continuously evaluating the status of geologic maps in each Kansas county. Some counties have modern geologic maps, while others have older maps that need to be updated. Several counties in Kansas have recently been mapped for the first time. A map showing the status of geologic maps for each county can be found at http://www.kgs.ku.edu/General/Geology. Online versions of the county geologic maps also can be accessed there.
Geologic mapping currently being conducted by the KGS is part of the National Cooperative Geologic Mapping program administered by the U.S. Geological Survey and authorized by the National Geologic Mapping Act of 1992. The purpose of the act is to encourage geologic mapping and to produce detailed geologic maps of the entire United States. Federal funding for Kansas geologic mapping is matched with state funds.
Besides the county maps, the KGS also has available a wall-size geologic map of the entire state and a map of the Tallgrass Prairie National Preserve in Chase County (fig. 1).
Geologic maps for Kansas and other KGS publications are available from the Kansas Geological Survey. A publications catalog is available online. The KGS has sales offices in Lawrence and Wichita. Orders are accepted by phone or mail, or customers may visit either location:
KGS publications catalog: http://www.kgs.ku.edu/Datasale/catalog/index.html
GIS data can be downloaded from the Kansas Data Access and Support Center (DASC) website at no charge. DASC--located at the KGS in Lawrence and operating under the direction of the Kansas Geographic Information Systems (GIS) Policy Board and Kansas Geographic Information Officer (GIO)--serves as the geospatial data clearinghouse for the State of Kansas. To fully use the data, which are stored in a GIS file format, users need to have some GIS knowledge and a GIS software package.
DASC: http://www.kansasgis.org
Bedrock--General term for the solid rock either exposed at the surface or nearest the surface under a cover of vegetation, soil, or other thin layers of unconsolidated materials.
Borehole--A hole drilled in the earth for the purpose of collecting samples of subsurface geology.
Cartographers--Geographers, typically with background in GIS, who specialize in the design, compilation, and production of maps.
Core--A cylindrical sample of subsurface rock brought to the surface during drilling using a special core drill.
Geologic cross section--A diagram that illustrates a vertical section of the subsurface rock layers based on an interpretation of the available geologic data.
GIS (geographic information systems)--A combination of computer hardware, software, and data used to collect, interpret, manage, and display all types of geographic information.
LiDAR--A remote sensing technique that measures distance to an object or surface by transmitting laser pulses and measuring the reflected returns. A three-dimensional image of the earth's surface can be created with LiDAR from an aircraft.
Measured stratigraphic section--Recorded description of the rock units in an outcrop (portion of a unit exposed at the surface) usually depicted with a graphic column. Descriptions may include thickness, composition, fossil content, geologic structures such as faults, and other features of each rock unit.
Remote sensing--Acquiring photographic or other spectral information about objects or areas from above ground, typically from sensors mounted on aircraft or satellites.
Stratigraphy--1) The arrangement of rock strata, or layers, and 2) the study of rock strata to determine the age, distribution, properties, and fossil content of each rock unit and to classify, name, and establish the spatial relationship of strata and the sequence in which they occurred over time.
Topographic map--Map showing natural and human-made features, such as hills and roads, with contour lines (representing elevations) that illustrate the changes in height and slope of the Earth's surface, or relief, in the map area.
Unstratified--Not deposited in strata, or layers.
![]()
![]()
![]()
Kansas Geological Survey, Public Outreach
Comments to webadmin@kgs.ku.edu
Web version Dec. 4, 2015
http://www.kgs.ku.edu/Publications/PIC/pic38.html