![]()
![]()
![]()
Kansas Geological Survey, Public Information Circular (PIC) 35
A complete version of this PIC is available as a pdf document.
Anthony L. Layzell and Catherine S. Evans
Kansas Geological Survey
Environmentally and economically, drought is one of the most costly natural disasters in North America. Yet it rarely gets the same public attention that other, more spectacular, natural disasters receive. While tornadoes, floods, wildfires, and hurricanes leave behind well-defined swaths of devastation in relatively short order, droughts whittle away at water quality and quantity, topsoil, crop yields, and other natural and socioeconomic resources over months and years, even decades.
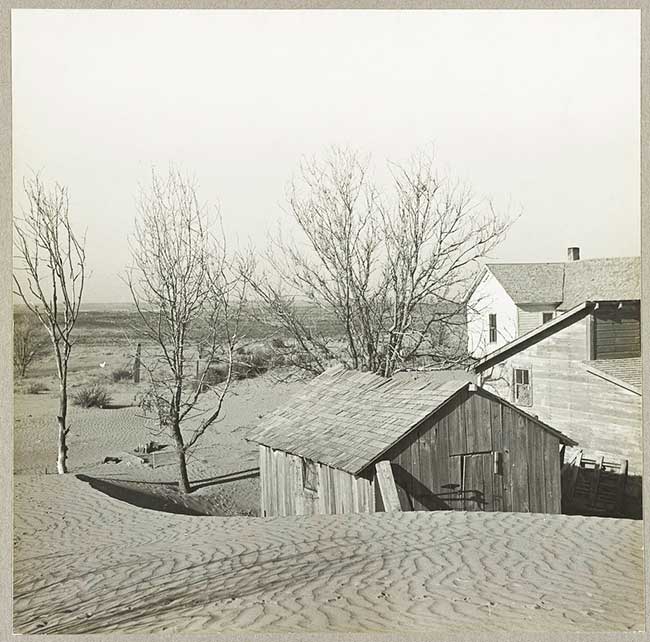
In any given year, drought conditions of some degree are occurring somewhere in North America. For 1988--midway through a three-year drought in the central and eastern United States--the estimate of national drought damage was a record $40 billion (National Climatic Data Center, 2012), or $78.5 billion in 2013 dollars. In 2011, losses in Kansas alone exceeded $1.7 billion (Kansas Department of Agriculture, 2011). The 1930s and 1950s droughts, however, remain the benchmarks for the 20th century in terms of duration, severity, and spatial extent. The historically unprecedented dust storms in the 1930s, exacerbated by the rapid spread of farming practices unsuitable for the semi-arid High Plains, helped make the Dust Bowl the most memorable drought in modern times (fig. 1). Two decades later, 1956 surpassed 1934 as the single most severe drought year ever documented statewide based on instrumental precipitation and temperature readings.
Figure 1--Drifts of wind-blown soil on a farm near Liberal, Kansas, March 1936 (photo by Arthur Rothstein: Library of Congress).
Yet the major 20th-century droughts, as impressive as they were, do not rank as the two most intense or enduring droughts to hit Kansas. For decades, scientists have been collecting and analyzing data to reconstruct paleoclimates--past climates dating back thousands of years--from clues in tree rings, sediments, and other proxies. Several past drought episodes, it turns out, have exceeded those of the 1930s and 1950s in severity, extent, and duration (Layzell, 2012). If such a drought occurred today, reductions in surface-water and groundwater resources would threaten municipal, industrial, and agricultural water supplies and cause widespread crop failure.
Being able to better forecast and plan for severe drought conditions is vital. Temperature and precipitation records are indispensable for understanding climate change but are largely restricted to the past 100 years. To assess the full range of drought variability that has occurred over 1,000 or more years, climatologists and other scientists measure the severity of pre-20th-century droughts using reconstructed paleoclimatic data from proxies and analyze the results in combination with more than a century of instrumental data.
Several indices have been developed to measure drought. The Palmer Drought Severity Index (PDSI), one of the most widely used indices in North America, was introduced in 1965 and is used to measure the severity of a drought occurrence for a specified period. PDSI values can be calculated from weather data collected using thermometers, rain gauges, and other instruments--available for most of North America since about 1895--or from paleoclimatic data reconstructed from tree rings and other proxy evidence.
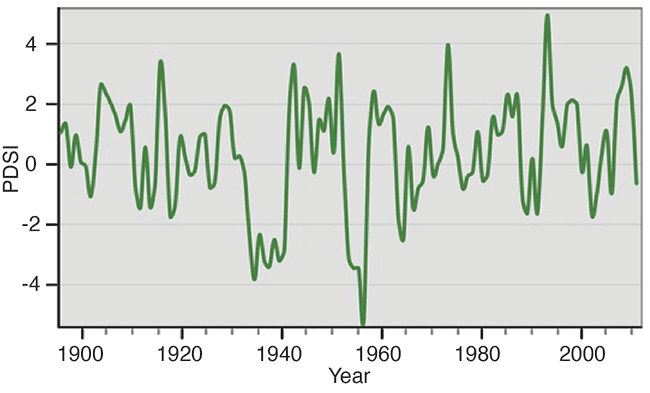
PDSI values, representing relative wetness and dryness, are assigned after recorded precipitation and temperature data or proxy data are analyzed to determine how much soil moisture was available at a specific time compared to how much would be available under average conditions. The values typically range from -4 (extremely dry) to 4 (extremely wet), although the range is unlimited. Although a PDSI value of -4 or less (even more extreme) is daunting, a persistent drought averaging moderate (-2) to severe (-3) PDSI values over many years may actually cause more damage than a more severe but shorter episode. Plotted PDSI values provide a picture of climate variability over time and can be used to calculate the duration of drought conditions. The extent of the 1930s and the 1950s droughts--and the relatively wet years in between--are evident in the PDSI trends for Kansas from 1895 to 2011 (fig. 2).
Figure 2--Palmer Drought Severity Index (PDSI) trends in Kansas, 1895-2011 (High Plains Aquifer Atlas, 2012).
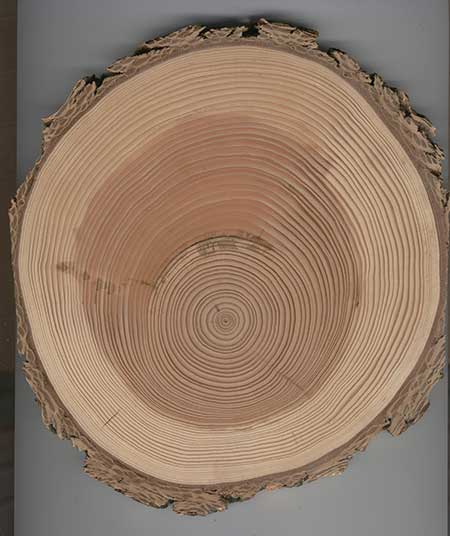
Data gleaned from various proxies provide insight into paleoclimates in North America dating back hundreds to thousands of years, depending on location. Annual growth rings in living trees and preserved wood are measured to reconstruct climatic patterns over extensive areas. Wide tree rings in highly drought-sensitive trees typically indicate a long growing season with adequate moisture, and very narrow rings usually signify drought conditions (fig. 3). The exact calendar year a tree ring was formed can be determined by crossdating, a technique that statistically matches the patterns in tree-ring characteristics among several living or dead trees in a region.
Figure 3--Cross section showing tree rings of a Douglas-fir (Pseudotsuga menziesii) from the Zuni Mountains, New Mexico (courtesy of Laboratory of Tree-Ring Research, University of Arizona: photo by R. K. Adams).
Data collected on crossdated trees in a given area form a tree-ring chronology, which can then be used to identify wide-ranging climatic trends. Synthesized data from hundreds of interlinking chronologies have been used to re-create annual climate patterns dating back at least a thousand years throughout most of North America. An extensive and ever-expanding network of annual tree-ring chronologies is accessible through the International Tree-Ring Data Bank (http://www.ncdc.noaa.gov/paleo/treering.html).
Reconstructed PDSI values based on tree-ring chronologies are available for as far back as 837 AD in western Kansas and the whole state by 1000 AD. In several studies of North American drought, up to 835 tree-ring chronologies were used to reconstruct annual growing-season PDSI values across the continent (Cook and Krusic, 2004; Cook et al., 2004; Stahle et al., 2007). Although trees, and thus tree-ring chronologies, are sparse in the Great Plains, investigators have been able to determine paleoclimatic patterns there using predictive models that rely partially on chronologies from surrounding regions. The integrity of this methodology has been verified by matching reconstructed 20th-century PDSI values for the Great Plains to PDSI values based on 20th-century Great Plains instrumental record (Cook and Krusic, 2004; Stahle et al., 2007).
A diverse variety of other proxies, derived from sand dunes, lake sediment, coral reefs, ice sheets, rock formations, microfossils, cave deposits, archaeological discoveries, and historical records, help verify past droughts identified in tree-ring studies. For example, evidence from once-active sand dunes in Kansas testifies to the periodic droughts that occurred in the state over several centuries (Arbogast, 1996), while far-off ice cores in Greenland and coral reefs in the South Pacific hold clues to worldwide paleoclimatic patterns (NOAA, 2010) that may have contributed to periods of aridity in the Great Plains.
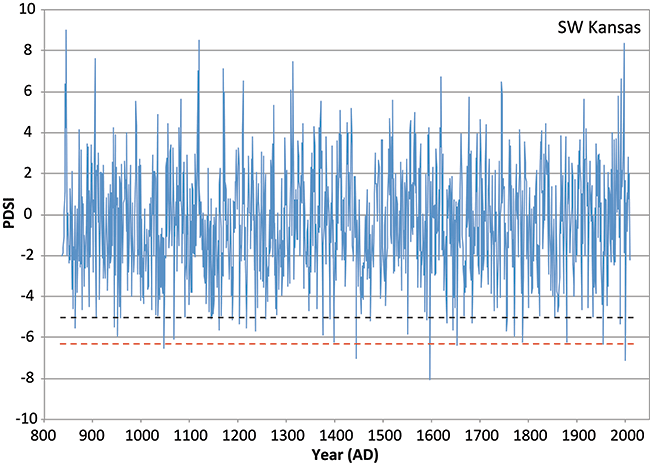
A key characteristic distinguishing the 1930s and 1950s droughts from other modern drought periods is aridity that was not only severe but also long lasting. The negative effects of one extremely dry year can be overcome relatively quickly when it is preceded or followed by a wetter year, but several years of nearly uninterrupted drought can lead to serious long-lasting socioeconomic and environmental problems. The PDSI value for 2002 in southwestern Kansas was -7.1, compared to -5.0 for the peak year of the Dust Bowl, yet the situation was not as dire in 2002 because it was bounded by years with positive PDSI values.
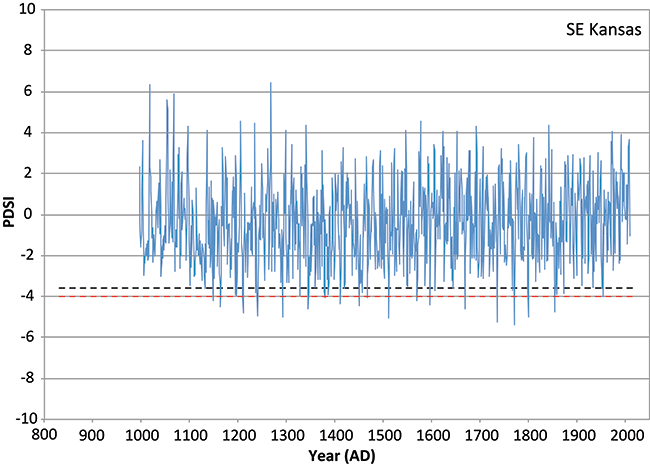
Year to year, climatic conditions vary across the state, with droughts hitting some regions harder than others. Since 1000 AD, southwestern Kansas has experienced a greater number of extreme droughts than southeastern Kansas (fig. 4). This west to east trend mirrors the strong longitudinal climate gradient in Kansas (High Plains Aquifer Atlas, 2012). Average precipitation today gradually increases from about 15 inches along the Colorado border to 45 inches in the southeastern corner of the state (High Plains Aquifer Atlas, 2012).
Figure 4--Annual PDSI reconstructions showing drought severity in southwestern Kansas and southeastern Kansas. Dashed lines indicate 1934 (black) and 1956 (red) PDSI values (Layzell, 2012). PDSI values are from Cook and Krusic, 2004. Reconstructions for all six Kansas regions are online at http://www.kgs.ku.edu/Hydro/Publications/2012/OFR12_18/index.html).
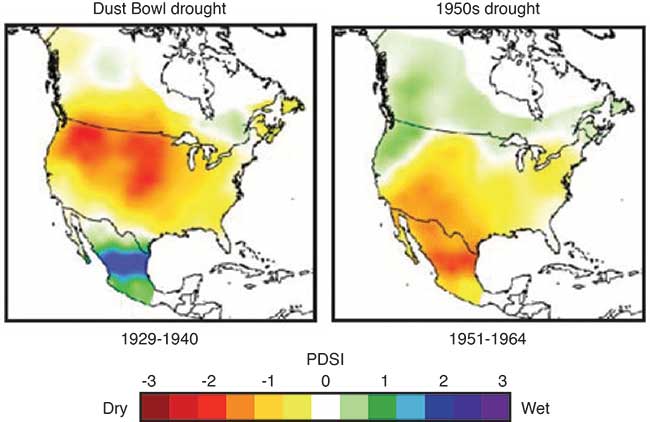
Just as drought severity varies from west to east, it also varies from north to south. Overall, PDSI data indicate that northern Kansas has on average experienced more severe droughts than southern Kansas in the past millennium, possibly because conditions that created droughts on the northern Great Plains occur more often. Several studies suggest that some droughts may be driven by changes in sea surface temperature (SST), particularly in the equatorial Pacific (Stahle et al., 2007). When the equatorial Pacific SST is cold, droughts are common in the southern plains as frontal weather systems are driven more northward. The 1950s drought fit that pattern. In contrast, the Dust Bowl, centered on the Pacific Northwest and northern Plains, was likely influenced by other conditions. These include warm Atlantic SST anomalies that prevented moisture from entering the Great Plains from the Gulf of Mexico (Schubert et al., 2004), and possibly a random atmospheric variation (Hoerling et al., 2009). The maps in fig. 5 illustrate the differences in spatial patterns between the two major 20th-century droughts.
Figure 5--Spatial patterns of the 1930s and 1950s droughts mapped from instrumental PDSI data (modified from Stahle et al., 2007).
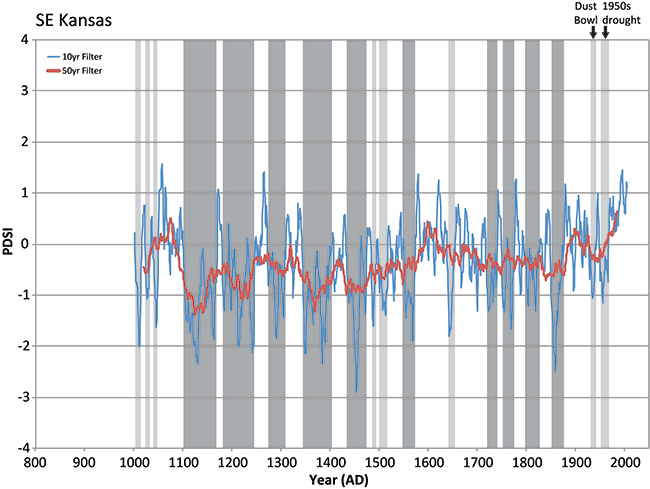
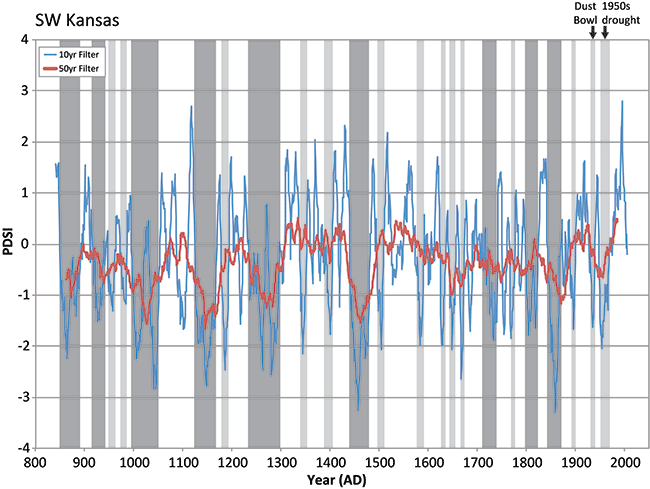
Calculating the duration of droughts can be difficult because multi-year dry intervals are often punctuated with occasional wet years. Furthermore, there is no single method for calculating duration. For this publication, the durations of the 1930s and 1950s drought episodes in Kansas were calculated by smoothing PDSI values--that is, filtering out the extreme high and low values by averaging over a 10- or 50-year period--to identify long-term patterns of drought duration. The beginning and end of each drought period are demarcated by periods of more than two consecutive years of positive PDSI values. In fig. 6, smoothed PDSI values were plotted to show the duration of droughts in southwestern and southeastern Kansas.
Droughts of unusually long duration are commonly referred to as "megadroughts," although there is no standard definition of the term (Stahle et al., 2007). This public information circular considers a megadrought to be any multi-year drought that significantly exceeds the duration of the most extreme droughts of the 20th century. Lasting 20 or more years, these extreme episodes do contain individual years of normal or even above-average precipitation.
Megadroughts appear to be most prevalent in Kansas between 850 AD and 1500 AD (fig. 7). The longest one occurred in north-central Kansas from 1317 to 1427. As north-central Kansas was enduring near-continuous drought for 110 years, northwestern Kansas experienced two long-term droughts separated by a wetter period and southwestern Kansas conditions did not reach megadrought proportions (see fig. 6). These differences underscore how much circumstances can vary over a short distance.
Figure 6--Smoothed PDSI reconstructions showing drought durations for southwestern Kansas (top) and southeastern Kansas (bottom). Light gray bars indicate episodes of similar duration to the 1930s and 1950s droughts and dark gray bars represent episodes of greater duration. Annual PDSI values have been smoothed to filter out anomalous high and low values over a 10-year range (blue) and a 50-year range (red) (Layzell, 2012). PDSI values are from Cook and Krusic, 2004. Reconstructions for all six Kansas regions are online at http://www.kgs.ku.edu/Hydro/Publications/2012/OFR12_18/index.html.
Many of the known megadroughts in North America occurred during the Medieval Warm Period (MWP), a time of significant climatic variability that lasted from about 900 to 1300. First identified in northern Europe, the MWP was later documented in other areas of the world, including parts of the western United States (Cook et al., 2004). A shift around 1500 to droughts of shorter duration may coincide with the onset of cooler climatic conditions during a period known as the Little Ice Age. Many dune records from the central Great Plains show significant sand dune activation--a sign of increased aridity and reduced vegetation--during these periods. A variety of sand-dune mobilizations have been documented from the 9th to the early 20th century in Kansas (fig. 7).
Figure 7--Synthesis of reconstructed PDSI data for the six regions of Kansas showing the severity and duration of droughts since about 850 AD. Events identified using geomorphic (sand dune), archaeological, and historical proxies are marked (Layzell, 2012). Sand-dune reactivation information from 1. Forman et al., 2008; 2. Lepper and Scott, 2005; 3. Hanson et al., 2010; 4. Arbogast, 1996; and 5. Halfen et al., 2012.
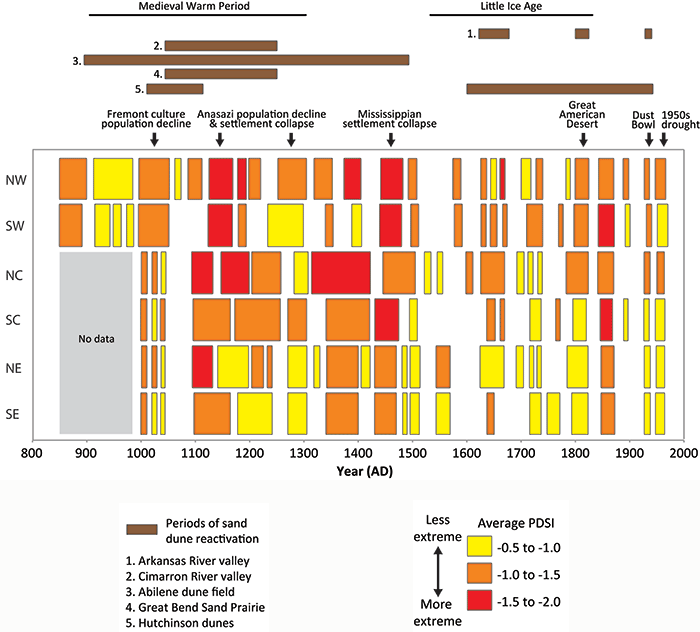
Evidence that megadroughts destabilized North American civilizations between 850 and 1500 AD is found in the archaeological record. Although drought probably affected populations in the Great Plains during that time, clues there are sparse. Archaeological evidence of agricultural societies in adjacent regions, however, provides signs of widespread drought conditions that most likely also afflicted the plains people.
Several major droughts may have undermined Native American cultures between the 11th and 15th centuries. The population of the Fremont cultures in the Four Corners region of the U.S. Southwest declined around 1000 AD in the midst of a multi-decade drought (fig. 7). The 13th-century drought commonly referred to as the "Great Drought" contributed to the abandonment of Anasazi agricultural settlements in the same region and also appears to have impaired Mississippian agricultural societies hundreds of miles to the northeast (Benson et al., 2007). Further megadroughts in the 14th and 15th centuries likely contributed to the abandonment of Cahokia near present-day St. Louis by 1450 (Cook et al., 2007).
Widespread drought during the Stephen Long expedition in 1819-1820 probably influenced the explorers' perception of the western Great Plains as the "Great American Desert." "The chief produce of these tracts of unmixed sand, is the sunflower, often the dense and almost exclusive occupant," wrote expedition member Edwin James. Jacob Fowler noted that on his way to Santa Fe in 1821, the sand hills along the Arkansas River in south-central Kansas were "distetute of vigetation as they are Bald" (Muhs and Holliday, 1995).
Set-tan (Little Bear) of the Kiowa recorded in his 60-year calendar history that during the hot "sitting summer" of 1855, the prairie grasses dried out and the Kiowa had to stop frequently to rest their emaciated horses (Stahle et al., 2007). Accounts from early settlers in eastern Kansas Territory also expounded on drought conditions that lasted from at least 1854 into the early 1860s, with only short reprieves. Newspapers reported suffocating dust storms, crop failures, prairie fires, "scorching, withering, blighting" winds, and the outward migrations of many newly arrived settlers (Malin, 1946). By the mid-1890s, locals around Garden City observed that area sand hills were becoming less extensive. Following brief reactivation of sand in small areas during the Dust Bowl years, dunes on the south side of the Arkansas River from just east of Pueblo, Colorado, to near Wichita are now mostly stabilized by vegetation (Muhs and Holliday, 1995).
Paleoclimatic data collected for western Kansas indicate a drought as severe as the Dust Bowl occurs there, on average, three to four times a century. Based on that probability, there is a 35% chance for a severe drought year in any decade, a 70% chance within a 20-year span, and a 100% chance over the estimated 40-year working lifetime of a western Kansas farmer. Eastern Kansas averages about one such drought a century. In terms of duration, western Kansas averages two droughts a century spanning one decade or more.
As groundwater usage in western Kansas escalated, starting in the 1950s, the semi-arid region became even more susceptible to the effects of sustained drought. The High Plains aquifer system, which consists largely of the Ogallala aquifer, is the primary source of municipal, industrial, and irrigation water in western and central Kansas. In drought years, greater than normal amounts of groundwater are withdrawn from the aquifer to compensate for the lack of precipitation, particularly during the growing season. From 1996 to 2012, the overall average water level in the Kansas portion of the High Plains aquifer dropped 14 feet. Southwestern Kansas on its own experienced an average decline of 32.5 feet during that time. Under drought conditions in 2011 and 2012, water levels in southwestern Kansas declined 3.56 feet and 4.26 feet, respectively (Kansas Geological Survey, 2013).
The KGS continuously monitors three wells in the High Plains aquifer--in Thomas, Scott, and Haskell counties--and is correlating groundwater-level data from those wells with values from the PDSI and other drought climatic indices. Based on those correlations, researchers are able to predict how water levels would likely respond to increased pumping for irrigation and other uses under drought conditions similar to or greater than those in the 1930s and 1950s (Butler et al., 2013). (Live water-level readings from the wells can be accessed at http://www.kgs.ku.edu/HighPlains/HPA_Atlas/Index%20Well%20Program/#.)
Eastern Kansas depends mainly on surface water from federal reservoirs, the source of municipal and industrial water for more than two-thirds of the state's population. Sedimentation has diminished storage in most of these lakes over time, and a sustained period of drought could lead to unprecedented water shortages (Kansas Water Office, 2008).
Water systems and management plans are commonly designed to handle the "drought of record," that is, the most severe hydrological event documented in the instrumental record. For the state of Kansas, the drought years from 1952 to 1957 remain the planning benchmark. Planning for a worst-case scenario of only a five-year duration, however, does not prepare the state for multi-decade megadroughts that modern-day agricultural and water systems--dependent on the state's limited groundwater and surface-water resources--may not have the resilience to withstand. Continued investigations into centuries of past climatic and drought variability will provide a clearer understanding of how climate and global warming affect aridity and will enable scientists and policymakers to better forecast droughts and plan for the sustainability of the state's groundwater and surface-water resources.
Little Ice Age--Not a true ice age, this cooling period is loosely defined as lasting from about the 16th to mid-19th century, although its start and end dates are not fully agreed upon and its duration varies from location to location.
Medieval Warm Period--A climatic period lasting from about 900 to 1300 AD when average temperatures in Europe and adjacent regions of the North Atlantic are thought to have been equal to or greater than today's.
Paleoclimates--Climates that occurred before instrumental weather measurements were available and whose occurrence and patterns have been identified with evidence from tree rings, ice cores, and other proxies.
Proxy--Natural and human-made resources--such as tree rings, sedimentary deposits, archaeological artifacts, and historical journals--that have properties that date them to a specific time. Proxies can be used to determine climatic events that occurred before instrumental, direct-measurement records were kept.
Arbogast, A. F., 1996, Stratigraphic evidence for late-Holocene aeolian sand mobilization and soil formation in south-central Kansas, USA: Journal of Arid Environments, v. 34, p. 403-414.
Benson, L. V., Berry, M. S., Jolie, E. A., Spangler, J. D., Stahle, D. W., and Hattori, E. M., 2007, Possible impacts of early-11th-, middle-12th-, and late-13th-century droughts on western native Americans and the Mississippian Cahokians: Quaternary Science Reviews, v. 26, p. 336-350.
Butler, J. J., Jr., Whittemore, D. O., Bohling, G. C., Reboulet, E., Stotler, R., and Wilson, B. B., 2013, High Plains aquifer index well program--2012 annual report: Kansas Geological Survey, Open-File Report 2013-1, 127 p., http://www.kgs.ku.edu/Hydro/Publications/2013/OFR13_1/index.html.
Cook, E.R., and Krusic, P.J., 2004, North American Drought Atlas: Lamont-Doherty Earth Observatory and the National Science Foundation, http://iridl.ldeo.columbia.edu/SOURCES/.LDEO/.TRL/.NADA2004/.pdsi-atlas.html.
Cook, E. R., Woodhouse, C., Eakin, C. M., Meko, D. M., and Stahle, D. W., 2004, Long-term aridity changes in the western United States: Science, v. 306, p. 1,015-1,018.
Cook, E. R., Seager, R., Cane, M. A., and Stahle, D. W., 2007, North American drought: reconstructions, causes and consequences: Earth Science Reviews, v. 81, p. 93-134.
Forman, S. L., Marin, L., Gomez, J., and Pierson, J., 2008, Late Quaternary eolian sand depositional record for southwestern Kansas: Landscape sensitivity to droughts: Paleogeography, Paleoclimatology, Paleoecology, v. 265, p. 107-120.
Halfen, A. F., Johnson, W. C., Hanson, P. R., Woodburn, T. L., Young, A. R., and Ludvigson, G. A., 2012, Activation history of the Hutchinson dunes in east-central Kansas, USA, during the past 2200 years: Aeolian Research, v. 5, p. 9-20.
Hanson, P. R., Arbogast, A. F., Johnson, W. C., Joeckel, R. M., and Young, A. R., 2010, Megadroughts and late Holocene dune activation at the eastern margin of the Great Plains, north-central Kansas, USA: Aeolian Research, v. 1, p. 101-110.
High Plains Aquifer Atlas, 2012, Kansas Geological Survey: http://www.kgs.ku.edu/HighPlains/HPA_Atlas/index.html.
Hoerling, M., Quan, X., and Eischeid, J., 2009, Distinct causes for two principal U.S. droughts of the 20th century: Geophysical Research Letters, v. 36, L19708, doi:10.1029/2009GL039860.
Kansas Department of Agriculture, 2011, Kansas drought continues, production losses reach $1.7 billion: http://www.ksda.gov/news/id/405.
Kansas Geological Survey, 2013, Groundwater levels decline in western and central Kansas: http://www.kgs.ku.edu/General/News/2013/2013groundwaterlevels.html.
Kansas Water Office, 2008, Sedimentation in our reservoirs--Causes and solutions: Kansas Water Office, 143 p., http://www.kwo.org/reports_publications/reports/kwri_book.pdf.
Layzell, A. L., 2012, A thousand years of drought and climatic variability in Kansas--Implications for water resources management: Kansas Geological Survey, Open-File Report 2012-18, 23 p., http://www.kgs.ku.edu/Hydro/Publications/2012/OFR12_18/index.html.
Lepper, K., and Scott, G. F., 2005, Late Holocene eolian activity in the Cimarron River valley of west-central Oklahoma: Geomorphology, v. 70, p. 42-52.
Malin, J. C., 1946, Dust storms--Part one, 1850-1860: Kansas Historical Quarterly, v. 14, no. 2, p. 129-133.
Muhs, D. R., and Holliday, V. T., 1995, Evidence of active dune sand on the Great Plains in the 19th century from accounts of early explorers: Quaternary Research, v. 43, p. 198-208.
National Climatic Data Center, 2012, Billion-dollar U.S. weather/climate disasters 1980-2012: National Oceanic and Atmospheric Administration, http://www.ncdc.noaa.gov/billions.
NOAA, 2010, Paleoclimatology: http://www.ncdc.noaa.gov/paleo.
Schubert, S. D., Suarez, M. J., Region, P. J., Koster, R. D., and Bacmeister, J. T., 2004, On the cause of the 1930s Dust Bowl: Science, v. 303, p. 1,855-1,859.
Stahle, D. W., Fye, F. K., Cook, E. R., and Griffin, R. D., 2007, Tree-ring reconstructed megadroughts over North America since A.D. 1300: Climatic Change, v. 83, p. 133-149.
![]()
![]()
![]()
Kansas Geological Survey, Public Outreach
Comments to webadmin@kgs.ku.edu
Web version Oct. 4, 2013, revised May 21, 2014
http://www.kgs.ku.edu/Publications/PIC/pic35.html