Kansas Geological Survey, Open-file Report 2003-56
by
Galen A. Worthington
Submitted May 20, 2003
KGS Open File Report 2003-56
This report summarizes differences in retention times for the eight compounds tested in the HPLC laboratory during the 2002-2003 academic year at Kansas University. The compounds names, followed by the abbreviation used in the HPLC lab, are listed in Table 1.
Table 1. Compound List
| 1. 4-chloronitrobenzene | (4CLNB)+ |
| 2. 4-chloroananiline | (4CLAN) |
| 3. 3-chloronitrobenzene | (3CLNB) |
| 4. 3-chloroananiline | (3CLAN) |
| 5. 4-nitrotoluene | (4MENB) |
| 6. p-toluldine | (4MEAN)+ |
| 7. 4-nitroacetophenone | (4ACNB) |
| 8. 4-aminoacetophenone | (4ACAN)+ |
| + need ternary diagram for Appendix II | |
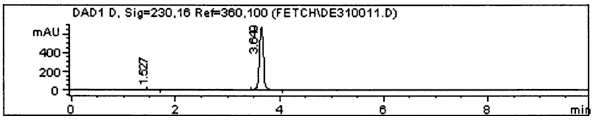
Retention time is the apex of the peak of a compound coming off the HPLC column, and is measured in minutes along the X-axis. The height of the peak is measured in absorbance units (mAU) on the chromatogram, and represents the Y-axis. Peak width, also measured in minutes along the X-axis on the chromatogram (or expressed in seconds in some tables in this report), is a measure of when the peak begins (leaves the baseline), reaches the peak height, and returns to the baseline. We will also refer to this chromatograph line as the curve of the compound. See Figure 1 for an illustration. When we use more than one compound in a solution, we will get more than one peak, or retention time, on the chromatograph. We want to have clear separation between peaks, with no overlapping areas under the curves of the peaks. Overlapping curves may give us misleading or convoluted area-under-the-curve data. Certainly, the computer will have to make decisions/calculations about what the true or exact area is under a particular curve, and we would rather this process be as straight forward as possible.
Figure 1. Example of a peak on a chromatogram. Retention time is 3.649 minutes. Peak width is about 20 seconds. Peak height is 520 mAU.
The liquid mobile phase used in the HPLC is composed of a solution of water (H2O), acetonitrile (ACN), and methanol (CH2OH). An elluent composition is a particular composition of these three liquids. For example, elluent composition E is composed of 20% water, 10% ACN, and 70% methanol. In shorthand, elluent composition E is [201070]. A list of the fourteen major elluent compositions used in the HPLC laboratory is in Table 14 in Appendix 1, and has been labled A through N. Each of the compounds in Table 1 has been run through the HPLC with a set of (usually 12-14) elluent compositions.
Figure 2. Ternary diagram for 4ACNB listing the retention times of fourteen elluent compositions.
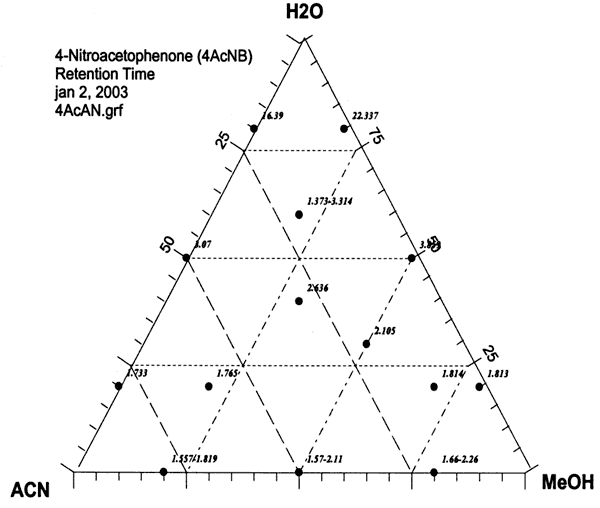
The retention times for a set of elluent compositions has been arranged in a ternary diagram. See Figure 2 for an illustration, and see Figure I-2 for how the elluent compositions A-N are arranged on the ternary diagram. The retention times ternary diagram for each compound can be found in Appendix II.
Table 2 lists elluent composition(s) that should create the best separation times for various combinations of the compounds in Table 1. The first, second, or third listings in Table 2 reflect best, second best, and third best separation times, respectively. The selection of these elluent compositions is based on two criteria. The first is to give a clear, clean separation of peaks between compounds. The second is to make the total run in the shortest amount of time possible.
Table 2. Suggested Elluent Compositions for Various Compound Combinations
| Compound pairs | 4CLNB 4CLAN | 3CLNB 3CLAN | 4MENB 4MEAN | 4ACNB 4ACAN |
|---|---|---|---|---|
| 4CLNB 4CLAN | COMBO-1 1.E [201070] 2.J [403030] 3.L [602020] | xxxxxx xxxxxx | xxxxxx xxxxxx | xxxxxx xxxxxx |
| 3CLNB 3CLAN | COMBO-2 1.K [500050] 2.J, maybe 3.L, maybe | COMBO-5 1.F [302050] 2.J [403030] 3.G [206020] | xxxxxx xxxxxx | xxxxxx xxxxxx |
| 4MENB 4MEAN | COMBO-3 1.K [500050] 2.L [602020] | COMBO-6 1.K [500050] 2.L, maybe | COMBO-8 1.F [302050] 2.J [403030] 3.D [200080] | xxxxxx xxxxxx |
| 4ACNB 4ACAN | COMBO-4 1.K [500050] 2. NONE | COMBO-7 1.K, maybe 2. NONE | COMBO-9 1.K (possibly) 2. NONE | COMBO-10 1.F [302050] 2.J [403030] 3.K [500050] |
For example, in comparing the first two compounds in Table 4: Combo-1 to each other, the 4CLAN will come off first, and the 4CLNB will come off about 31 seconds later for elluent composition D, 32 seconds later for elluent composition E, and 35 seconds later for elluent composition F, respectively. In this example, the resulting separations are actually very similar to each other. From Table 3, we can see the peak widths for these three elluent compositions for these particular compounds range from 15 to 40 seconds. Of the three elluent compositions, E is the only one where the peak widths of these two compounds is short enough (15-25 seconds) to allow clear separation of their respective retention times (31.5 seconds in this case).
The second condition is meet by the total time taken for the compounds to run. In Combo-1 again, Elluent composition E will be finished in less than 2.3 minutes, Elluent composition D in 2.5, and Elluent composition F in just under 3 minutes. Elluent composition E represents the shortest time for the total run, if it were the only one being run on the HPLC.
In many of the compound combinations, there are only one or possibly two elluent compositions that may give adequate separation times between peaks, most notable Elluent composition K, which is half water and half methanol. In Table 2, you will note that Combo-7 says "K-maybe." This is because while most of the four compounds are sufficiently separated, two of the compounds (4ACNB and 3CLAN) only have a separation time of about 33 seconds, and the peak widths for those two compounds may be as little as 20 seconds or as much as 30 seconds, which may not allow sufficient time for a clear separation. At best, 4ACNB will just be finishing when 3CLAN is starting. All other elluent compositions will not allow for an adequate curve separation.
What constitutes a good separation time (the retention time) between peaks? What is the time it takes for a peak to start and end (the peak width)? When a compound is coming off we want the line to return to baseline before the peak of the next compound begins. These are important considerations. If it takes a full minute for a separation curve to go from start to finish, and the peaks are less than a minute apart, we could get overlapping curves. Table 3 shows what we think are representative peak width times for the various compounds, all gleaned from the data by visual inspection, and usually rounded up to the next five seconds to give a conservative measure. The elluent compositions at ternary points D, E, F, G, J, K and L were included in the study. Elluent compositions A, B, and C were excluded because these elluent compositions contained 0% water, and the solubilities were highly variable and the resulting peaks were not always well defined.
Table 3. Peak Width times for selected runs
| Elluent composition | Compound Time (in seconds) | Average Time (sec) | Range Time (sec) |
|||
|---|---|---|---|---|---|---|
| 4CLNB | 4CLAN | 3CLNB | 3CLAN | |||
| D [200080] | No data | 40 | No data | 20 | 30 | 20-40 |
| E [201070] | 15 | 25 | 20 | 10 | 22 | 10-25 |
| F [302050] | 25 | 40 | 20 | 15 | 25 | 15-40 |
| G [206020] | 25 | 30 | 15 | 25 | 23 | 15-30 |
| J [403030] | 30 | 25 | 15 | 10 | 17 | 10-25 |
| K [500050] | 50 | Unclear | 60 | 30 | 47 | 30-60 |
| L [602020] | 60 | 15 | 90 | Unclear | 53 | 15-90 |
| Elluent composition | Compound Time (in seconds) | Average Time (sec) | Range Time (sec) |
|||
|---|---|---|---|---|---|---|
| 4MENB | 4MEAN | 4ACNB | 4ACAN | |||
| D [200080] | 15 | 40# | 15 | 40# | 28 | 15-40 |
| E [201070] | 25 | 40# | 15 | 40# | 30 | 15-40 |
| F [302050] | 25 | 20 | 20 | 20 | 21 | 20-25 |
| G [206020] | 15 | 25 | 25 | 40# | 26 | 15-40 |
| J [403030] | Unclear | 25 | 20 | 20 | 22 | 20-25 |
| K [500050] | 5 | 30 | 20,25 | 25 | 29 | 20-45 |
| L [602020] | o data | 30 | Unclear | 25 | 28 | 25-30 |
| # -- About 20 seconds of wildly fluctuating curve above/below baseline before creating a reasonably clear peak that lasts about 20 more seconds. See file DE17-02/DE170004.D for an example. This may represent an elluent signal that was not settled before the aniline arrived at the detector. | ||||||
| "No Data" indicates the elluent composition was not run or was not found in the computer files. | ||||||
| "Unclear" indicates there was no clear beginning, peak, or end time to the curve. | ||||||
The data in Combo-1, 5, 8, and 10 reflects two compounds in solution, and the separation in minutes or seconds of their peak heights from each other.
Table 4. Combo-1
| Elluent composition | Retention Time (minutes) | Time between peaks (seconds) | Peak Width (seconds) | ||
|---|---|---|---|---|---|
| 4CLNB | 4CLAN | 4CLNB | 4CLAN | ||
| D [200080] | 2.232 | 1.714 | 31.1 | No data | 40 |
| E [201070] | 2.219 | 1.694 | 31.5 | 15 | 25 |
| F [302050] | 2.927 | 2.354 | 34.4 | 25 | 40 |
| G [206020] | 2.14 | 2.090 | 3.00 | 25 | 30 |
| J [403030] | 4.352 | 2.928 | 85.44 | 30 | 25 |
| Ka [500050] | 8.853 | 2.54 | 378.8 | 50 | Unclear |
| Kb [500050] | 8.853 | 5.329 | 211.4 | 50 | Unclear |
| L [602020] | 14.322 | 6.5 | 469.3 | 60 | 15 |
Table 5. Combo-5
| Elluent composition | Retention Time (minutes) | Time between peaks (seconds) | Peak Width (seconds) | ||
|---|---|---|---|---|---|
| 3CLNB | 3CLAN | 3CLNB | 3CLAN | ||
| D | 2.125 | 1.839 | 17.2 | No data | No data |
| E | 2.353 | 2.168 | 11.1 | 20 | 20 |
| F | 3.16 | 2.168 | 59.5 | 20 | 20 |
| G | 2.203 | 1.775 | 25.7 | 15 | 15 |
| Ja | 4.043 | 2.761 | 76.9 | 15 | 15 |
| Jb | 4.043 | 5.045 | 60.1 | 15 | 15 |
| K | 10.371 | 4.497 | 352.4 | 60 | 60 |
| L | 15.815 | No data | Unknown | 90 | 90 |
Table 6. Combo-8
| Elluent composition | Retention Time (minutes) | Time between peaks (seconds) | Peak Width (seconds) | ||
|---|---|---|---|---|---|
| 4MENB | 4MEAN | 4MENB | 4MEAN | ||
| D | 2.134 | 1.827 | 18.4 | 15 | 40# |
| E | 2.132 | 1.946 | 11.2 | 25 | 40# |
| F | 2.787 | 2.103 | 41.0 | 25 | 20 |
| G | 2.091 | 1.812 | 16.7 | 15 | 25 |
| H | 2.035 | 1.811 | 13.4 | 15 | 50# |
| J | 4.027 | 2.51 | 91.0 | Unclear | 25 |
Table 7. Combo-10
| Elluent composition | Retention Time (minutes) | Time between peaks (seconds) | Peak Width (seconds) | ||
|---|---|---|---|---|---|
| 4ACNB | 4ACAN | 4ACNB | 4ACAN | ||
| D | 1.813 | 1.509 | 18.2 | 15 | 40# |
| E | 1.814 | 1.493 | 19.3 | 15 | 40# |
| F | 2.105 | 1.638 | 28.0 | 20 | 20 |
| G | 1.765 | 1.54 | 13.5 | 25 | 40# |
| J | 2.638 | 1.79 | 50.9 | 20 | 20 |
| K | 3.859 | 2.014 | 110.7 | 25 | 25 |
| L | Unclear | 2.351 | Unclear | Unclear | 25 |
The data in Combo-2, 3, 4, 6, 7 and 9 reflects not two but four compounds in solution and each column represents peak height times for the designated compound. Where a elluent composition a and b are indicated, there were two peaks associated with that compound. "Unc" means unclear, and "Unk" means unknown.
Table 8. Combo-2 (No Data = ND)
| Elluent composition |
4CLNB | 4CLAN | 3CLNB | 3CLAN | ||||
|---|---|---|---|---|---|---|---|---|
| Retention Time | Peak Width |
Retention Time | Peak Width |
Retention Time | Peak Width |
Retention Time | Peak Width |
|
| D | 2.232 | ND | 1.714 | 40 | 2.125 | ND | 1.839 | 20 |
| E | 2.219 | 15 | 1.694 | 25 | 2.353 | 20 | 2.168 | 10 |
| F | 2.927 | 25 | Fa - 1.868 | 40 | 3.16 | 20 | 2.168 | 15 |
| Fb - 2.354 | 40 | 20 | ||||||
| G | 2.14 | 25 | Ga - 1.616 | 30 | 2.203 | 15 | 1.775 | 25 |
| Gb - 2.090 | 30 | 15 | ||||||
| J | 4.352 | 30 | Ja - 2.111 | 25 | 4.043 | 15 | Ja-2.761 | 10 |
| Jb - 2.928 | 25 | 15 | Jb-5.045 | 10 | ||||
| K | 8.853 | 50 | Ka - 2.54 | unc | 10.371 | 60 | 4.407 | 30 |
| Kb - 5.329 | unc | 60 | 30 | |||||
| L | 14.322 | 60 | La - 3.161 | 15 | 15.815 | 90 | No Data | Unk |
| Lb - 6.5 | 15 | 90 | Unk | |||||
Table 9. Combo-3 (No Data = ND)
| Elluent composition |
4CLNB | 4CLAN | 4MENB | 4MEAN | ||||
|---|---|---|---|---|---|---|---|---|
| Retention Time | Peak Width |
Retention Time | Peak Width |
Retention Time | Peak Width |
Retention Time | Peak Width |
|
| D | 2.232 | ND | 1.714 | 40 | 2.134 | 15 | 1.827 | 40# |
| E | 2.219 | 15 | 1.694 | 25 | 2.132 | 25 | 1.946 | 40# |
| F | 2.927 | 25 | Fa - 1.868 | 40 | 2.787 | 25 | 2.103 | 20 |
| Fb - 2.354 | 40 | |||||||
| G | 2.14 | 25 | Ga - 1.616 | 30 | 2.091 | 15 | 1.812 | 25 |
| Gb - 2.090 | 30 | |||||||
| J | 4.352 | 30 | Ja - 2.111 | 25 | 4.027 | Unclear | 2.51 | 25 |
| Jb - 2.928 | 25 | |||||||
| K | 8.853 | 50 | Ka - 2.54 | unc | 7.831 | 45 | 3.558 | 30 |
| Kb - 5.329 | unc | |||||||
| L | 14.322 | 60 | La - 3.161 | 15 | 13.2 | ND | 4.009 | 30 |
| Lb - 6.5 | 15 | |||||||
Table 10. Combo-4 (No Data = ND)
| Elluent composition |
4CLNB | 4CLAN | 4ACNB | 4ACAN | ||||
|---|---|---|---|---|---|---|---|---|
| Retention Time | Peak Width |
Retention Time | Peak Width |
Retention Time | Peak Width |
Retention Time | Peak Width |
|
| D | 2.232 | ND | 1.714 | 40 | 1.813 | 15 | 1.509 | 40# |
| E | 2.219 | 15 | 1.694 | 25 | 1.814 | 15 | 1.493 | 40# |
| F | 2.927 | 25 | Fa 1.868 | 40 | 2.105 | 20 | 1.638 | 20 |
| Fb 2.354 | 40 | |||||||
| G | 2.14 | 25 | Ga 1.616 | 30 | 1.765 | 25 | 1.54 | 40# |
| Gb 2.090 | 30 | |||||||
| J | 4.352 | 30 | Ja 2.111 | 25 | 2.636 | 20 | 1.79 | 20 |
| Jb 2.92 8 | 25 | |||||||
| K | 8.853 | 50 | Ka 2.54 | unc | 3.859 | 25 | 2.014 | 25 |
| Kb 5.329 | unc | |||||||
| L | 14.322 | 60 | La 3.161 | 15 | 1.373-3.314* | Unclear | 2.351 | 25 |
| Lb - 6.5 | 15 | |||||||
| * represents a range of time, no clear peak | ||||||||
Table 11. Combo-6 (No Data = ND)
| Elluent composition |
4MENB | 4MEAN | 3CLNB | 3CLAN | ||||
|---|---|---|---|---|---|---|---|---|
| Retention Time | Peak Width |
Retention Time | Peak Width |
Retention Time | Peak Width |
Retention Time | Peak Width |
|
| D | 2.134 | 15 | 1.827 | 40# | 2.125 | ND | 1.839 | 20 |
| E | 2.132 | 25 | 1.946 | 40# | 2.353 | 20 | 2.168 | 10 |
| F | 2.787 | 25 | 2.103 | 20 | 3.16 | 20 | 2.168 | 15 |
| G | 2.091 | 15 | 1.812 | 25 | 2.203 | 15 | 1.775 | 25 |
| J | 4.027 | Unc | 2.51 | 25 | 4.043 | 15 | Ja 2.761 | 10 |
| Jb 5.045 | 10 | |||||||
| K | 7.831 | ND | 3.558 | 30 | 10.371 | 90 | 4.407 | 30 |
| L | 13.2 | 45 | 4.009 | 30 | 15.815 | 60 | ND | Unk |
Table 12. Combo-7 (No Data = ND)
| Elluent composition |
4ACNB | 4ACAN | 3CLNB | 3CLAN | ||||
|---|---|---|---|---|---|---|---|---|
| Retention Time | Peak Width |
Retention Time | Peak Width |
Retention Time | Peak Width |
Retention Time | Peak Width |
|
| D | 1.813 | 15 | 1.509 | 40# | 2.125 | No data | 1.839 | ND |
| E | 1.814 | 15 | 1.493 | 40# | 2.353 | 20 | 2.168 | 20 |
| F | 2.105 | 20 | 1.638 | 20 | 3.16 | 20 | 2.168 | 20 |
| G | 1.765 | 25 | 1.54 | 404 | 2.203 | 15 | 1.775 | 1 |
| J | 2.636 | 20 | 1.79 | 20 | 4.043 | 15 | Ja 2.761 | 15 |
| 15 | Jb 5.045 | 15 | ||||||
| K | 3.859 | 25 | 2.014 | 25 | 15.815 | 60 | 4.407 | 60 |
| L | 1.373-3.314* | Unclear | 2.351 | 25 | 10.371 | 90 | No Data | 90 |
Table 13. Combo-9 (No Data = ND)
| Elluent composition |
4ACNB | 4ACAN | 4MENB | 4MEAN | ||||
|---|---|---|---|---|---|---|---|---|
| Retention Time | Peak Width |
Retention Time | Peak Width |
Retention Time | Peak Width |
Retention Time | Peak Width |
|
| D | 1.813 | 15 | 1.509 | 40# | 2.134 | 15 | 1.827 | 40# |
| E | 1.814 | 15 | 1.493 | 40# | 2.132 | 25 | 1.946 | 40# |
| F | 2.105 | 20 | 1.638 | 20 | 2.787 | 25 | 2.103 | 20 |
| G | 1.765 | 25 | 1.54 | 40# | 2.091 | 15 | 1.812 | 25 |
| 1 | 2.636 | 20 | 1.79 | 20 | 4.027 | Unclear | 2.51 | 25 |
| K | 3.859 | 25 | 2.014 | 25 | 7.831 | 45 | 3.558 | 30 |
| L | 1.373-3.314* | Unclear | 2.351 | 25 | 13.2 | ND | 4.009 | 30 |
Table 14. Elluent compositions Used in the HPLC Laboratory
| Elluent composition | Water (H2O) % | ACN % | Methanol (CH2OH) % | Abbreviation |
|---|---|---|---|---|
| A | 00 | 80 | 20 | [008020] |
| B | 00 | 50 | 50 | [005050] |
| C | 00 | 20 | 80 | [002080] |
| D | 20 | 00 | 80 | [200080] |
| E | 20 | 10 | 70 | [201070] |
| F | 30 | 20 | 50 | [302050] |
| G | 20 | 60 | 20 | [206020] |
| H | 20 | 80 | 00 | [208000] |
| I | 50 | 50 | 00 | [505000] |
| J | 40 | 30 | 30 | [403030] |
| K | 50 | 00 | 50 | [500050] |
| L | 60 | 20 | 20 | [602020] |
| M | 80 | 00 | 20 | [800020] |
| N | 80 | 20 | 00 | [802000] |
Figure I-1. Ternary diagram showing the locations of elluent compositions A through N.
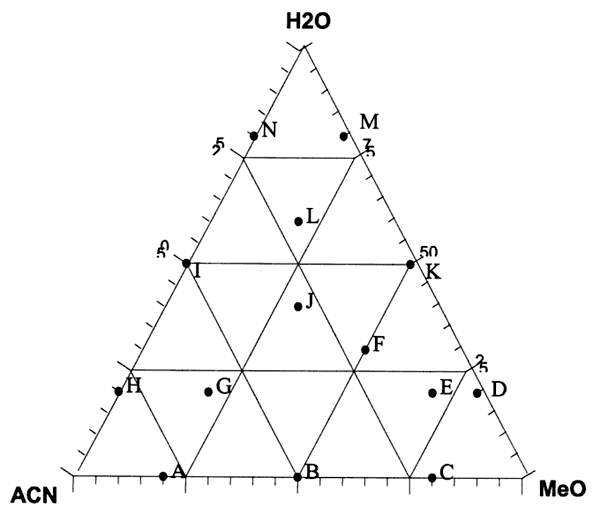
Figure II-1. 4CLNB.
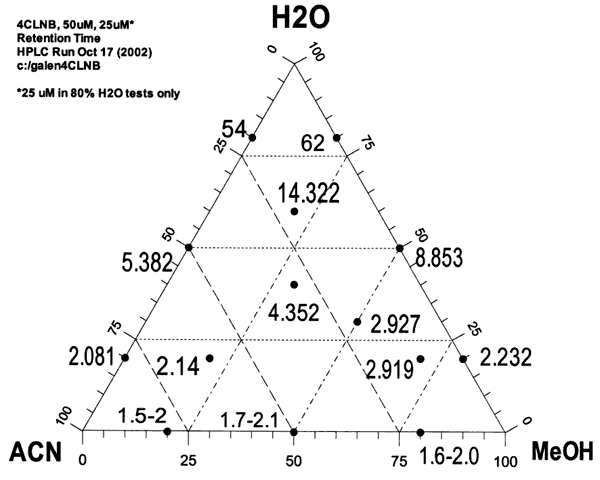
Figure II-2. 4CLAN.
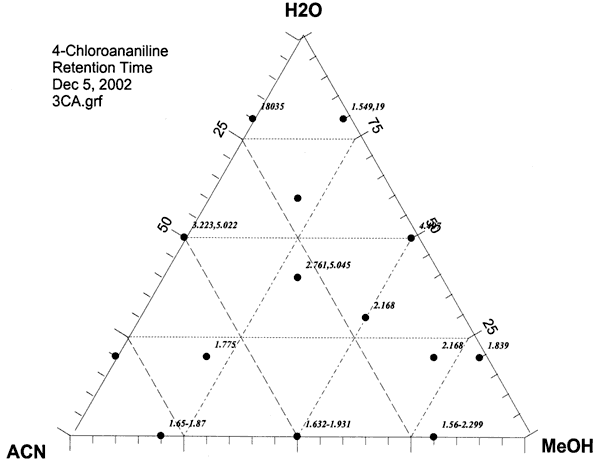
Figure II-3. 3CLNB.
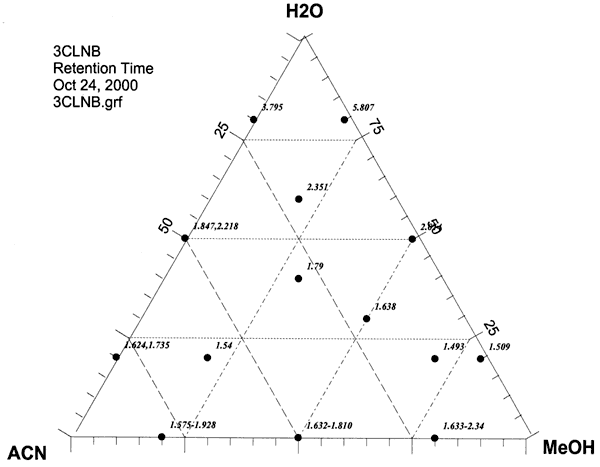
Figure II-4. 3CLAN.

Figure II-5. 4MENB.

Figure II-6. 4MEAN.
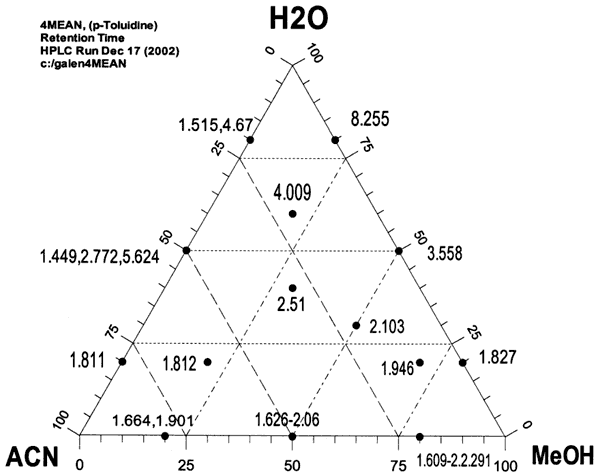
Figure II-7. 4ACNB.
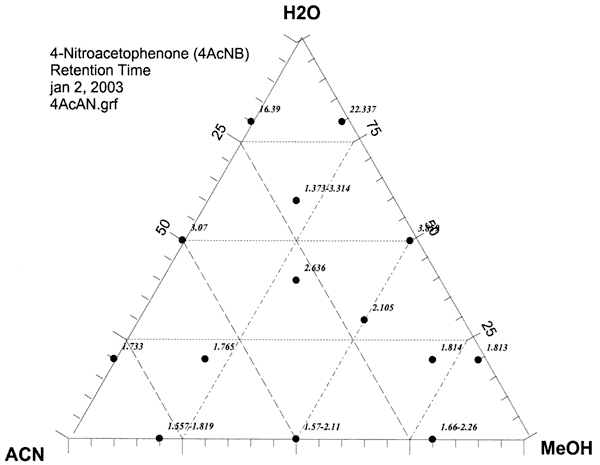
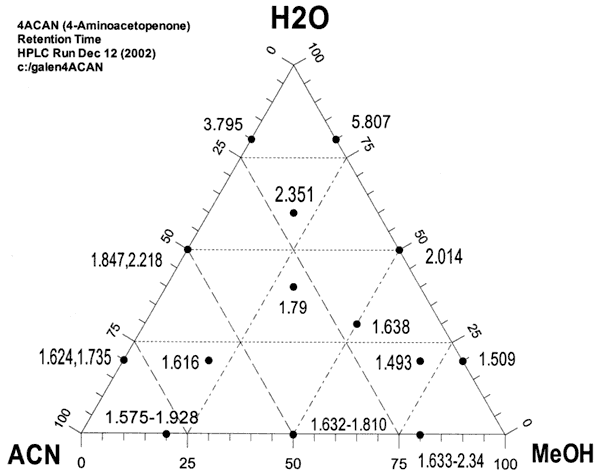
Figure II-8. 4ACAN.
Kansas Geological Survey, Geology
Placed online Oct. 11, 2006
Comments to webadmin@kgs.ku.edu
URL http://www.kgs.ku.edu/Publications/OFR/2003/OFR03_56/index.html