Kansas Geological Survey, Open-file Report 2000-65
Previous page--Methods ||
Next page--Conclusions, References
Under this contract, the mapping of alluvial fill was expanded in aerial extent and refined for those areas mapped previously. Alluvial landforms of drainages located along the southern and northeastern periphery of the central firing range have been mapped and in most instances radiocarbon dated. Alluvial surfaces of Breakneck, Pumphouse, Onemile, Forsyth, and Wildcat creeks have been mapped. Further, radiocarbon age control has been obtained on Pumphouse, Forsyth, lower Threemile and Sevenmile (south of the firing range), and Wildcat creeks, as well as on the Kansas and Republican rivers along the southern boundary of the base (Table 1).
Table 1. Valley (Alluvial) Radiocarbon Ages
| Site Name (no.) | Depth (cm) | Material Assayed |
ISGS Number |
Uncorrected Age |
delta13C (‰) |
Corrected Age |
|---|---|---|---|---|---|---|
| KANSAS R. | ||||||
| Core 20 | 168 | humates 1 | 2623 | 19,900±450 | -19.4 | 19,990±450? |
| Airport Terrace Core 33 |
30 | humates | 3056 | 2,130±140 | -15.6 | 2,280±140 |
| 40 | humates 1 | 2996 | 1,910±70 | -14.5 | 2,080±70 | |
| 163 | humates 1 | 2997 | 11,480±440 | -20.4 | 11,550±440 | |
| 193-203a | humates | 3053 | 14,240±480 | -17.8 | 14,360±480 | |
| 193-203b | humates 1 | 3054 | 17,690±1000 | -17.7 | 17,800±1,000 | |
| 228-233 | humates | 3003 | 13,640±540 | -18.3 | 13,750±540 | |
| 525-528 | humates | 3004 | 11,440±570 | -16.5 | 11,580±570 | |
| FR1 | 90 | humates | 3650 | 2,170±70 | -15.2 | 2,330±70 |
| 103 | humates | 3649 | 2,240±70 | -17.2 | 2,360±70 | |
| 116 | humates | 3648 | 1,320±70 | -15.2 | 1,480±70 | |
| 136 | humates | 3662 | 1,460±70 | -15.5 | 1,610±70 | |
| 136 | humates | 3662 replicate | 1,500±70 | -15.6 | 1,650±70 | |
| 173 | humates | 3660 | 2,740±70 | -14.9 | 2,900±70 | |
| 201 | humates | 3658 | 3,680±70 | -15.6 | 3,830±70 | |
| 275 | humates | 3601 | 4,950±80 | -17.2 | 5,070±80 | |
| 345 | humates | 3734 | 5,950±70 | -18.2 | 6,060±70 | |
| FR2 | 74 | humates | 3602 | 2,960±70 | -16.0 | 3,100±70 |
| 101 | humates | 4175 | 4,060±70 | -16.2 | 4,200±70 | |
| 258 | humates | 3726 | 5,870±160 | -19.6 | 5,960±120 | |
| 345 | humates | 4174 | 5,640±70 | -18.2 | 5,750±70 | |
| 450 | humates | 4173 | 5,820±70 | -18.6 | 5,920±70 | |
| FR3 | 290 | humates | 3812 | 7,240±70 | -17.1 | 7,370±70 |
| 415 | humates | 4064 | 9,400±160 | -19.4 | 9,490±160 | |
| FRS | 104 | humates | 3707 | 1,500±70 | -17.2 | 1,630±70 |
| 390 | humates | 3657 | 5,510±80 | -18.4 | 5,620±80 | |
| REPUBLICAN R. | ||||||
| FR10 | 246 | humates | 3597 | 1,380±70 | -16.6 | 1,520±70 |
| 310 | humates | 3598 | 1,590±70 | -15.7 | 1,740±70 | |
| 424 | humates | 3599 | 1,880±70 | -16.6 | 2,010±70 | |
| 510 | humates | 3600 | 3,790±110 | -19.0 | 3,880±110 | |
| WILDCAT CR. | ||||||
| WC1 (FR7) | 85 | humates | 3780 | 1,790±70 | -16.7 | 1,920±70 |
| 226 | humates | 3781 | 9,830±100 | -17.0 | 9,960±100 | |
| 315 | humates | 3604 | 17,000±300 | -22.7 | 17,040±300 | |
| 434 | humates | 3603 | 23,770±300 | -19.2 | 23,860±300 | |
| 560 | humates | 3608 | 23,780±410 | -18.6 | 23,890±410 | |
| 612 | humates | 3607 | 23,400±400 | -19.2 | 23,500±400 | |
| WC4-T1 | 149 | humates | 4001 | 2,710±70 | -16.3 | 2,850±70 |
| 222 | humates | 4024 | 1,850±70 | -19.3 | 1,940±70 | |
| WC4-T2 | 117 | humates | 4073 | 3,370±70 | -15.9 | 3,520±70 |
| 175 | humates | 4000 | 4,210±70 | -18.6 | 4,310±70 | |
| 271 | humates | 4025 | 5,440±70 | -16.7 | 5,570±70 | |
| WC4-T3 | 113 | humates | 4171 | 1,260±70 | -18.0 | 1,380±70 |
| WC5-T1 | 126 | humates | 3998 | 1,600±70 | -16.4 | 1,740±70 |
| WC5-T2 | 322 | humates | 4072 | 24,280±150 | -16.9 | 24,410±150 |
| WC5-T6 | 88 | humates | 4172 | 3,480±70 | -13.9 | 3,660±70 |
| 359 | humates | 4034 | 10,150±80 | -16.0 | 10,290±80 | |
| FORSYTH CR. | ||||||
| FR4A | 86 | humates | 3856 | 1,720±70 | -15.7 | 1,870±70 |
| 118 | humates | 3617 | 2,850±70 | -17.1 | 2,980±70 | |
| 380 | humates | 3609 | 6,630±70 | -17.7 | 6,740±70 | |
| FR4B | 155 | humates | 3871 | 8,510±90 | -17.0 | 8,640±90 |
| 167 | humates | 3860 | 8,550±70 | -17.5 | 8,680±70 | |
| 225 | humates | 90902 | 9,600±70 | -19.6 | 9,690±70 | |
| 264 | humates | 3778 | 10,600±200 | -19.2 | 10,690±200 | |
| 270 | humates | 3858 | 10,520±140 | -19.8 | 10,600±140 | |
| 320 | humates | 90912 | 10,230±60 | -17.4 | 10,350±60 | |
| 375 | humates | 3857 | 10,410±120 | -17.5 | 10,530±120 h3 | |
| 380 | bone (Bison sp.) | 3605 | 4,120±70 | -10.5 | 4,350±70 | |
| 537 | humates | 3953 | 10,520±80 | -18.2 | 10,630±80 | |
| FC1-T1 | 160 | humates | 4038 | 1,200±70 | -18.7 | 1,300±70 |
| FC2-T1 | 145 | humates | 4035 | 2,470±70 | -18.2 | 2,580±70 |
| 259 | humates | 4042 | 2,800±70 | -16.2 | 2,950±70 | |
| FC3-T1 | 147 | humates | 4039 | 4,770±70 | -14.9 | 4,940±70 |
| FC3-T2 | 193 | humates | 4074 | 8,260±90 | -16.7 | 8,400±90 |
| FC4-T1 | 140 | humates | 4066 | 6,410±90 | -15.2 | 6,570±90 |
| FC5-T1 | 167 | humates | 4062 | 4,860±70 | -13.6 | 5,040±70 |
| 186 | humates | 4179 | 5,810±70 | -15.0 | 5,970±70 | |
| FC5-T2 | 100 | humates | 4061 | 4,910±70 | -14.9 | 5,080±70 |
| 208 | humates | 4068 | 9,310±90 | -17.1 | 9,430±90 | |
| 295 | humates | 4063 | 12,760±100 | -21.0 | 12,830±100 | |
| FC6-T2 | 120 | humates | 4065 | 5,070±70 | -14.1 | 5,250±70 |
| 188 | humates | 4067 | 6,770±110 | -15.8 | 6,920±110 | |
| 208 | charcoal | 4057 | 5,670±70 | -25.8 | 5,660±70 | |
| 208 | humates | 4058 | 6,880±80 | -19.2 | 6,970±80 | |
| 280 | humates | 4060 | 10,600±160 | -18.0 | 10,710±160 | |
| PUMPHOUSE CR. | ||||||
| PHC1-T4 | 161 | humates | 3997 | 1,080±70 | -17.3 | 1,210±70 |
| PHC1-T2 | 258 | humates | 4026 | 8,860±110 | -15.8 | 9,010±110 |
| PHC2-T2 | 305 | humates | 4177 | 2,800±70 | -16.5 | 2,940±70 |
| 376 | charcoal & ash | 3999 | 2,450±70 | -21.2 | 2,510±70 h3 | |
| THREEMILE CR. | ||||||
| TMC1-T1 | 307 | humates | 4059 | 9,000±90 | -15.6 | 9,150±90 |
| TMC1-T2 | 130 | humates | 4056 | 6,690±80 | -17.2 | 6,820±80 |
| SEVENMILE CR. | ||||||
| FR13 | 91 | humates | 3852 | 4,540±70 | -14.4 | 4,710±70 |
| 146 | humates | 3651 | 6,820±80 | -15.5 | 6,980±80 | |
| FR14 | 380 | humates | 3716 | 8,820±160 | -19.7 | 8,910±160 h 3 |
| FR15 | 105 | humates | 3853 | 4,840±70 | -14.7 | 5,010±70 |
| 306 | humates | 3712 | 8,780±130 | -17.6 | 8,900±130 h 3 | |
| FR16 | 155 | humates | 3861 | 2,820±70 | -16.3 | 2,960±70 |
| 1. samples not treated with 2N hot HCl 2. Tx- (University of Texas Radiocarbon Laboratory) 3. Age determined from hearth |
||||||
Alluvial units defined on the maps associated with the stream systems discussed below include collectively the flood plain or T0; terrace 1 or T1, which is lowest in elevation; terrace 2 or T2, which is next highest; terrace 3 or T3, which is higher yet; and fans.
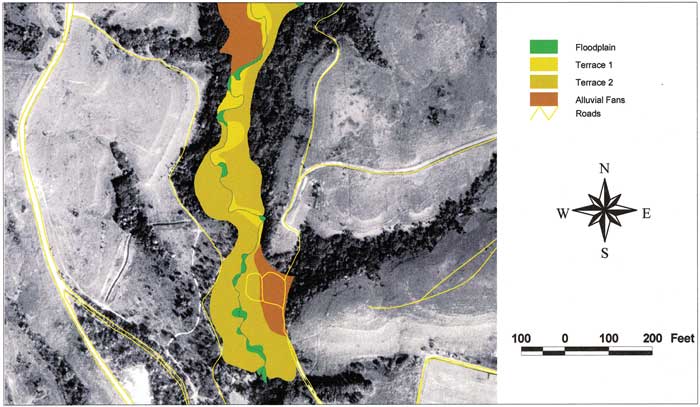
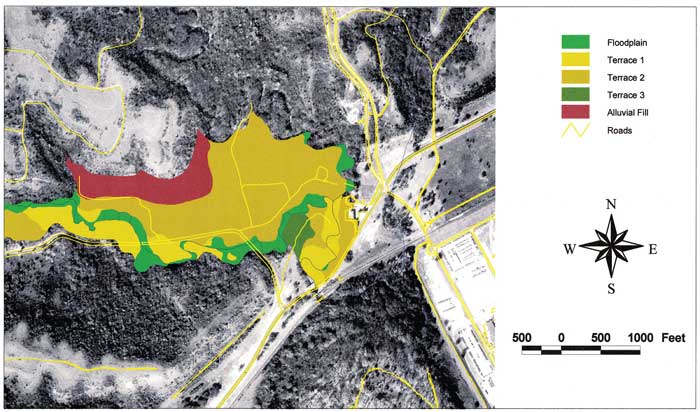
Breakneck Creek. Except for the east branch, Breakneck Creek system exhibits very little flood plain (T0) due to apparent recent entrenchment (Fig. 3). Further, the period of entrenchment and subsequent lateral migration associated with Terrace 1 (T1) was likely of short duration because of the modest amount of surface area created prior to entrenchment to the present flood-plain level. During T1 time the channel did, however, cut into the north side of the distal portion of the upper alluvial fan (Fig. 4). Terrace 2 (T2) clearly dominates the system from the confluence down to where its valley opens onto the Kansas River valley (Fig. 5). Although no radiocarbon ages have yet been obtained from fill in this system, experience elsewhere on Fort Riley indicates that the T2 fill could be up to 10,000 years old, but based on soil development, a maximum estimated age of 5,000 years may be the case in this drainage.
Figure 3--Alluvial fills of Breakneck Creek.
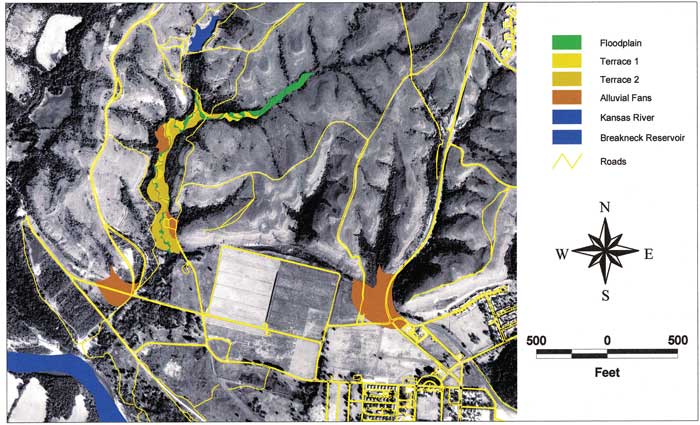
Figure 4--Alluvial fills of Upper Breakneck Creek.
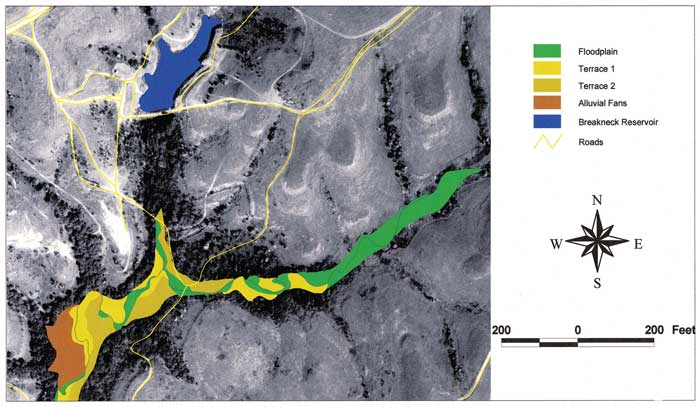
Figure 5--Alluvial fills of Lower Breakneck Creek.
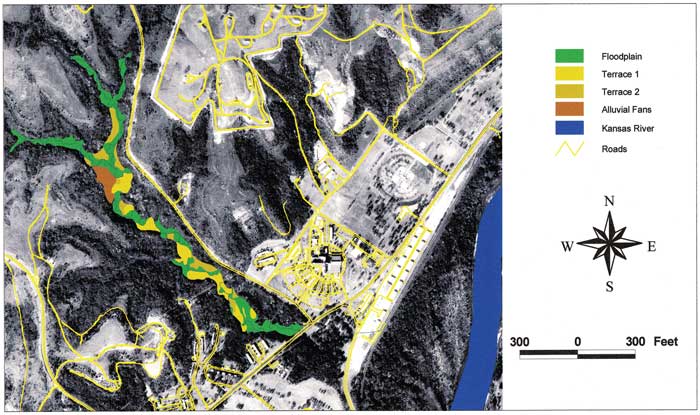
Onemile Creek. In contrast to Breakneck, Onemile Creek exhibits appreciable T0 throughout the system. The prominence of flood plain in the upper reaches is typical of most small tributaries and develops because of the flashy, concentrated runoff that occurs in the upper watershed, i.e., these areas are characterized by active channels and frequent flushing of the valley fill. From the upper confluence to the lower valley limit, T1 is regularly distributed, occupying about one-third of the valley floor. The distal portion of the single large fan was apparently eroded during T1-lateral migration. T2 remnants have survived at scattered location along the main valley and into the north branch; most of these elements are at risk due to present channel migration. To facilitate an appreciation of the valley fill in the context of the entire landscape, Onemile Creek alluvial surfaces have been superimposed on the orthophotography (Fig. 6). The distribution of woodland defines the full drainage network of the system and its size relative to the Kansas River. The single alluvial fan is evident below a high-energy tributary, i.e., a drainage large enough to have sufficient runoff and sediment supply to build a fan, but not large enough to have the discharge to reach the channel in the main valley. Ages of the individual fill units are probably temporally related to those of the Breakneck Creek system.
Figure 6--Alluvial fills of Onemile Creek.
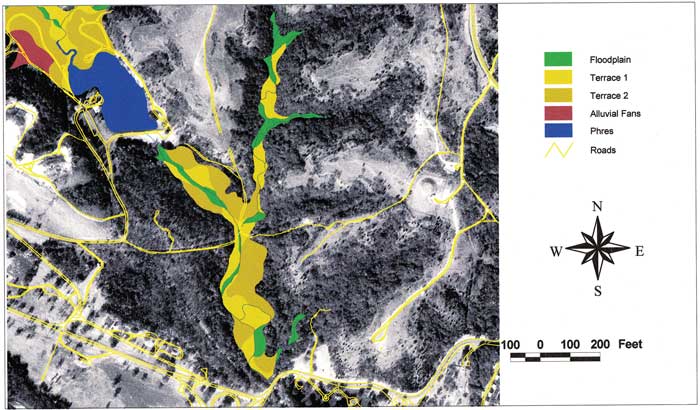
Pumphouse Creek. This system is characterized by a broad upper valley limited by Moon Lake, and narrow, bedrock-controlled, canyon-like lower valley, both of which are obvious in the width of alluvial fill mapped (Fig. 7). Flood-plain development is modest and uniform throughout the system, indicating an equilibrium longitudinal profile and a relatively short period of flood-plain development. Like the flood plain, the distributions of both terraces are fairly regular throughout the system, with T2 dominating the total valley bottom area. Four small alluvial fans, located above Moon Lake, have relatively steep surfaces and merge abruptly with the terraces and flood plain (Fig. 8). Despite the narrow nature of the lower bedrock valley, a large area of terrace has survived (Fig. 9). Overall, the alluvial surfaces of Pumphouse Creek are extremely well defined.
Figure 7--Alluvial fills of Pumphouse Creek.
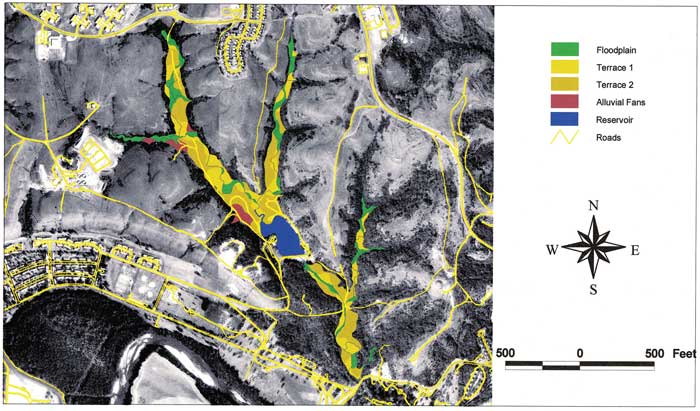
Figure 8--Alluvial fills of Middle and Upper Pumphouse Creek.
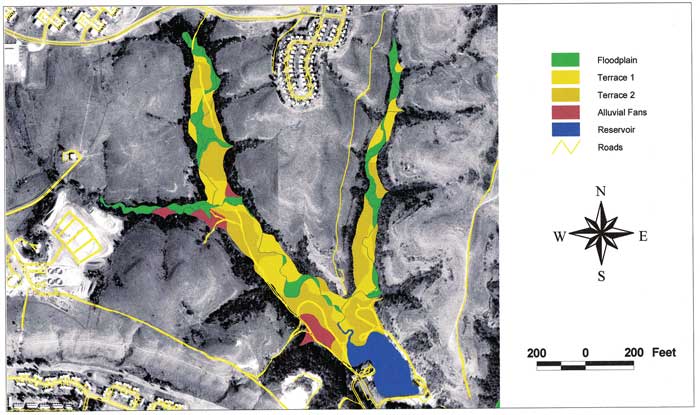
Figure 9--Alluvial fills of Lower Pumphouse Creek.
Three locations within the system were selected for radiocarbon dating: PHC2-T2 is a cutbank profile exposed in the T2 fill of lower Pumphouse Creek; it revealed three weakly developed buried soils, a hearth, and point bar deposit at the base. Two ages obtained from the site are similar (Table 1): charcoal and ash for the hearth dated to about 2,500 yr B.P., whereas the buried soil in which it was located dated to about 2,900 yr B.P. The disparity is probably due to the latter date being contaminated by redeposition of older carbon in the sediments within which the soil formed. PHC1-T2, also located in T2 fill provided a much older age of about 9,000 yr B.P.; the age is most likely accurate and representative of the fill age. Inspection of the T2 fill in the system indicates that it consisted of two episodes of cutting and filling, the latter of which cut into the 9,000-yr old fill and replaced part of it up to the same level. Most of the T2 fill in the main valley appears, however, to date to 9,000 yr B.P. The site in T1 fill, PHC1-T4, provided an age younger than either T2 fills, which indicates that T1 fill ranges from about 1,500 to 1,000 years in age.
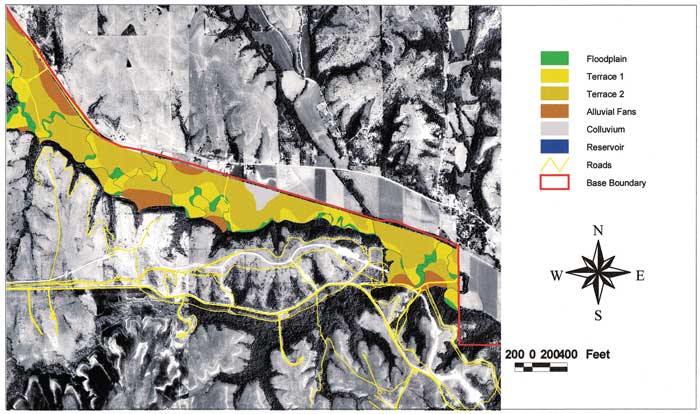
Forsyth Creek. Five different alluvial surfaces appear in the Forsyth drainage, and, with one exception, these are regularly distributed along the main valley (Fig. 10). T0 is developed to a small extent throughout, but T1 and T2 clearly dominate, with four distinct, large areas of coalescing fans. The largest area of T0 is located at the confluence of the two branches forming the main valley, a network position where such channel mobility is anticipated (Fig. 11). The Williston Point area, another valley confluence, still retains large terrace remnants, in particular the triangular-shaped unit ofT2 wedged between the main channel and the tributary (Fig. 12). The largest terrace remnants are found in lower Forsyth, at its confluence with Threemile Creek (Fig. 13), where all five alluvial units appear.
Figure 10--Alluvial fills of Forsyth Creek.
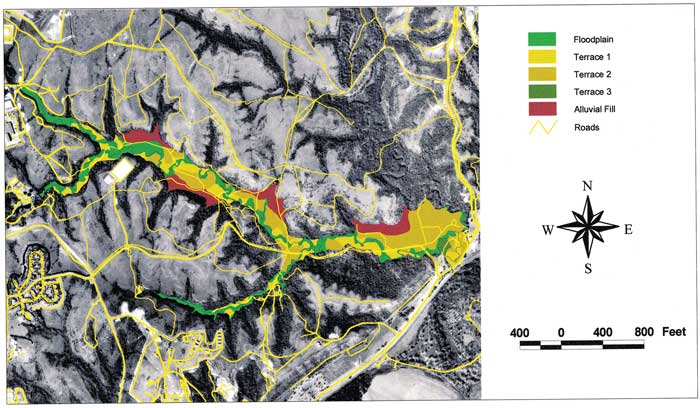
Figure 11--Alluvial fills of Upper Forsyth Creek.
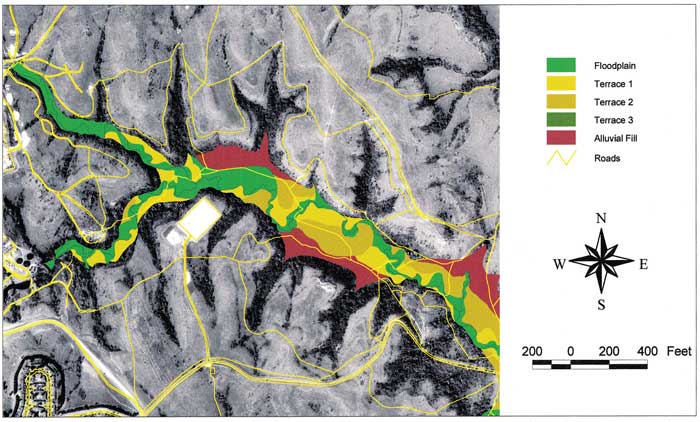
Figure 12--Alluvial fills of Williston Point, Forsyth Creek.
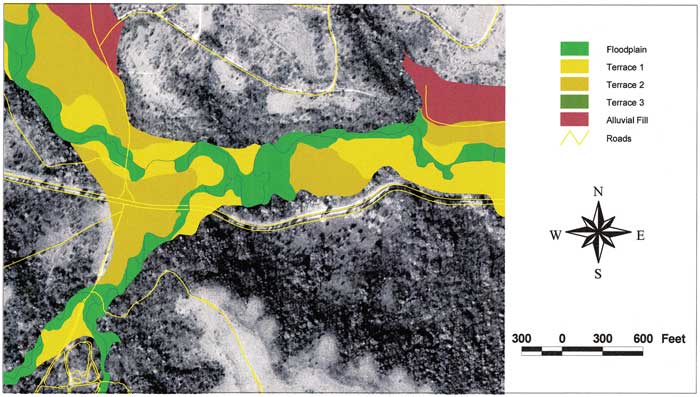
Figure 13--Alluvial fills of confluence of Forsyth and Threemile creeks.
Ten sites, all from backhoe trenching, were investigated in the Forsyth Creek valley. FR 4B, a T2 site at the confluence, produced radiocarbon age ranges about 11,000 to 8,000 yr B.P., whereas FC6-T2, a site in that same area, produced ages from about 11,000 to 5,200 yr B.P. (Table 1). The existence of an older uppermost age at the former site may be due to the stripping (≤1 m) taking place during development of the power line corridor, i.e., the younger buried soil was mechanically removed. Four T2 sites in the Williston Point area indicated fill ages that range from about 5,000 to 12,000 yr B.P., as does T2 site FC4-T1 upstream. T2 fill ranges in age from over 12,000 to about 5,000 yr B.P. T1 fill was dated at three sites, FR4A, FC1-T1, and FC2-T1, all of which indicate ages less than 5,000 to about 1,000 yr B.P. The older age of 6,740 yr B.P. from FR4A probably reflects contamination from older carbon since this was not a soil that was dated, but rather a silt drape from a flood, which would have transported older, recycled organic (plant-derived) and inorganic (rock-derived) carbon.
Wildcat Creek. The strange, incomplete appearance of the pattern of alluvial fills in Wildcat Creek is a function of adherence to the base boundary extending down the valley axis (Fig. 14). Even with this incomplete mapping, the dominance of the T2 in the main valley is obvious: T0 and T2 are poorly developed throughout the mapped reach (and beyond). The pattern of T1 fill indicates that a limited amount of lateral migration occurred then, prior to entrenchment to the present level. The recent nature of the entrenchment is apparent: although the channel is highly meandering and characterized by actively eroding cutbanks, little of the T1 and adjacent T2 has been removed. Coalescing fans are common, especially in the upper reaches of the main valley (Fig. 15). In fact, fans dominate the Little Arkansas Creek; due to the coarse and active nature of the fans, the channel has, in one area, occupied a straight course for a long time, i.e., no terrace fill has been deposited (Fig. 16). The valley bottom in the lowermost part of the valley appear as a series of stair steps: T0, T1, T2, and fan deposits are all in close proximity to one another and have distinct scarps at their contacts (Fig. 17).
Figure 14--Alluvial fills of Wildcat Creek.
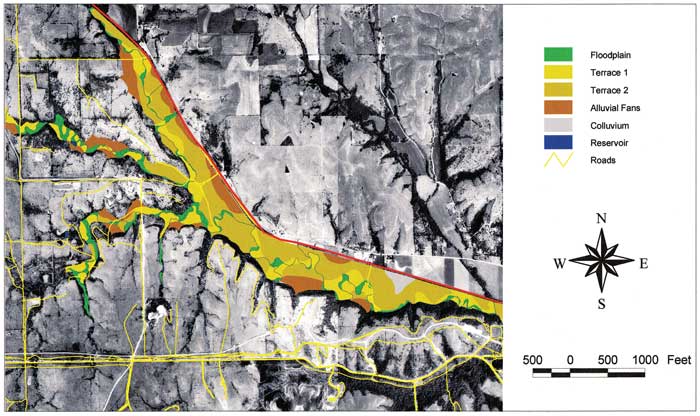
Figure 15--Alluvial fills of Upper Wildcat Creek.
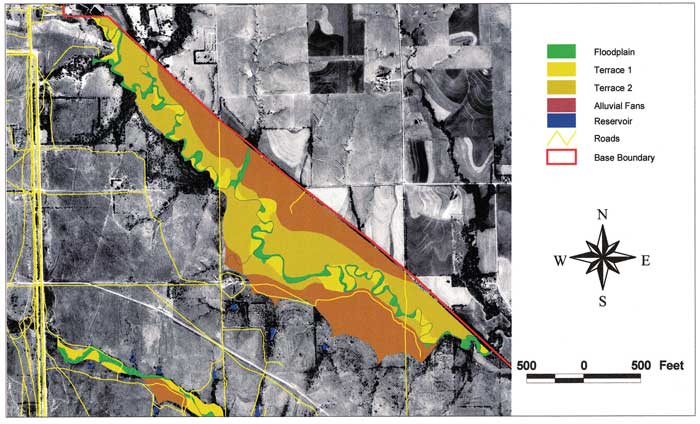
Figure 16--Alluvial fills of Little Arkansas Creek-Upper Wildcat Creek area.
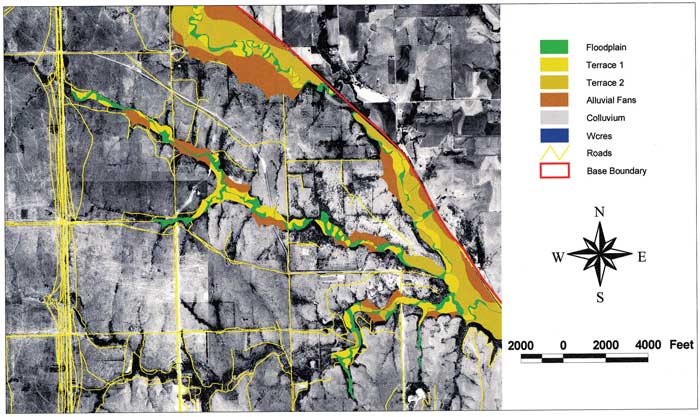
Figure 17--Alluvial fills of Lower Wildcat Creek area.
Radiocarbon ages from three different fills provide the greatest temporal range of the study stream systems. Sites WC1 and WC5-T2 are located on alluvial fans, and yielded basal ages in excess of 24,000 yr B.P., yet the uppermost age at WC1 was only about 1,900 yr B.P. Ages from the sites of T2 fill (WC4-T2, WC5-T6) indicate an age range from over 10,000 yr B.P. to as young as 3,000 yr B.P. Accordingly, T1 sites (WC4-T1, WC4-T3, and WC5-T1) ranged from less than 3,000 yr B.P. to about 1,000 yr B.P.
Because the Fort Riley project is geoarchaeologically focused, the ultimate question posed by this investigation concerns the preservation of cultural materials, particularly in a buried context. Investigations of cultural material located at or near the land surface on Fort Riley have demonstrated that aboriginal peoples made use of the entire landscape, the evidence of which is preserved primarily in a buried context.
Since the archaeological record is concentrated in the last 12,000 years (Table 2), our investigations have centered on deposits of that antiquity. On the uplands, this time period is represented by the Brady soil, developed in terminal Peoria loess, and by overlying Bignell loess, deposited periodically during approximately the last 9,000 years. Consequently, the distribution of such lithostratigraphic and pedostratigraphic units on the uplands dictates where the potential for buried cultural material exists. Aboriginal activity was concentrated in valleys of the central Great Plains because of the relatively rich resource base, and Fort Riley is a prime place to observe this concentration. Alluvial fills range in age from pre-12,000 BP to the present, and most fills contain soils, evidence of stable flood-plain environments.
Table 2. Central Great Plains Cultural Chronology
| Paleoindian | 12,000 - 9000 BP 10,050 - 7050 BC |
| Early-Middle Archaic | 9000 - 5000 BP 7050 - 3050 BC |
| Late Archaic | 5,000 - 2,000 BP 3050 - 50 BC |
| Early-Middle Woodland | 2,000 - 1,500 BP 50 BC - AD 450 |
| Late Woodland, Late Prehistoric, and Protohistoric | 1,500 - 250 BP AD 250 - 1700 |
Through a process of separating the various individual alluvial surfaces from one another, the areas with certain fill age attributes can be appreciated in the context of the potential for burial of remains from particular cultures. This has been done for three systems representing different drainage sizes: Pumphouse, Forsyth, and Wildcat creeks. A synthesis of ages of fill and cultural associations indicates similarities among the small (Pumphouse), medium (Forsyth) and large (Wildcat) valleys (Table 3). Youngest cultural material (Late Prehistoric to Protohistoric and Historic) is associated with the flood-plain deposits. Because these deposits are being rework so extensively, it is unlikely that any archaeological material will be in situ, however; conversely, cultural material predating the age of the flood plain may be redeposited in the fill, e.g., a bark beater (Late Woodland?) was found in with the gravel lag on a channel point bar in Wildcat Creek. T1 fill in Forsyth and Wildcat creeks is Late Archaic to Late Woodland in age, whereas the T1 fill of Pumphouse Creek appears to have been deposited in a very brief interval, about 500 years. T2 fill clearly dates from the Paleoindian era into the Archaic, with Pumphouse Creek again being a bit different from the other two systems. Only Forsyth Creek has any T3 recognized, and the aerial extent is extremely limited. Because the T2 is inset, the T3 is of presumed pre-Paleoindian age, and any associated archaeological materials would be located within the upper few tens of centimeters. Alluvial fans merit special attention because of their aerial extent in some systems and extreme range in age of their fill, i.e., pre-Paleoindian to Early Woodland, where dated in Wildcat valley.
Table 3. Buried Cultural Associations and Estimated1 Threshold Ages2 for Alluvial Fills
| Fill | Pumphouse Creek | Forsyth Creek | Wildcat Creek |
|---|---|---|---|
| T0 | Late Prehistoric-Protohistoric (≤1,000) |
Late Prehistoric-Protohistoric (≤1,000) |
Late Prehistoric-Protohistoric (≤1,000) |
| T1 | Late Woodland (1,500-1,000) |
Late Archaic-Late Woodland (5,000-1,000) |
Late Archaic-Late Woodland (3,000-1,000) |
| T2 | Paleoindian-Late Woodland (>9,000-1,500) |
Paleoindian-Middle Archaic (13,000-5,000) |
Paleoindian-Late Archaic (11,000-3,000) |
| T3 | None (all surficial) (>13,000) |
||
| Fans | Paleoindian-Early Woodland (?) |
Paleoindian-Early Woodland (?) |
Paleoindian-Early Woodland (24,000-1,800) |
| 1 from 14C ages and presumed sedimentation rates 2 years B.P. |
|||
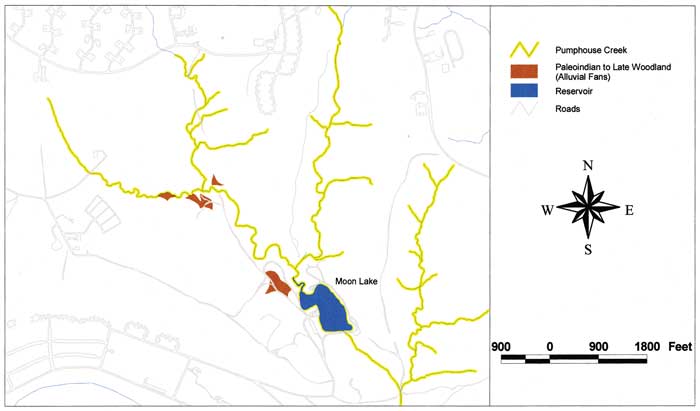
Pumphouse Creek. Individual depictions of T0, T1, T2, and fan extent (Figs. 18-21) suggest that the majority of the valley fill has the potential to contain buried sites. Late Woodland-age fills are extensive (T1), but the older Paleoindian and Archaic-age fills are most extensive. Cutbank exposures of cultural features, including the hearth dated to the Late Archaic, attest to the presence of buried cultural materials in these fills.
Figure 18--Pumphouse Creek; Late Prehistoric to Protohistoric floodplain.
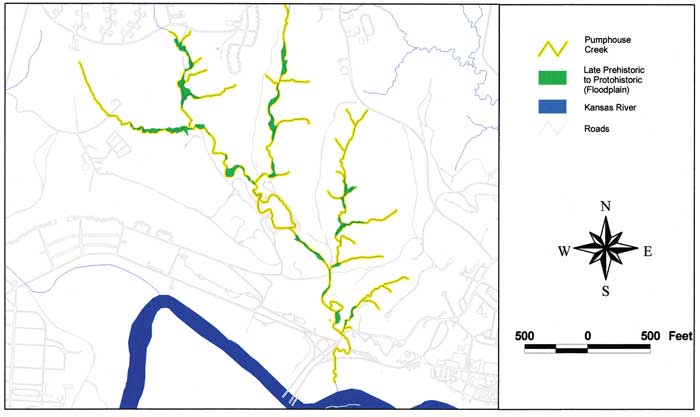
Figure 19--Pumphouse Creek; Late Woodland Sediments.
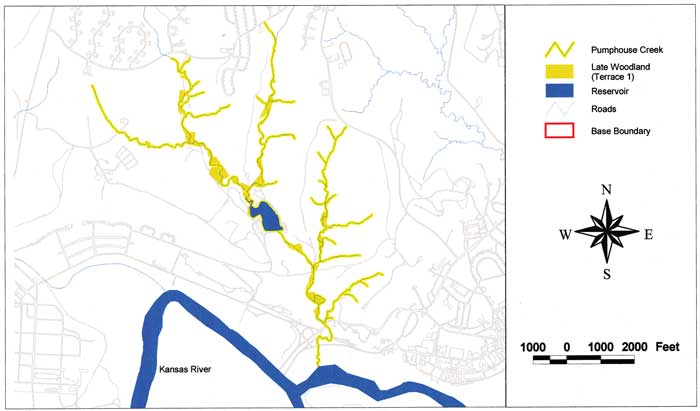
Figure 20--Pumphouse Creek; Paleoindian to Late Woodland Sediments.
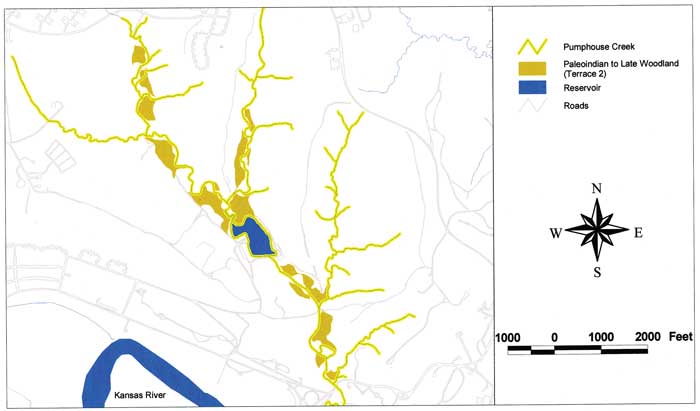
Figure 21--Pumphouse Creek; Paleoindian to Late Woodland alluvial fans.
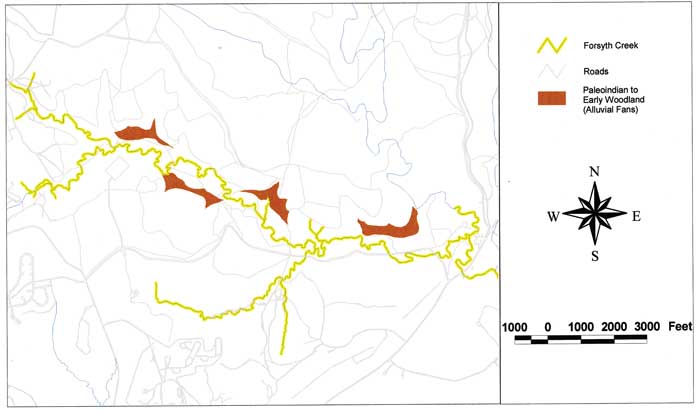
Forsyth Creek. The relative area of flood plain is greater in Forsyth than Pumphouse, but it is still a small part of the total valley fill (Fig. 22). A sizable area is involved in the T1 and T2 fill distributions, particularly the latter (Figs. 23, 24). The large area of T2 fill at the confluence with Threemile Creek, dating to Paleoindian and Archaic, very likely contains buried cultural material and sites due to its resource-rich location. A similar confluence area in lower Sevenmile Creek, containing a large expanse of T2 fill, produced Early Archaic hearths in three of four backhoe trenches (Table 2). T3 fill should have only surficial cultural material, and that small remnant has been heavily modified by road construction (Fig. 25). Although undated in Forsyth Creek, the alluvial fan fill appears, from color and stratigraphic position, to be ages similar to those in Wildcat Creek where temporal determinations have been made, i.e., pre-Paleoindian to Woodland (Fig. 26).
Figure 22--Forsyth Creek; Late Prehistoric to Protohistoric floodplain.
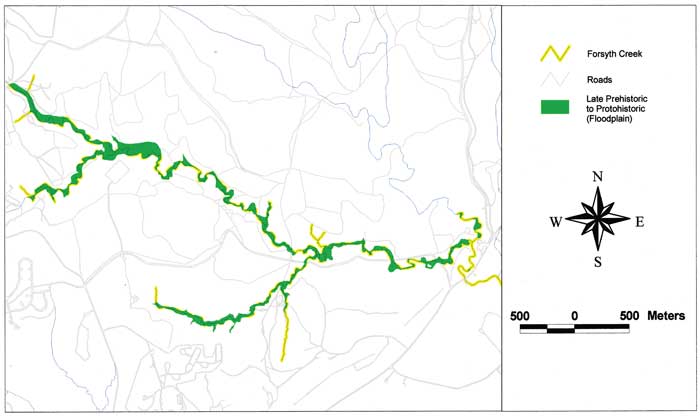
Figure 23--Forsyth Creek; Late Archaic to Late Woodland sediments.
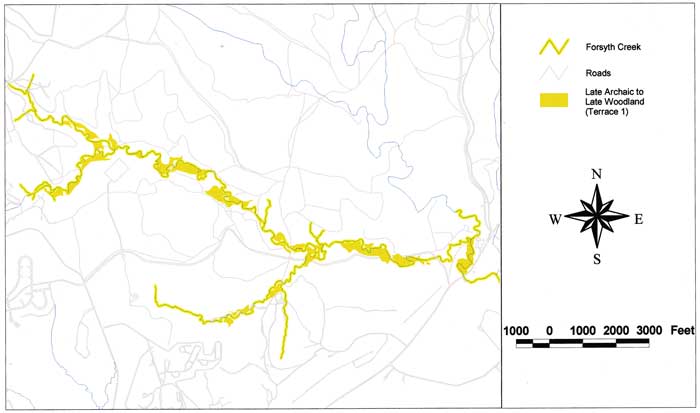
Figure 24--Forsyth Creek; Paleoindian to Late Archaic sediments.
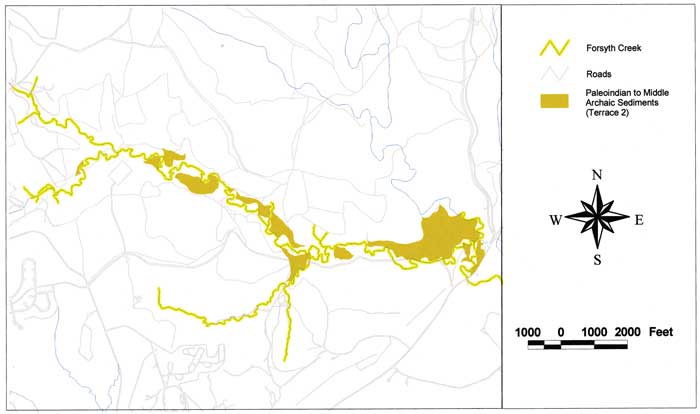
Figure 25--Forsyth Creek; surficial sediments.
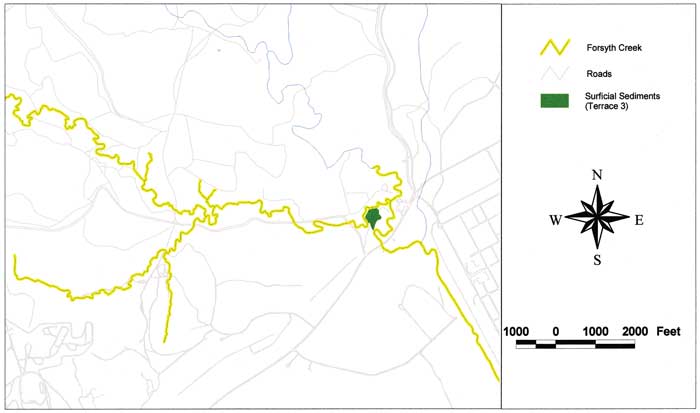
Figure 26--Forsyth Creek; Paleoindian to Early Woodland sediments.
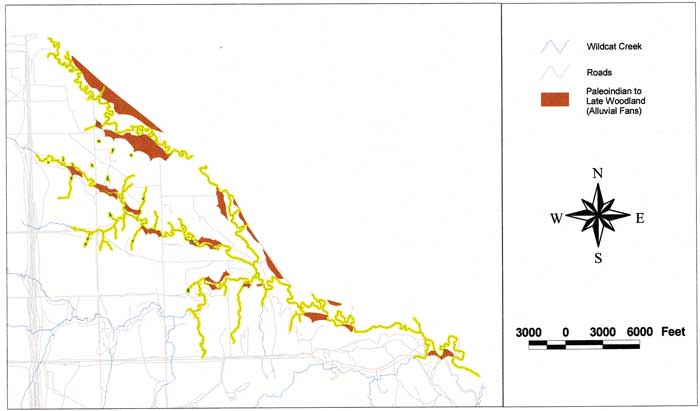
Wildcat Creek. Due to recent, region-wide entrenchment, Wildcat Creek has little expression of flood plain (Fig. 27), but older fills abound. T1 surfaces and fills are common throughout, including the Little Arkansas Creek valley (Fig. 28). T2 fills are, however, ubiquitous, implying that a large potential exists for the presence of buried Paleoindian and Archaic materials in the main valley (Fig. 29). Because of the relatively large extent and age range of alluvial fans in the creek system valley, it is also likely that potential sites are buried in these deposits as well; in fact, the higher and better drained fans may have been preferred surfaces during times of frequent flooding (Fig. 30).
Figure 27--Wildcat Creek; Late Prehistoric to Protohistoric sediments.
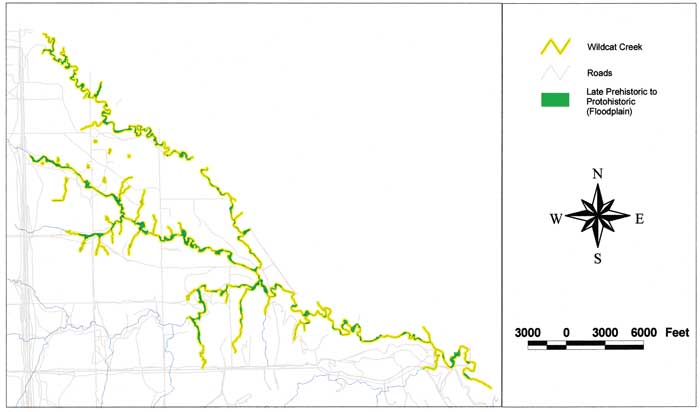
Figure 28--Wildcat Creek; Late Archaic to Late Woodland sediments.
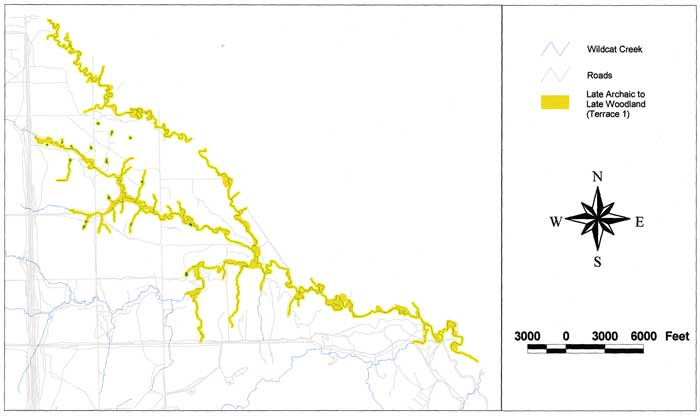
Figure 29--Wildcat Creek; Paleoindian to Late Archaic sediments.
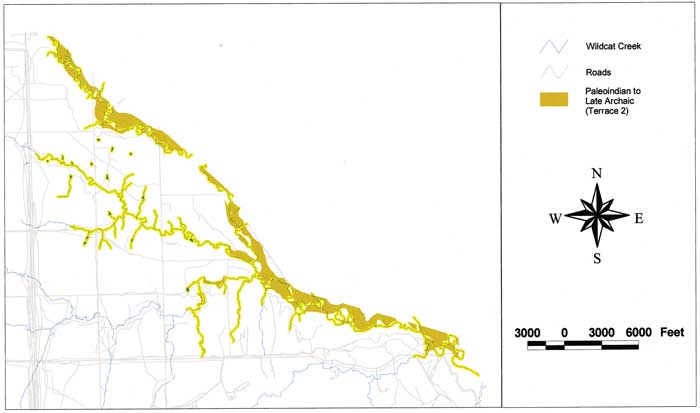
Figure 30--Wildcat Creek; Paleoindian to Late Woodland sediments.
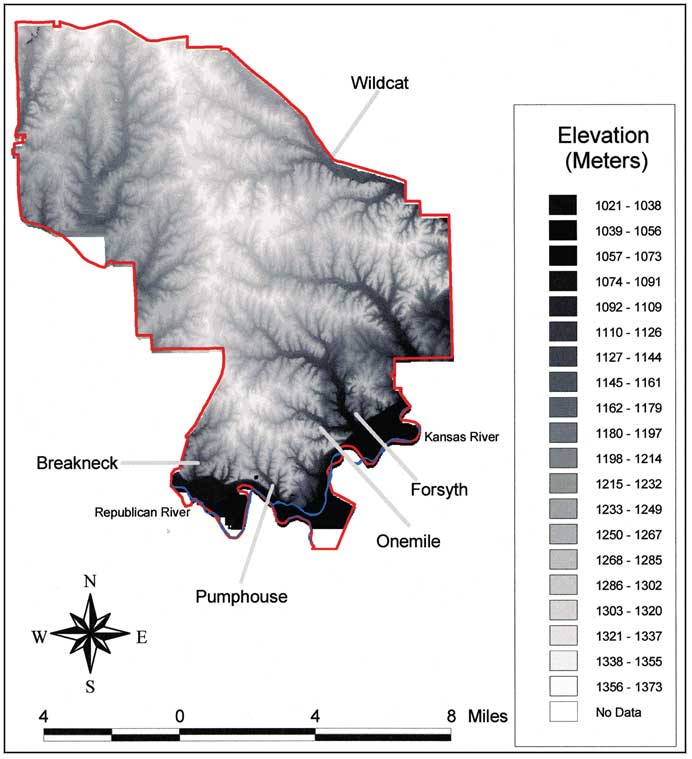
A digital elevation model of the installation depicts the organization of the stream systems and provides insight into the evolution of the landscape. Figure 31 is a small-scale rendering of the installation identifying the stream systems where study emphasis has been focused. Tributaries of the Kansas River have dissected the upland from the southeast and east, whereas the dissection of the Republican River system is evidenced on the western and northwestern realm. Uplands and upper slope reaches are mantled with varying thicknesses of loess, up to 12 m along the Kansas River valley bluffs in the southeast part of the installation. The north-south trending upland divide where dissection of the two systems converges has a loess mantle of variable thickness and is locally known as the "bowling alley" due to its relatively straight and narrow character. Using the electronic version in an ArcView environment, the digital elevation model may be rendered at any scale and the updated drainage network superimposed.
Figure 31--Stream drainage digital elevation model.
Loveland and Peoria loesses. Distribution of the loessal soils indicates that the primary remnant of the upland loess mantle exists in the western and northern part of the base (Fig. 32). Outcrop of the older Loveland loess occurs, however, in the southeastern part, on the eroded, upper slopes of the steep tributaries to the Kansas River valley, e.g., upper Breakneck, Forsyth, and Onemile creeks, as well as along the valley walls at the upper end of Milford Lake. Peoria loess, topographically and stratigraphically above the Loveland, covers a large expanse along the north-south trending drainage divide in the center of the base, i.e., the "bowling alley." Areas of Peoria loess not shown on the map, due to errors in the field mapping, occur along the bluff of the Kansas River valley, where thicknesses exceed ten meters in places. Ages on the late Pleistocene loess mantle have been determined at several localities (Table 4).
Figure 32--Distribution of Pleistocene loess.
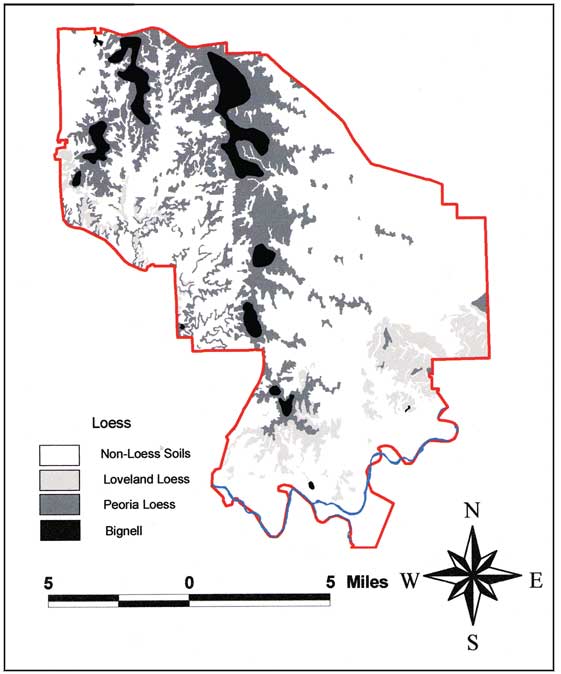
Table 4. Upland (Loessal) Radiocarbon Ages
| Site Name (no.) | Depth (cm) | Material Assayed |
ISGS Number |
Uncorrected Age |
δ13C (‰) |
Corrected Age |
|---|---|---|---|---|---|---|
| Summer Hill | ||||||
| Trench 2 | 215 | humates | 3164 | 19,020±650 | -15.5 | 19,170±650 |
| 235 | humates | 3163 | 21,440±590 | -15.1 | 21,610±590 | |
| 255 | humates | 3160 | 21,430±740 | -15.4 | 21,580±740 | |
| Summer Hill Trench 5 |
310 | humates | 3159 | 20,610±750 | -16.0 | 20,760±750 |
| 330 | humates | 3158 | 22,440±992 | -17.0 | 22,560±990 | |
| 350 | humates | 3157 | 22,850±100 | -17.2 | 23,000±1,100 | |
| Summer Hill Trench 6 |
150 | humates | 3101 | 6,000±130 | -16.2 | 6,140±130 |
| 170 | humates | 3140 | 7,640±220 | -17.1 | 7,770±220 | |
| 200 | humates | 3142 | 11,100±310 | -16.8 | 11,230±310 | |
| 240 | humates | 3131 | 11,840±270 | -16.2 | 11,980±270 | |
| 260 | humates | 3143 | 13,080±310 | -15.9 | 13,240±310 | |
| 280 | humates | 3146 | 13,310±430 | -15.6 | 13,470±430 | |
| Summer Hill Trench 6a |
90 | humates | 4174 | 4,740±70 | -14.9 | 4,900±70 |
| 130 | humates | 3666 | 5,960±120 | -17.2 | 6,080±120 | |
| 170 | humates | 3665 | 8,520±140 | -17.3 | 8,650±140 | |
| 210 | humates | 3731 | 11,300±220 | -17.4 | 11,430±150 | |
| 225 | humates | 3663 | 15,290±220 | -17.2 | 15,420±220 | |
| 256 | humates | 3750 | 14,690±240 | -17.3 | 14,810±240 | |
| 295 | humates | 3749 | 17,320±310 | -16.5 | 17,460±310 | |
| 330 | humates | 3748 | 17,260±300 | -16.0 | 17,400±300 | |
| 344 | humates | 3747 | 17,040±300 | -15.9 | 17,180±300 | |
| Lookout Hill Core 23 |
100 | humates | 3010 | 3,750±160 | -16.0 | 3,890±160 |
| Pumphouse Hill | 80 | humates | 3777 | 3,200±70 | -14.2 | 3,380±70 |
| 105 | humates | 3776 | 4,250±80 | -14.9 | 4,410±80 | |
| 130 | humates | 3165 | 5,660±180 | -15.6 | 5,810±180 | |
| 170 | humates | 3728 | 7,210±130 | -16.2 | 7,350±130 | |
| 235 | humates | 3729 | 12,190±250 | -16.6 | 12,330±250 | |
| 265 | humates | 3730 | 16,280±220 | -21.8 | 16,330±220 | |
| 290 | humates | 3167 | 18,770±450 | -21.6 | 18,830±450 | |
| 290 | humates | 3727 | 21,670±670 | -22.2 | 21,720±670 | |
| 330 | humates | 3166 | 22,910±850 | -18.4 | 23,010±850 | |
| 340 | humates | 3618 | 33,210±2700 | -18.0 | 33,300±2,700 | |
| Site 27 | 64 | humates | 3779 | 3,300±70 | -15.7 | 3,450±70 |
| 129 | humates | 3616 | 9,350±100 | -20.5 | 9,420±100 | |
| 190 | humates | 3615 | 17,730±320 | -21.1 | 16,790±320 | |
| 234 | humates | 3614 | 21,180±150 | -18.2 | 21,290±150 | |
| Farnum Creek So (site 28) |
18 | humates | 3058 | 900±130 | -15.7 | 1,050±130 |
| 23 | humates | 3005 | 850±100 | -15.5 | 1,000±100 | |
| 28 | humates | 3006 | 1,570±110 | -15.4 | 1,730±110 | |
| 147 | humates | 3008 | 14,050±770 | -19.0 | 14,140±770 | |
| 172 | humates | 3055 | 13,990±470 | -17.3 | 14,120±470 | |
| 177 | humates | 3057 | 19,540±1800 | -17.6 | 19,700±1,800 | |
| 202 | humates | 3007 | 14,980±590 | -17.3 | 15,110±590 | |
| Bala Cemetery Core 19 150 |
humates 1 | 2622 | 18,950±280 | -17.3 | 19,070±280 | |
| Bala Cemetery Trench |
147 | humates | 3613 | 16,300±150 | -22.6 | 16,340±150 |
| 194 | humates | 3612 | 21,170±140 | -20.3 | 21,240±140 | |
| 220 | humates | 3611 | 25,310±320 | -18.3 | 25,420±320 | |
| 253 | humates | 3610 | 28,010±280 | -17.1 | 28,140±280 | |
| 1 sample not treated with 2N hot HCl | ||||||
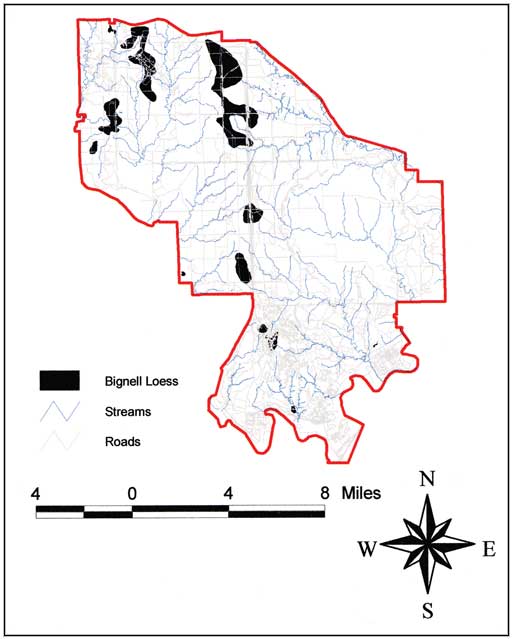
Bignell loess. Determining the distribution of the Bignell loess is difficult in that it has no unique soil series associated with it. This is not surprising in that the Bignell loess is very similar to the Peoria loess and, where thin, it becomes completely involved in surface soil development. A general model for its distribution has emerged, however: the Bignell is typically found on the highest areas of major drainage divides and at scattered locations along the bluff of the Kansas River valley (Fig. 33). The distribution indicated in the northern part of the Bowling Alley has not been ground-truthed due to its inaccessibility (firing range). It has, however, been located by soil coring along the northern and northwestern parts adjacent to the range. Six sites (3 major divides, 3 bluff) have documented the existence and age of the Brady soil and overlying Bignell loess; data from each of these sites is available in W.C. Johnson, 1998a, b, and in Table 4.
Figure 33--Distribution of Holocene loess.
Consideration of landforms other than valley fills and the sedimentary bodies comprising the upland loess mantle provides insight into the exposed and near-surface bedrock expression on the installation. Areas not mantled by loess (Fig. 32) and filled with alluvium (Fig. 31) consist of valley side slope deposits, containing admixtures of loess and weathered bedrock. Bedrock exposures are most common in the southeastern part of the installation and are manifest as outcrops in the upper parts of small, steep tributaries.
Oblique, three dimensional views of the alluvial fill surfaces were generated in order to provide a perspective on the present-day valley-bottom topography. This task was accomplished using ESRI ArcView 3-D Analyst software. In addition, DeLorme 3-D TopoQuad databases and software were used to generate low, oblique images of the study drainage basins.
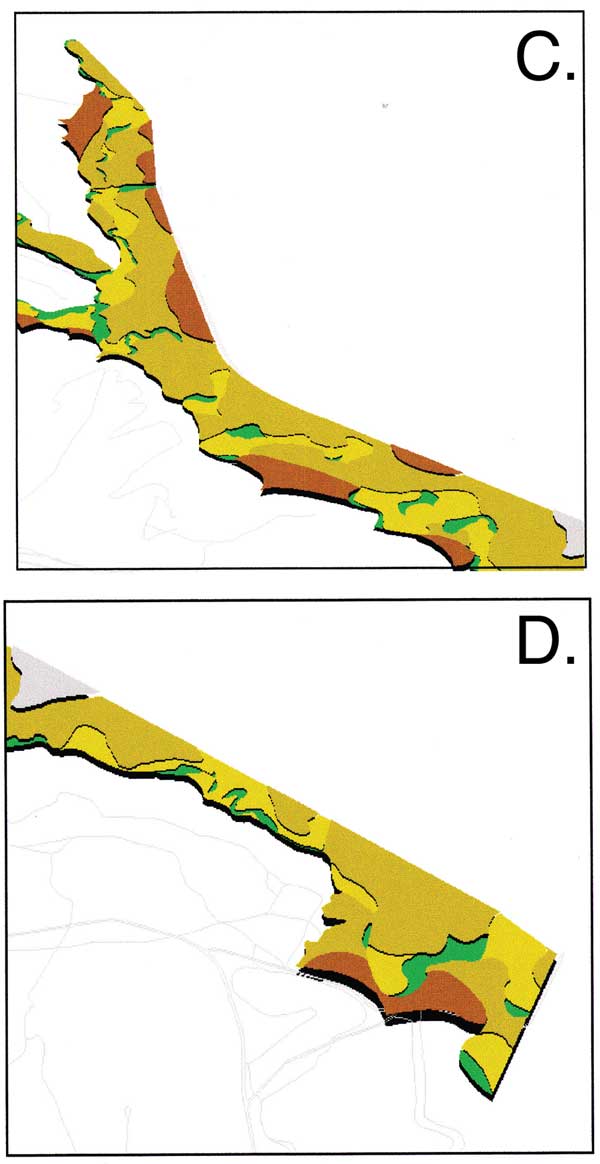
Using vertical exaggeration and oblique orientation, study stream systems are depicted to illustrate the proportional differences in elevation between the different alluvial surfaces, i.e., the flood plain and terraces. Onemile Creek fill consists largely of the recent flood plain deposits, but yet contains several large fragments of T1 and T2 fill, in addition to a major alluvial fan (Fig. 34; refer to the color scheme-surface correlations used in Figs. 3-17). In contrast, another small stream system, Breakneck Creek, contains little of the recent flood plain fill; T2 fill and alluvial fan fill dominate (Fig. 35). This system therefore has an appreciably higher percentage of older fill than Onemile Creek. A larger system, Pumphouse Creek, has little flood plain fill and is dominated by T1 and T2 fill (Fig. 36). Upper and lower Forsyth Creek is dominated by T2 fill and large alluvial fans (Fig. 37). The large body of T2 fill in lower Forsyth Creek (at its confluence with Threemile Creek) contains, as noted above, evidence of an apparent heavy concentration of late Paleoindian and early Archaic cultural activity. The largest stream system studied on the installation (other than the Kansas and Republican Rivers), Wildcat Creek, is split into four separate 3-D images (Fig. 38). Upper Wildcat Creek is dominated by alluvial fans and by T2 fill (Fig. 39). The alluvial fans have determined the course of the meander plain by serving to deflect the channel toward the opposite valley wall. The Little Arkansas Creek also has been dominated and controlled by alluvial fan development and growth, a process that has probably persisted for the last 20,000 years or more, as evidenced from the radiocarbon ages determined from fan fill (Fig. 39). The middle reach of Wildcat Creek is similarly dominated by T2 fill and to a lesser extent by alluvial fans (Fig. 40), as is the lower part of Wildcat Creek (Fig. 40).
Figure 34--Onemile Creek in 3-D imaging.
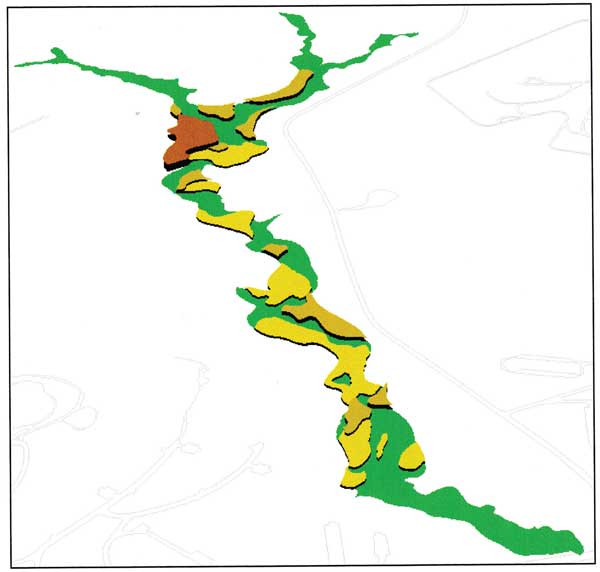
Figure 35--Breakneck Creek in 3-D imaging.
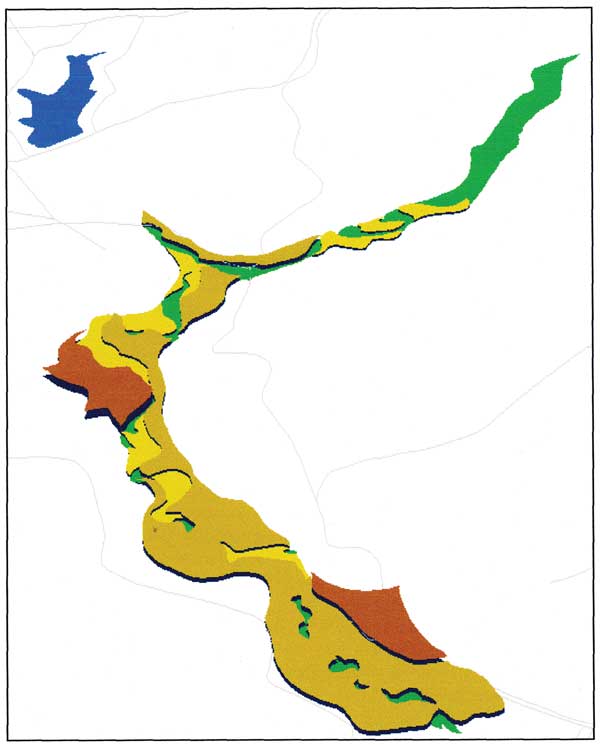
Figure 36--Pumphouse Creek in 3-D imaging; A is upper, B is lower part of creek.
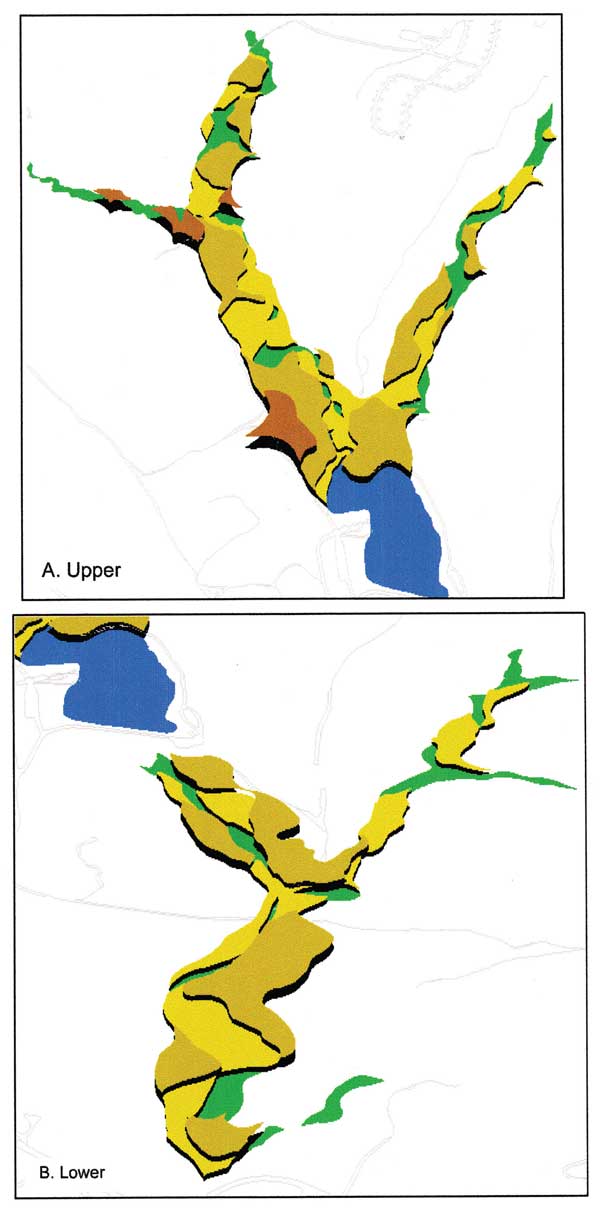
Figure 37--Forsyth Creek in 3-D imaging; A is upper, B is lower part of creek.
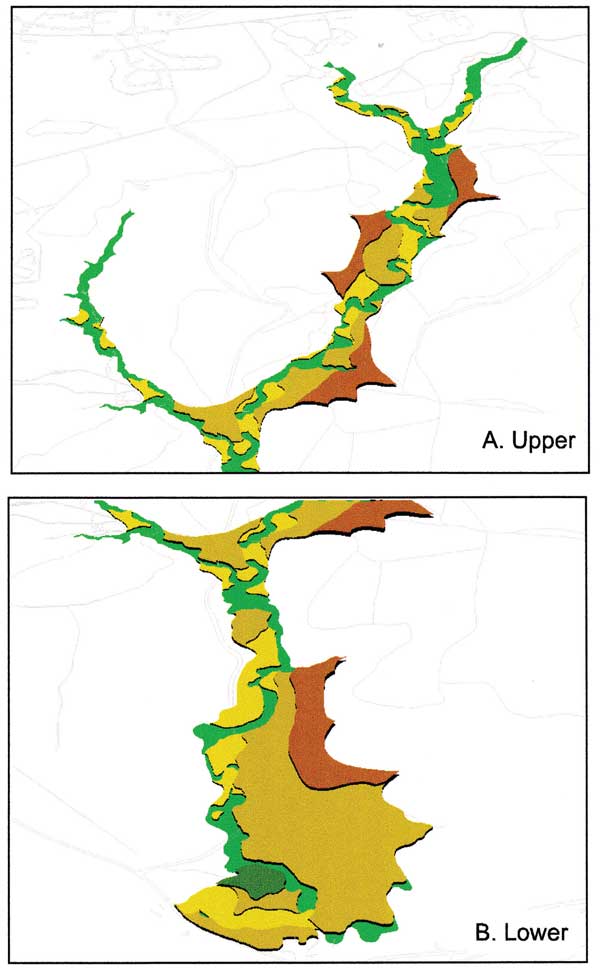
Figure 38--Wildcat Creek in 3-D imaging; A is upper, B is Little Arkansas, C is middle, and D is lower.
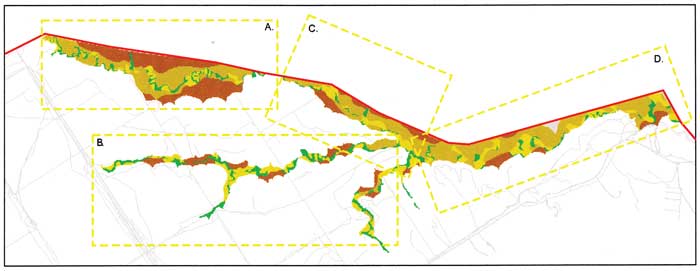
Figure 39--3-D imaging; A is Upper Wildcat Creek and B is Little Arkansas Creek.
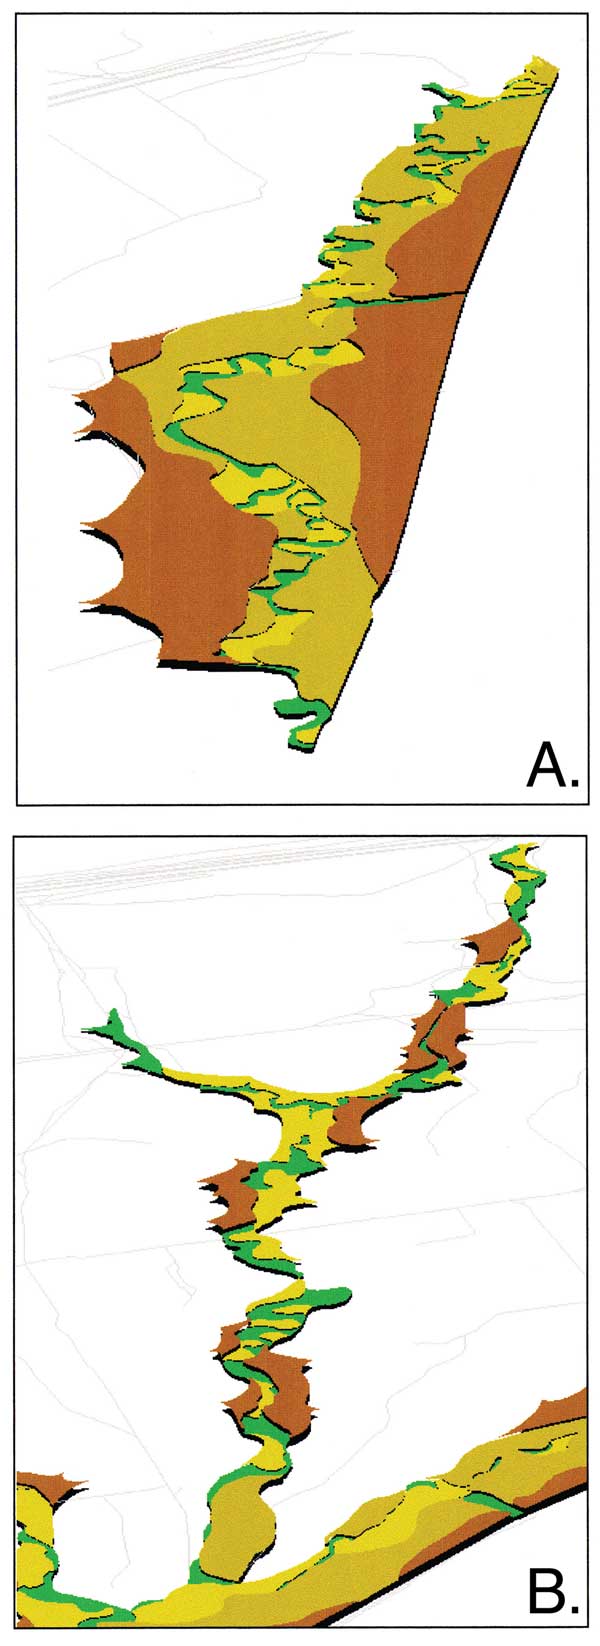
Figure 40--3-D imaging; C is Middle Wildcat Creek and D is Lower Wildcat Creek.
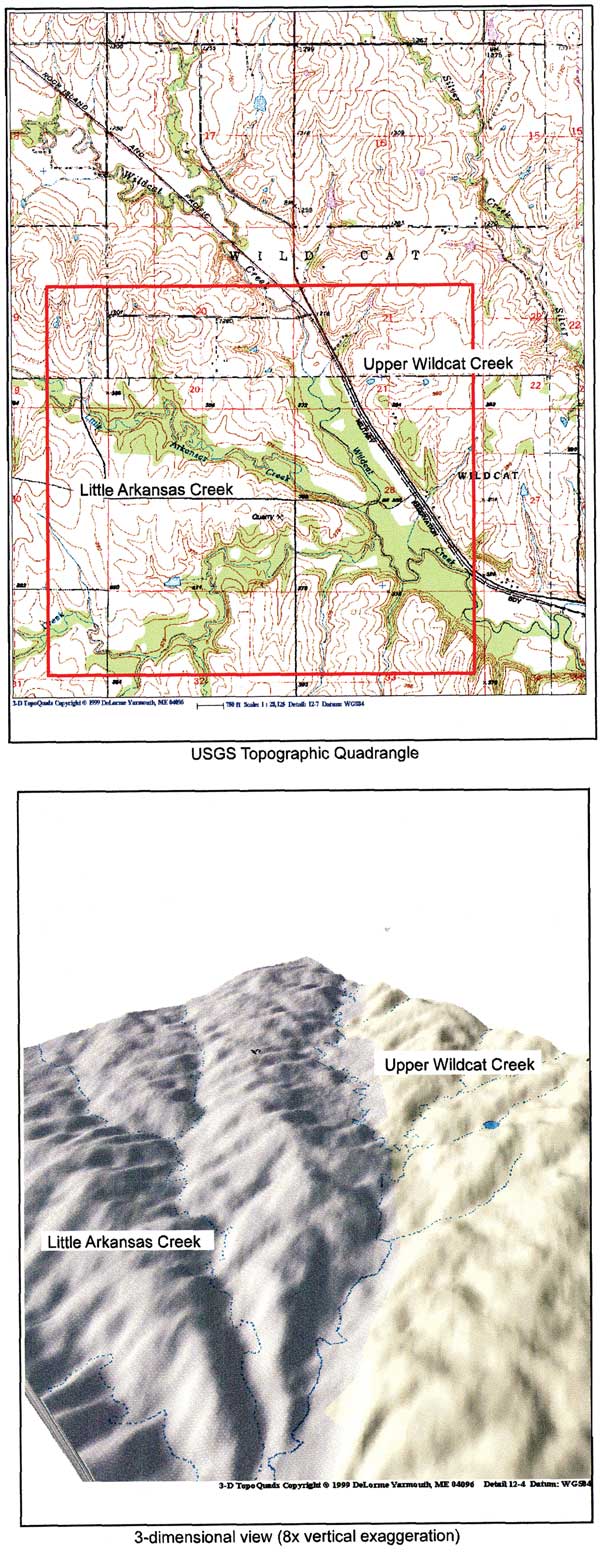
Low-oblique, three-dimensional imaging effects provide a perspective on the stream basins as a whole, rather than only on the valley fills as in figures above. The isolated, high-gradient nature of Pumphouse Creek gives it a canyon-like setting (Fig. 41), which would likely have been attractive to aboriginal peoples due to the microenvironment and seclusion, but yet proximity to the Kansas River valley and it associated resources. Forsyth Creek basin would have provided the same attributes as Pumphouse Creek basin, but would have afforded the opportunity for cultivation of its wide valley bottom and gentle side slopes (Fig. 42). The many cultural resources and travel corridor that Wildcat Creek provided aboriginals is apparent (Figs. 43, 44). In addition, it possesses the major and minor tributary valleys, which offer seclusion and other unique attributes.
Figure 41--3-D imaging of drainage basins shown with topographic view; Pumphouse Creek.
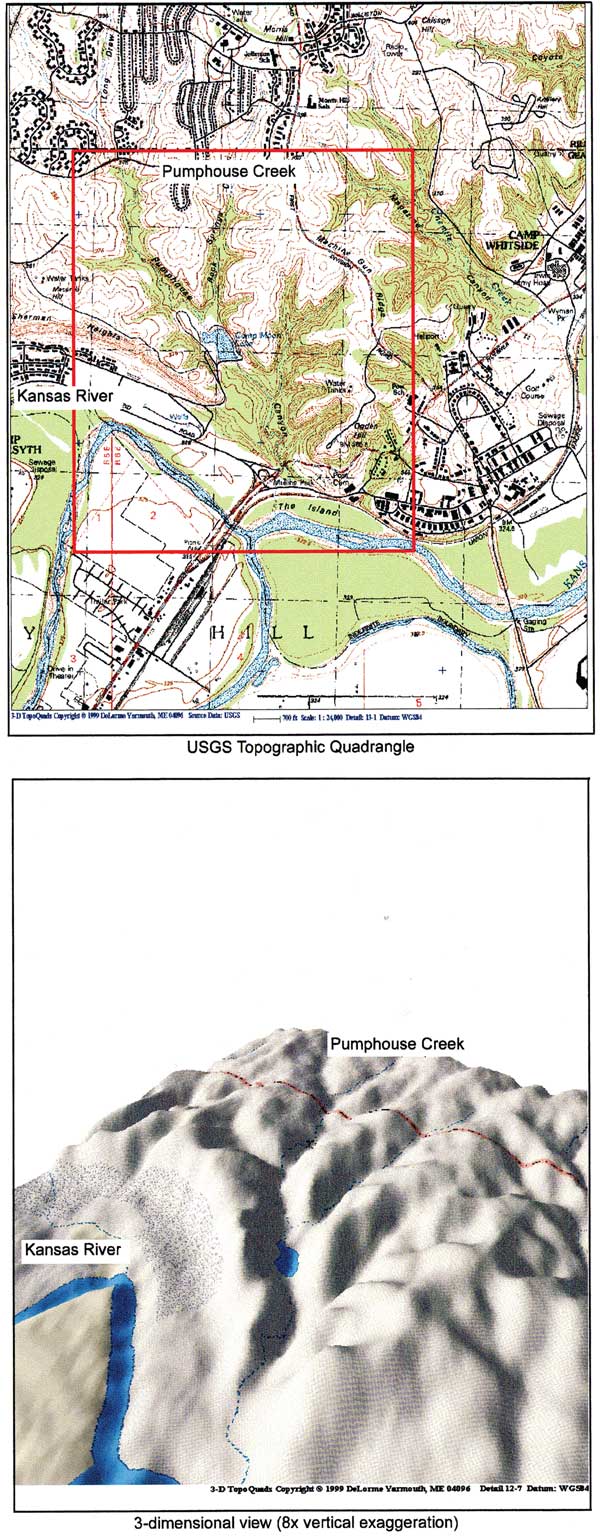
Figure 42--3-D imaging of drainage basins shown with topographic view; Forsyth Creek.
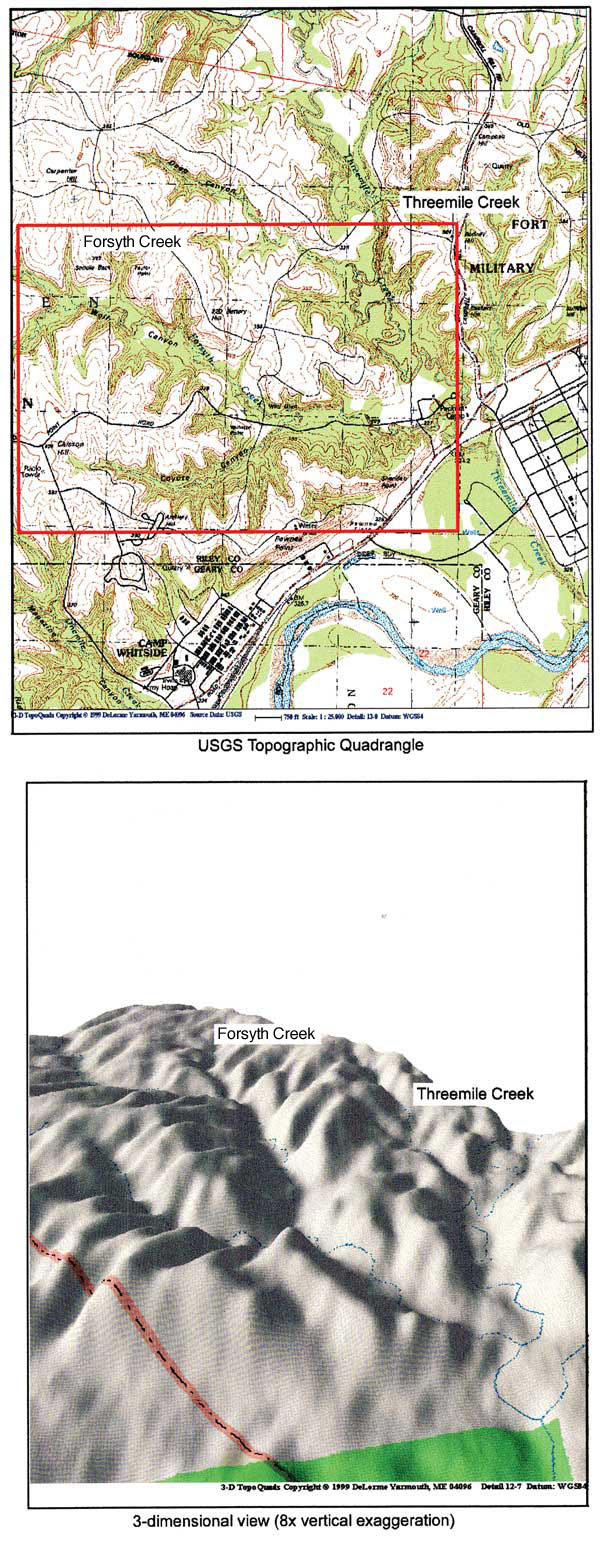
Figure 43--3-D imaging of drainage basins shown with topographic view; Wildcat Creek.
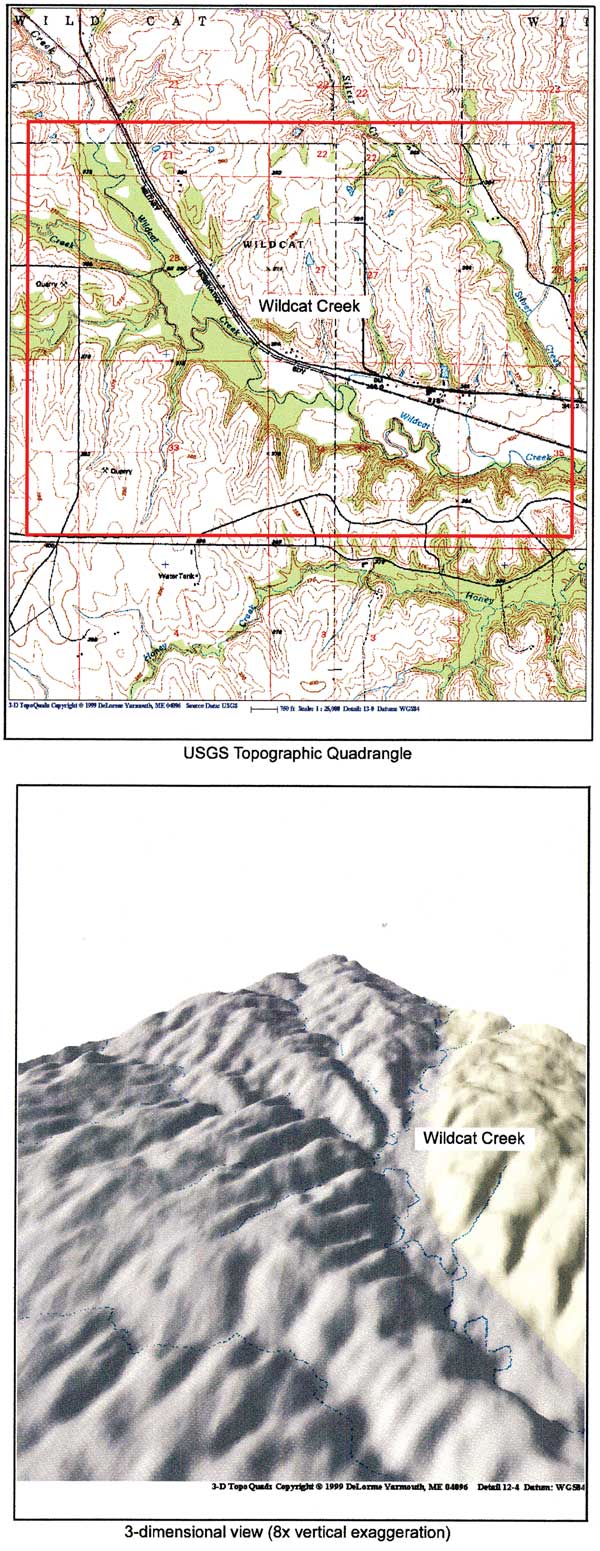
Figure 44--3-D imaging of drainage basins shown with topographic view; Upper Wildcat Creek and Little Arkansas Creek.
Previous page--Methods || Next page--Conclusions, References
Kansas Geological Survey
Placed online March 7, 2012; originally released June 2000
Comments to webadmin@kgs.ku.edu
The URL for this page is http://www.kgs.ku.edu/Hydro/Publications/2000/OFR00_65/03_results.html