
Kansas Oil and Gas Production Trends
by Timothy R. Carr
KGS Open File Report 1994-11
Over the past quarter century the Kansas oil and gas industry has been subjected to capricious changes in federal government regulations and to sudden price shocks due to changes in the global supply and demand for hydrocarbons. The Kansas industry, its customers, and state and local governments have had to respond to these external pressures by altering supply and consumption patterns. The march of events has forced the Kansas oil and gas industry to meet these challenges or to become extinct. To many both in the general public and to a lesser extent in our state and local government, the present and future importance of the oil and gas industry to Kansas and the general economy are not generally appreciated.
The death of the oil and gas industry in Kansas has been greatly exaggerated. It remains one of the largest industries in the state, and one of the largest sources of tax revenue for both state and local government. I have attempted to put together a picture of the large scale historical trends within the context of the conditions that affect the Kansas oil and gas industry. The presentation is built-on figures generated from either Kansas Geological Survey databases or from published sources such as the Energy Information Agency of the US Department of Energy. There are any number of points that can be derived from a given figure or set of data. Most are probably obvious to readers of this bulletin. However, I hope to provide some useful information that can be used in those conversations that habitually come up with those outside the oil and gas industry.
Comments like:
"I didn't know that Kansas had an oil and gas industry";
and
"The oil and gas industry is no longer an important component of the Kansas economy";
are all too common to people outside the oil and gas industry. These public perceptions need to be met with a few pertinent facts and figures.
What is the value of oil and gas production to Kansas?
Estimates from the US Department of Energy (DOE) put Kansas production at just over 53 million barrels of oil and 658 BCF of gas in 1992. Estimates for 1993 are that oil production continued to decline. Annual production was just over 50 million barrels (a 6.7% decline from 1992). Gas production increased with estimated annual production of approximately 679 BCF (+3.2%). Using estimated 1993 average prices for oil ($16.50 barrel) and gas ($1.95) in Kansas, the value of the oil and gas produced in Kansas is 2.15 billion dollars--a large number that even the late Senator Dirkson would consider in the range of "real money".
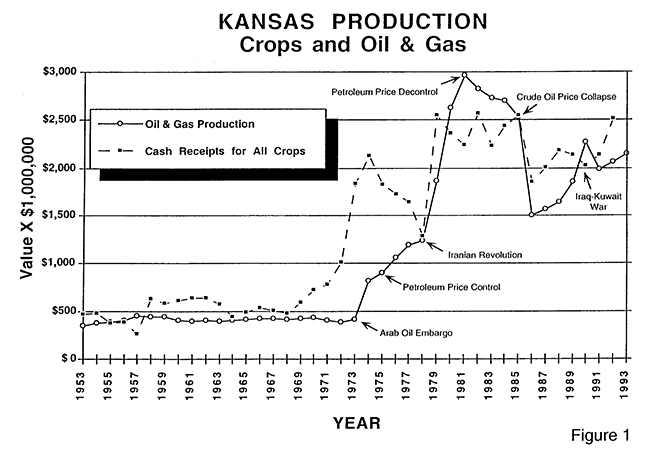
Personally, I have problems comprehending monetary values that are slightly bigger than my annual salary. The significance of Kansas oil and gas production relative to other parts of the Kansas economy can be illustrated by comparing the value of oil and gas production to a product that is perceived as central to the Kansas economy (i.e., the value of all the crops produced in the state). Over the past decade, the value of Kansas oil and gas production is comparable to the value of total statewide crop production as measured by the cash receipts for all the crops produced in the state (Figure 1). In a number of years, the value of oil and gas has exceeded the value of Kansas crop production. It may be a fortuitous relationship, but it also appears that since the energy shocks of the late 70's the value of oil and gas and the value of the cash receipts for all crops produced in the state have move in parallel.
How Important is oil versus gas production in Kansas?
Both oil and gas are important to the health of the Kansas economy. However, 1992 was significant to the history of Kansas oil and gas production. In 1992, the value of the gas produced in the state exceeded the value of oil for the first time (Figure 2). In 1993, Kansas oil prices and production decreased while gas prices and production increased (Figure 3). This combination had an obvious effect of increasing the difference in value between oil and gas to over 500 million dollars. If current trends in price and production continue through the remainder of 1994, the value of gas production in Kansas will be double the value of the oil produced.
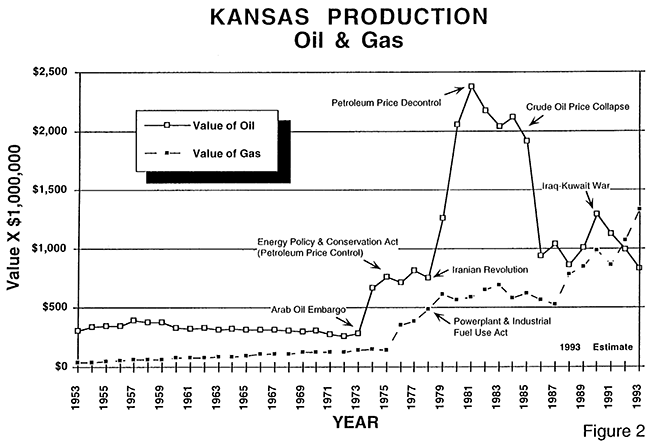
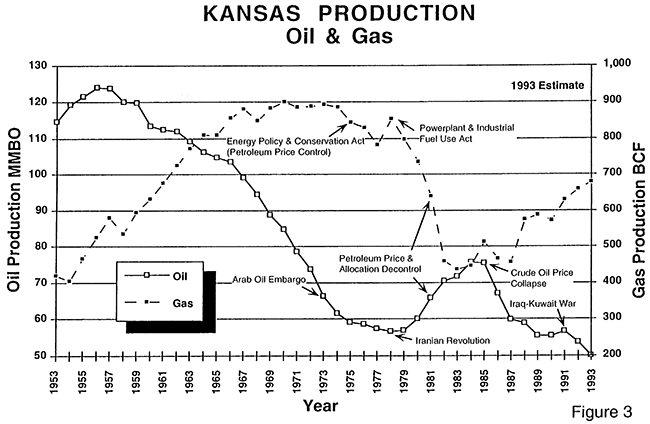
An examination of the historical record of oil and gas production shows the effects of changes in government policy and global supply perturbations (figures 2 and 3). Kansas oil production peaked in 1956 at over 124 million barrels per year, and has declined at an average annual rate of 2.5% to the present production of just over 50 million barrels per year. The oil boom of the early 80's and a modest increase in 1991 appear as anomalies to this long term trend. The effects of the supply disruptions (e.g., the Arab oil embargo, the Iranian revolution and even the Iraq-Kuwait war) are evident in both the value and quantity of oil production. What is also evident is the affect of government policies (e.g., the Energy Petroleum Allocation Act of 1973, the Energy Policy and Conservation Act of 1975, the Power Plant and Industrial Fuel Use Act of 1978 and the Price and Allocation Decontrol in 1981). These changes in government policy have had drastic effects on the production trends for both oil and gas in Kansas. The dramatic decrease in gas production during the 70's from 900 BCF per year to less than 450 BCF per year appears to be directly related to market distortions resulting from federal government policies. Subsequent decontrol (1981) of prices, allocations, and uses of fuels have permitted fuel switching based on economic criteria, and appear to have resulted in recovery of Kansas gas production to its present rate of slightly less than 700 BCF per year (Figure 3).
How important are oil and gas production to state and county tax revenues?
In fiscal year 1993, severance taxes amounted to over 98 million dollars with just under 92 million dollars going directly into state coffers with the remainder passed on to the counties. Severance tax is a very significant component of state tax revenue (fifth largest source of revenue). Oil and gas production also contribute to state revenues through income tax on the nearly 1,000 companies based in Kansas, the 7,100 Kansas citizens employed in the industry, and on the numerous royalty owners. Estimated 1993 payroll for those involved in oil and gas extraction was over 285 million dollars while royalty income to owners of mineral rights was approximately 262 million dollars. The direct contribution of severance, and income taxes on payroll and royalties amount to approximately 5% of total state revenue in fiscal 1993. This percentage of total state revenue has remained fairly constant over the years except for the oil boom years of 84 through 86. While this amount of revenue is significant to the fiscal health of state government it does not consider the probably even greater contribution of other taxes that result from the activity of the oil and gas industry in Kansas. These include indirect taxes on the goods and services purchased by the oil and gas industry, and the taxes generated by the downstream oil and gas industry (e.g., refining and distribution, and manufacture of hydrocarbon based commodities as plastics and fertilizer).
In respect to the severance tax, there has been a significant change in the relative contribution of oil and gas to tax revenues. In fiscal 1984, the first full year the severance tax was in place, a total of 112 million dollars was generated. Over 62% of the revenue came from oil production. In fiscal 93, over 73% of the severance tax revenue came from gas production. The change in relative importance of oil and gas is the result of changes in production, prices, and amount of production exempted from severance. The result is that state tax revenues from the severance tax are much more dependent on gas prices and rate. As far as severance tax revenues, the decrease resulting from the oil price decreases of the last few months have probably been more than offset by the increased revenue generated from the higher gas prices and rates.
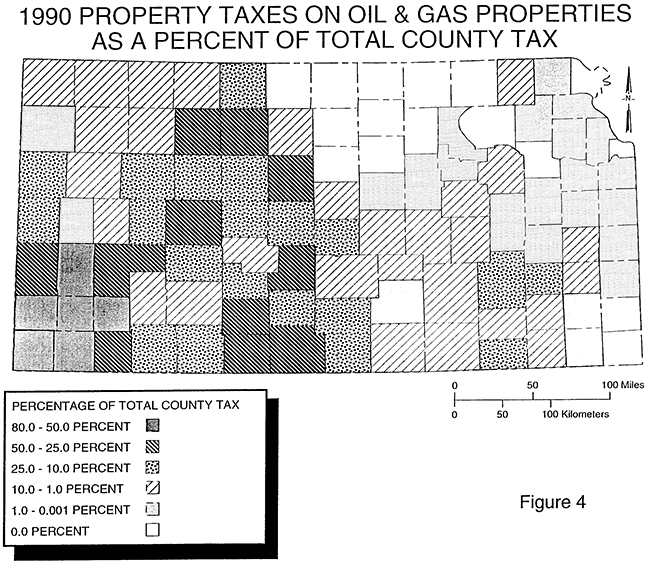
At the county government level the oil and gas industry is a major source of property taxes. On the basis of on 1990 data, 37 of 105 counties derive at least 10% of their tax revenues from oil and gas properties (Figure 4). The percentage ranges to a high of 80% with at least six counties obtaining more than 50% of their revenues from taxes on oil and gas properties. All six of these counties are located in southwestern Kansas.
It should be fairly evident that the oil and gas industry is one of the important "contributors" to the fiscal health of our state local government.
What are the important stratigraphic horizons that produca oil and gas In Kansas?
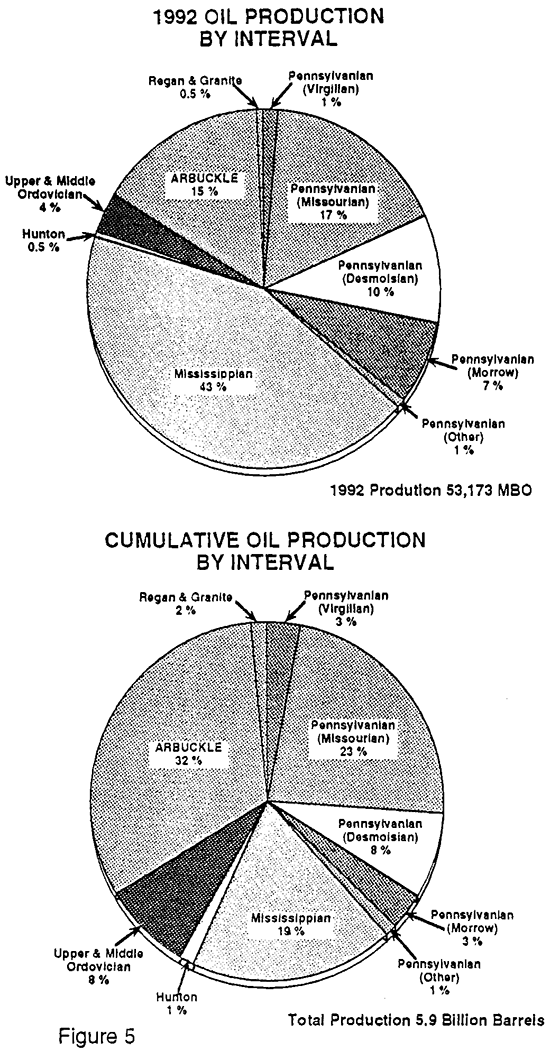
Of the approximately 5.9 billion barrels of cumulative oil production reported from Kansas, the Ordovician Arbuckle Group accounts for approximately a third of cumulative production (Figure 5). The Arbuckle is followed in descending order by the various units assigned to the Missourian (Lansing-Kansas City), and the Mississippian. Taken together these three intervals account for just shy of three-quarters of the state's cumulative oil production since the initial oil flowed in 1889. A look at the stratigraphic distribution of oil production in 1992 shows a decrease in the dominance of oil production from the Arbuckle interval. The percentage of both Mississippian and Morrow oil production has doubled, while the contribution of Arbuckle production has halved. Together the Mississippian and the Morrow intervals account for approximately 50 percent of the 53 million barrels produced in the state during 1992. This change in the stratigraphic distribution of oil production is the result of a number of new Morrow and Mississippian fields and extensions in the Hugoton embayment of southwestern Kansas. Recent discoveries such as Big Bow (1989 discovery) located in Grant and Stanton counties and Lahey (1989 discovery) located in Stevens County are now among the top 20 fields ranked by annual production (Table 1b). A comparison of the twenty largest fields by cumulative and annual production (1992) shows the decreased in dominance of the older Arbuckle production of the central Kansas uplift and the increased importance of production from the younger Paleozoic interval of the Hugoton embayment (Tables 1a and b). This trend is even more dramatically illustrated by the stratigraphic and geographic distribution of the twenty fields that showed the biggest year-to-year increase in production (Table 1c). With only a few notable exceptions these new and expanding fields are located in southwestern Kansas.
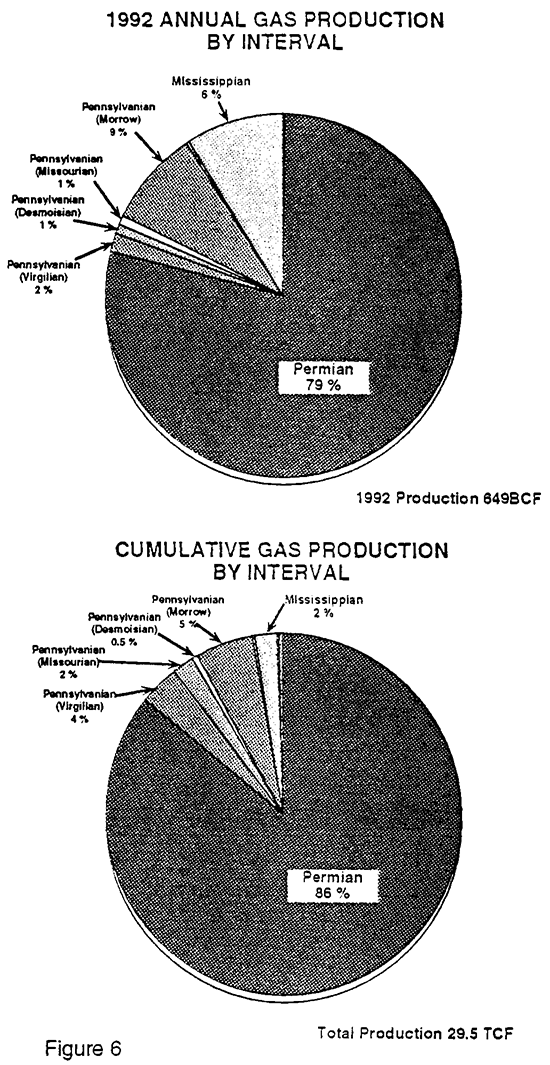
Gas production on both a cumulative and an annual basis is dominated by the Permian interval. Over 86% of the cumulative 30 TCF and 79% of the annual 679 BCF of gas production comes from the Permian (primarily Chase and Council Grove groups; Figure 6). Two fields located in southwestern Kansas, the Hugoton (Chase Group) and the Panoma (Council Grove Group), account for 55% and 15% of the state's 1992 annual production. However, gas production as percentage of annual production from both the Morrow and Mississippian intervals has increased significantly as compared to the percentage of cumulative production. As with oil this increase in the percentage of Mississippian and Morrow gas production reflects exploration beneath and around the margins of the Hugoton embayment.
What is the geographic distribution of oil and gas production in Kansas?
The stratigraphic distribution of oil and gas has a strong influence on the geographic distribution of production. Oil production is distributed throughout the geologic column and as a result is scattered through the state. In 1992, at least some oil production was reported from 88 counties This is a decrease from the 91 counties that reported production in 1991. The top ten counties ranked on 1992 production produced just over 44% of annual oil production. These counties were scattered throughout the state, occurring on the Central Kansas uplift (Ellis, Russell, Rooks, Barton, Stafford, and Graham), the Nemaha uplift (Butler), and the Hugoton embayment (Finney, Ness, and Haskell). However, the counties showing the biggest 91 to 92 increase in production tend to be concentrated in western Kansas, within and along the margins of the Hugoton embayment. The largest year to year increase was reported in Stevens County (209 MBO), followed in descending order by Ness, Comanche, Finney, and Stanton counties. The increase can be attributed to the recent discoveries coming into full production (e.g., Lahey and Big Bow fields, and the other fields listed in Table 1c). The largest year-to-year decreases in production by county were concentrated along the Central Kansas uplift, with Barton County recording the biggest drop (258 MBO). Barton County was followed in diminishing magnitude of production decrease by Sheridan, Graham, Kearny, and Rawlins counties.
The bulk of Kansas gas production is concentrated in the Permian interval of the Hugoton embayment. The result is that the nine counties in the extreme southwestern corner of the state account for over 87% of annual production. In recent years the concentration of Kansas gas production from this small number of counties has increased as production has increased from the Hugoton and associated fields. In 1992, gas production from the Hugoton field increased to 364 bcf/year from 329 bet in 1991 (10%). Production increased another 10% in 1993 to about 400 bet. The recent changes in state proration rules for the Hugoton should continue to spur additional production. On a county basis, the biggest year-to-year increase was reported from Haskell County (11 BCF). The largest year-to-year decrease in production was recorded from Seward County (3 BCF).
What is happening in Kansas oil and gas production?
The short answer is, that as usual things, are changing. Gas production has increased steadily over the last decade. This increase in production coupled with stronger gas prices, decreased oil production, and weaker oil prices have resulted in gas surpassing oil in terms of value and tax revenues for the state. The increased concentration of oil and especially gas production in Hugoton embayment and adjoining areas of southwestern Kansas appears to be continuing. Oil production from the lower Paleozoic rocks of the Central Kansas uplift continues to decline. Increased oil production from new fields appears to be concentrated in the upper Paleozoic horizons beneath and along the margins of the Hugoton Gas Field. Gas production continues to be dominated by production from the Permian intervals of southwestern Kansas.
What remains constant is that the oil and gas industry of Kansas continues to respond to the challenges of the international marketplace and government policy. The oil and gas industry remains, as it has from the late 1800's, an important component of the Kansas economy and way of life.
Tables
Table 1a--Twenty largest Kansas oil fields by cumulative production through 1992. Together these twenty fields have produced over 2.1 billion barrels of oil. Approximately 36% of the states total cumulative oil production. A total of 5,944 fields have been named in Kansas as of the end of 1992. Data from Doug Beene of the Kansas Geological Survey.
| Rank | Field Name |
Disc. Year |
Cumulative Production |
Producing Wells 1992 |
Counties | Producing Horizons |
|---|---|---|---|---|---|---|
| 1 | El Dorado | (1915) | 296,899,340 | 709 | Butler | Arb. et al. |
| 2 | Chase-Silica | (1930) | 270,056,844 | 922 | Barton, Rice, Stafford | Arb.-LKC |
| 3 | Bemis-Shutts | (1928) | 245,181,170 | 806 | Rock, Ellis | Arb. |
| 4 | Trapp | (1929) | 230,664,685 | 829 | Barton, Russell | Arb. et al. |
| 5 | Hall-Gurney | (1931) | 149,779,350 | 1009 | Barton, Russell | LKC et al. |
| 6 | Kraft-Pursa | (1937) | 131,504,343 | 505 | Barton, Ellsworth, Russell | Arb. et al. |
| 7 | Gorham | (1926) | 93,822,268 | 427 | Russell | Arb. et al. |
| 8 | Genesco-Edwards | (1934) | 85,339,827 | 198 | Ellsworth, Rice | Arb. et al. |
| 9 | Burrton | (1931) | 76,309,225 | 341 | Harvey, Reno | Miss., Arb. |
| 10 | Ritz-Canton | (1929) | 72,667,067 | 379 | McPherson | Simpson et al. |
| 11 | Spivey-Grabs | (1949) | 66,237,466 | 705 | Harper, Kingman | Miss. |
| 12 | Fairport | (1923) | 57,196,973 | 395 | Ellis, Russell | Arb. et al. |
| 13 | Bloomer | (1937) | 53,984,056 | 153 | Barton, Ellsworth, Rice | Arb., LKC |
| 14 | Stoltenberg | (1931) | 53,070,356 | 206 | Barton, Ellsworth | Arb. et al. |
| 15 | Ray | (1940) | 47,471,389 | 161 | Rooks, Graham, Norton | Arb. et al. |
| 16 | Augusta | (1914) | 47,384,537 | 138 | Butler | Arb. et al. |
| 17 | Morel | (1938) | 46,030,918 | 173 | Graham | Arb. et al. |
| 18 | Zenith-Peace Ck. | (1937) | 44,875,702 | 66 | Reno, Stafford | Miss., Arb |
| 19 | Welch-Bornholdt | (1924) | 42,235,098 | 182 | McPherson, Rice | Miss, LKC et al. |
| 20 | Marcotte | (1944) | 40,950,356 | 228 | Rooks | Arb. et al. |
Table 1b--Twenty largest Kansas oil fields ranked by 1992 annual production. Together these twenty fields produced almost 12 million barrels of oil in 1992. Approximately 22% of the states total annual production. An additional 2,359 fields reported oil production during 1992. Data from Doug Beene of the Kansas Geological Survey.
| Rank | Field Name |
Disc. Year |
Annual Production |
Producing Wells 1992 |
Counties | Producing Horizons |
|---|---|---|---|---|---|---|
| 1 | Bemis-Shutts | (1928) | 1,157,245 | 806 | Ellis, Rooks | Arb. |
| 2 | Hall-Gurney | (1931) | 958,046 | 1009 | Barton, Russell | LKC et al. |
| 3 | Trapp | (1929) | 944,310 | 829 | Barton, Russell | Arb. et al. |
| 4 | Chase-Silica | (1930) | 886,623 | 922 | Barton, Rice, Stafford | Arb.-LKC |
| 5 | Big Bow | (1989) | 884,388 | 12 | Grant, Stanton | Miss. |
| 6 | El Dorado | (1915) | 808,534 | 709 | Butler | Arb. et al. |
| 7 | Spivey-Grabs | (1949) | 654,180 | 705 | Harper, Kingman | Miss. |
| 8 | Stewart | (1952) | 623,066 | 30 | Finney | Morrow, Miss. |
| 9 | Fairport | (1923) | 551,477 | 395 | Ellis, Russell | Arb. et al. |
| 10 | Kraft-Pursa | (1937) | 448,654 | 505 | Barton, Ellsworth, Russell | Arb. et al. |
| 11 | Burrton | (1931 ) | 438,077 | 341 | Harvey, Reno | Miss., Arb. |
| 12 | Lahey | (1989) | 435,739 | 9 | Stevens | Morrow, Miss. |
| 13 | Paola-Rantoul | (1918) | 421,768 | 999 | Franklin, Johnson, Miami | Cher. et al. |
| 14 | Damme | (1951) | 381,126 | 154 | Finney | Miss. |
| 15 | Gorham | (1926) | 361,435 | 427 | Russell | Arb. et al. |
| 16 | Lemon NE | (1965) | 353,194 | 27 | Haskell | LKC et al. |
| 17 | Eubank | (1958) | 347,689 | 66 | Haskell | Miss. et al. |
| 18 | Pleasant Praire | (1954) | 309,287 | 95 | Finney, Haskell, Kearney | Miss. et al. |
| 19 | Riffe | (1951) | 280,066 | 114 | Rooks | LKC |
| 20 | Ray | (1940) | 285,342 | 161 | Rooks, Graham, Norton | Arb. et al. |
Table 1c--Twenty largest Kansas oil fields ranked by increase in annual production (1991-1992). Data from Doug Beene of the Kansas Geological Survey.
| Rank | Field Name |
Disc. Year |
Change in Production |
Producing Wells 1992 |
Counties | Producing Horizons |
|---|---|---|---|---|---|---|
| 1 | Lahey | (1989) | 253,103 | 9 | Stevens | Morrow, Miss. |
| 2 | Terry | (1991) | 251,747 | 7 | Finney | Miss. |
| 3 | Stirrup | (1987) | 146,980 | 7 | Morton | Morrow |
| 4 | Val Jean | (1965) | 114,315 | 8 | Ness | Miss., Marm. |
| 5 | Lemon NE | (1965) | 110,425 | 27 | Haskell | LKC et al. |
| 6 | Amazon Ditch E. | (1991) | 95,662 | 8 | Finney | Miss. et al. |
| 7 | Hick | (1959/1989) | 82,009 | 16 | Grant, Stevens | Miss. |
| 8 | Arroyo | (1990) | 74,266 | 8 | Stanton | Morrow |
| 9 | Box Ranch | (1988) | 68,412 | 14 | Comanche | Arb., Viola, Miss. |
| 10 | Cook NW | (1991) | 60,628 | 8 | Logan | LKC, Cherokee |
| 11 | Blue Bell NW | (1954/1971) | 57,358 | 5 | Seward | Miss. et al. |
| 12 | Prafford | (1983) | 56,211 | 5 | Pratt, Stafford | Miss. |
| 13 | Cutter SE | (1986) | 54,539 | 6 | Seward | Miss. et al, |
| 14 | Schumacher N. | (1992) | 52,119 | 3 | Comanche | Arb. et al. |
| 15 | Brownell S. | (1985) | 49,468 | 4 | Ness | Cherokee |
| 16 | Brownell SE | (1988) | 48,891 | 8 | Ness | Cherokee |
| 17 | Cutter E | (1987) | 45,213 | 6 | Seward | Morrow |
| 18 | White Woman E | (1963) | 40,501 | 2 | Kearney, Wichita | Marm. |
| 19 | Seeley-Wick | (1921/1975) | 38,292 | 303 | Greenwood, Lyon | Cher., Miss., Viola |
| 20 | Adell NW | (1952) | 37,412 | 13 | Decatur | LKC |