Kansas Geological Survey, Subsurface Geology 12, p. 25-26
by
F. W. Schroeder and S. M. Greenlee
Exxon Production Research Company
In a companion paper, Greenlee and Moore (this volume) describes the characteristics of the Middle and Upper Miocene depositional sequences within the Baltimore Canyon trough. This paper presents some basin-modeling results using a key, dip-oriented seismic section from this area. Our objectives were to evaluate several published sea-level curves and document that the sequence characteristics are attributable to the combined effects of slow basin subsidence and long-term eustatic fall.
Fig. 1 shows the procedure we use in performing a basin-modeling study. We begin with an interpreted cross section derived from well and/or seismic data. The geohistory technique is used to model basin subsidence and fill at individual locations. We ensure temporal consistency by displaying the basin's history as a function of time at each location. By combining the results of the one-dimensional analyses, we display restored cross sections for each correlated horizon. We use temporal and spatial consistency as constraints to refine the paleobathymetric interpretation and determine the thermotectonic component of subsidence. The final step is to simulate the development of one or more depositional sequences. Basin simulation allows us to investigate the way in which subsidence, sediment supply, and eustasy have interacted to produce the preserved stratigraphy.
Figure 1--Diagram of basic approach to basin modeling.
We modeled the Neogene sediments within the Baltimore Canyon trough because this area had a simple tectonic history during the Neogene and the available well and seismic data provide sufficient stratigraphic and paleontologic control. Thirteen sites and 22 horizons were modeled. Geohistory analyses ensured that our interpretation is both spatially and temporally consistent with the known geology. Simulated cross sections were generated using sea-level curves published by Haq et al. (1988), Greenlee and Moore (1988), Watts and Steckler (1979), and Kominz (1984). Each simulation covers the interval from the Early Miocene (18 Ma) to the present, using a time step of 0.2 m.y. Each simulation was evaluated as to how well it was able to replicate the interpreted stratigraphy (fig. 2).
Figure 2--A) Interpreted seismic line from Greenlee et al. (1988). Ages correspond to inflection points during sea-level falls. B) Simulated cross section using the sea-level curve of Greenlee and Moore (1988). The simulation began at 18 Ma and ran to the present using a time step of 0.2 Ma; ages correspond to changes from high-stand to low-stand deposition.
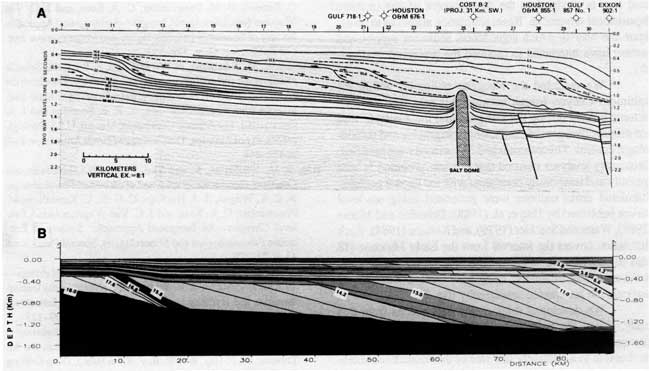
We developed three major conclusions from this study. First, the spectacular Neogene progradational sequences deposited within the Baltimore Canyon trough are attributable to a relatively low rate of thermotectonic subsidence coupled with a long-term sea-level fall. These two conditions led to the development of a small amount of shelfal accommodation relative to the volume of incoming sediment. Progradation rapidly moved the position of the shelf margin basinward.
The second conclusion is that a component of sea-level change with a period on the order of 1 m.y. is necessary to explain the Neogene stratigraphy within the Baltimore Canyon trough. Without this component, the simulations suggest extremely gradational facies changes which are contrary to observations. The third conclusion is that the sea-level curve proposed by Greenlee and Moore (1988) is better able to replicate the interpreted cross section than the Haq et al. (1988) curve.
Greenlee, S. M., and Moore, T. C., 1988, Recognition and interpretation of depositional sequences and calculation of sea-level changes from stratigraphic data--offshore New Jersey and Alabama Tertiary; in, Sea-level Changes--An Integrated Approach, C. K. Wilgus, B. S. Hastings, C. G. St. C. Kendall, H. M. Posamentier, C. A. Ross, and J. C. Van Wagoner (eds.): Society of Economic Paleontologists and Mineralogists, Special Publication 42, p. 329-353
Greenlee, S. M., Schroeder, F. W., and Vail, P. R., 1988, Seismic stratigraphic and geohistory analysis oftertiary strata from the continental shelf off New Jersey; calculation of eustatic fluctuations from stratigraphic data; in, The Atlantic Continental Margin, U.S., R. E. Sheridan and J. A. Grow (eds.): Geological Society of America, The Geology of North America, v. 1-2, p. 437-444
Haq, B. U., Hardenbol, J., and Vail, P. R., 1988, Mesozoic and Cenozoic chronostratigraphy and cycles of sea-level change; in, Sea-level Changes--An Integrated Approach, C. K. Wilgus, B. S. Hastings, C. G. St. C. Kendall, H. M. Posainentier, C. A. Ross, and J. C. Van Wagoner (eds.): Society of Economic Paleontologists and Mineralogists, Special Publication 42, p. 71-108
Kominz,M. A., 1984, Oceanic-ridge volumes and sea-level change--an error analysis; in, Interregional Unconformities and Hydrocarbon Accumulation, J. B. Schlee (ed.): American Association of Petroleum Geologists, Memoir 36, p. 109-127
Watts, A. B., and Steckler, M. S., 1979, Subsidence and eustasy at the continental margin of eastern North America; in, Deep Drilling Results in the Atlantic Ocean--Continental Margins and Paleoenvironments, M. Talwani, W. F. Hay, and W. B. F. Ryan (eds.): Maurice Ewing Series, v. 3, p. 219-234
Kansas Geological Survey
Comments to webadmin@kgs.ku.edu
Web version May 7, 2010. Original publication date 1989.
URL=http://www.kgs.ku.edu/Publications/Bulletins/Sub12/Schroeder/index.html