Kansas Geological Survey, Bulletin 82, pt. 2, originally published in 1949
Originally published in 1949 as part of Kansas Geological Survey Bulletin 82, pt. 2. This is, in general, the original text as published. The information has not been updated. This publication is also available as an Acrobat PDF file (700 kB).
Phosphate-bearing bituminous shales of Pennsylvanian age were sampled from Crawford, Bourbon, Franklin, Labette, and Wyandotte counties. Complete chemical analyses of the shales were made. Special analyses included the percentage of P2O5 soluble in citric acid, use of the spectrograph to determine trace elements present, and tests to determine the trace elements soluble in water. These analyses suggest that the phosphate and trace elements are present in quantities sufficient for the shales to merit evaluation as a source of agricultural fertilizer.
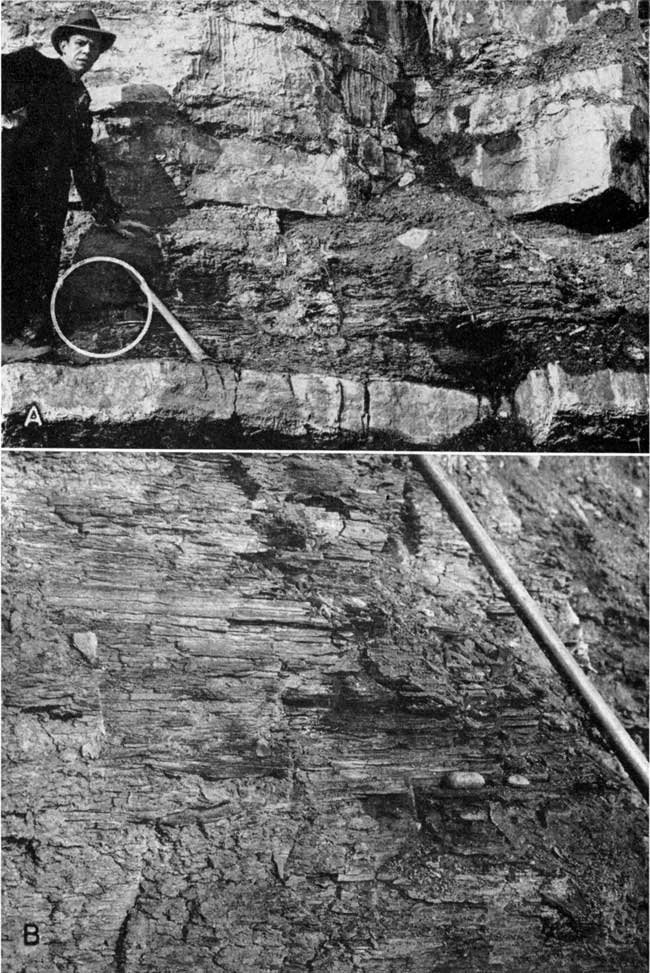
Plate 1--Exposure of Muncie Creek shale, sec. 12, T. 11 S., R. 24 E., Wyandotte County. B is a closeup view of area circled in A. (Photos by Roy Jindra.)
Sedimentary phosphate occurs in Kansas in the Pennsylvanian shales and limestones that crop out in the eastern one-third of the State. The present study was undertaken to determine possible utilization of the phosphate-bearing shales.
Phosphate occurs in nature in only a few forms and commonly it is found in the chemical combination known is orthophosphate. The mineral apatite, 3[Ca3(PO4)2].CaF2, is the most abundant source of phosphate in rocks of igneous or metamorphic origin. In sedimentary rocks the most common phosphate-bearing minerals are collophane, 3[Ca3(PO4)2].nCa(CO3,F,O).xH2O, which is a mineraloid, and dahllite, 3[Ca3(PO4)2].CaCO3. Collophane is the dominant mineral of fossil bones and often is the chief constituent of "Phosphorite" beds. Dahllite is secondary after collophane, and usually occurs with it.
The growing need of phosphate fertilizers has aroused much interest in the possibility of locating usable deposits of phosphate-bearing rocks. The "Phosphorite" beds in Idaho, Montana, Wyoming, Tennessee, and Florida are high-grade phosphate deposits which are processed, bagged, and shipped for long distances. If deposits with a reasonable percentage of P2O5 could be found to occur in Kansas they might be of value to our agricultural needs. It has been known for many years that many of the black shales in eastern Kansas contain phosphate nodules. The Oklahoma Geological Survey made a preliminary study of comparable shales in Oklahoma (Oakes, 1938) but low solubility, unfavorable locations, and other factors limited its recognition. Since 1946 the increasing demand for phosphate fertilizers suggested that the Kansas shales should be examined.
A reconnaissance field trip in September 1947 indicated that the Kansas City and Lansing groups merited study in Wyandotte and Johnson counties. After preliminary study of these deposits showed promise, the study was extended to cover shales of the Pleasanton, Marmaton, and Cherokee groups in Labette, Cherokee, Crawford, Neosho, Allen, and Bourbon counties. Miami, Anderson, and Linn counties have so far not been investigated due to lack of topographic situations that favor quarrying operations.
Early phases of the study demonstrated that only the bituminous shales contained enough phosphate to warrant consideration. Also a significant amount of potassium, magnesium, and iron as well as several other elements that might be beneficial in agricultural use were found to be disseminated through the shales beyond the limits of the phosphate nodules. Under certain soil conditions these nutrients may be deficient. Under these conditions an additional supply that could be added in the shales should prove beneficial (Dr. Harold Myers, personal communication).
Factors of the shales used to evaluate possible use as a fertilizer are (1) total phosphate and citric acid soluble phosphate, (2) quantity of shale available, and (3) location of shale deposits with reference to ease of mining and transportation. Several shales that contain relatively high percentages of phosphate are not judged good prospects because of excessive overburden, whereas other shale deposits with a lower P2O5 content are so readily accessible for quarrying operations that they were included in the study.
Attempts made in the laboratory to concentrate the phosphate content of the shales were not successful owing to uniformity of hardness, specific gravity, and shape of particles. Grinding followed by flotation produced no significant change in the distribution of the phosphate. Therefore, study of the possibility of utilizing the shale without processing other than pulverizing was made. All data presented in this paper are based on this type of treatment.
Thanks are expressed to Dr. H. E. Myers, Head, Department of Agronomy, Kansas State College, for review of these data. Under his supervision the Department of Agronomy at Kansas State College is conducting field and greenhouse tests to determine the benefits to plant growth by application of this phosphatic shale. Part of this work is being done by Mr. R. F. Randle, Jr.
Samples were collected in the field from natural outcrops and road cuts. Approximately 50 pounds of shale was taken as composite or channel samples of the exposed thickness of shale at each locality. In some places a few pounds of nodules were selectively collected from the outcrop for independent study. Mr. Bert Ross who operates a quarry at Ottawa, Kansas, obtained samples of the Eudora shale by catching the pulverized material blown out by a pneumatic drill. A sample of the Little Osage shale was obtained by pneumatic drilling by Mr. John Stark, Girard, Kansas. Shales above the various coal beds in Crawford and Cherokee counties were sampled by W. B. Howe. Locations of the shales sampled are given in Table 1.
Table 1--Description of localities where phosphate-bearing shale was sampled.
| Lab. No. | County | Location | Stratigraphic horizon |
Thickness of bed, feet |
Type of Sample |
|---|---|---|---|---|---|
| 48-98 | Wyandotte | 12-11-24E | Muncie Creek shale | 3 | Composite upper part |
| 48-99 | Wyandotte | 12-11-24E | Quivira shale | 3 | Lower half-- composite |
| 48-219 | Labette | SE 17-32-19E | Pleasanton shale | 29 | Spot 15 ft. from top |
| 48-220 | Labette | NE 16-33-21E | Little Anna shale | 2 | Composite |
| 48-224 | Labette | SE 17-32-19E | Pleasanton shale | 29 | Top 6 ft. of 12 ft. 18 ft. from top |
| 48-295 | Crawford | SE 12-30-22E Stark Quarry | Little Osage shale | - | Composite |
| 48-296 | Crawford | SW SW 34-38-25E | Shale above Croweburg coal | 4 | Composite |
| 48-297 | Bourbon | SW SE 18-27-25E | Shale above Bevier coal | 6 | Composite |
| 48-298 | Bourbon | NE NW 27-26-25E | Shale above Mulky coal | 2 | Composite |
| 48-311 | Franklin | SW SW 6-17-19E Ross Quarry | Eudora shale | 8 | Composite |
| 49-173 | Labette | SE 17-32-19E | Pleasanton shale | 29 | 16 in. below 48-224 |
| 49-174 | Labette | SE 17-32-19E | Pleasanton shale | 29 | 10 in. below 49-173 |
Table 2--Size distribution of shales ground in pan mill.
| Mesh | 48-98 | 48-99 | 48-224 | 48-298 | ||||
|---|---|---|---|---|---|---|---|---|
| Percent | Cumulative Percent |
Percent | Cumulative Percent |
Percent | Cumulative Percent |
Percent | Cumulative Percent |
|
| 24 | 38.69 | 38.69 | 33.18 | 33.18 | 37.07 | 37.07 | 35.65 | 35.65 |
| 60 | 19.63 | 58.32 | 24.72 | 57.90 | 23.47 | 60.54 | 23.84 | 59.49 |
| 100 | 10.14 | 68.46 | 11.67 | 69.57 | 16.66 | 77.20 | 10.40 | 69.89 |
| 200 | 14.23 | 9.27 | 13.01 | 12.16 | ||||
| Pan | 16.87 | 20.39 | 9.30 | 17.79 | ||||
The field samples were crushed in a pan mill after being air dried. The shale was pulverized in the mill until small aggregates began to form. Previous experience in grinding these bituminous shales had proven that further mechanical grinding was useless. The laboratory sample was secured by repeated splitting until about 100 grams remained. This was further ground by hand until it would pass on 80 mesh sieve. The samples being used by Kansas State College for field and greenhouse tests were treated only by grinding in the pan mill. The size distribution of the shales crushed by the pan mill is shown in Table 2.
Phosphate--The percentage of P2O5 soluble in citric acid was determined by agitating 5 grams of shale in 500 cubic centimeters of 2 percent citric acid for 30 minutes. The shale was then filtered off and the P2O5 content of the filtrate determined. Total P2O5 was determined by leaching a 0.5 to 2.0 gram sample in 10 percent nitric acid, filtering, and retaining the filtrate. The remainder of the analyses for both citric acid soluble and total P2O5 was done by standard methods. The 2 percent citric acid soluble method is the method used by the Association of Official Agricultural Chemists (Lepper, et al., 1945) for determination of P2O5 content in open-hearth slags. This method was selected as an empirical test because of the composition of the shales. The results are given in Table 3.
Table 3--Citric acid soluble and total P2O5 content of shales.
| Lab. No. |
Total P2O5 |
P2O5 soluble in citric acid |
P2O5 soluble in citric acid, percent of total |
|---|---|---|---|
| 48-99 | 1.64 | 1.34 | 81.7 |
| 48-224 | 3.20 | 2.80 | 87.5 |
| 48-295 | 2.08 | 1.20 | 57.69 |
| *48-296 (49-41) | 2.62 | 1.77 | 67.56 |
| *48-296 (49-42) | 3.76 | 2.54 | 67.55 |
| 48-298 | 2.30 | 1.54 | 66.95 |
| 48-311 | 0.81 | 0.79 | 97.53 |
| 49-173 | 1.40 | 1.39 | 99.28 |
| 49-174 | 2.05 | 1.94 | 94.63 |
| This sample was pulverized, then repeatedly ball milled until 85.1 percent passed 200 mesh. 49-41 is the +200 mesh, 49-42 is the -200 mesh. |
|||
Total analyses--Complete chemical analyses of the shales were made by the usual methods applicable to silicate rocks (Hillebrand and Lundell, 1946; Kolthoff and Sandell, 1946; Scott, 1939) and are shown in Table 4.
Table 4--Chemical analyses of samples.
| Element | 48-98 | 48-99 | 48-219 | 48-220 | 48-224 | 48-295 | 48-296 | 48-297 | 48-298 | 48-311 |
|---|---|---|---|---|---|---|---|---|---|---|
| Silicon dioxide | 48.78 | 61.21 | 55.97 | 47.79 | 52.96 | 44.13 | 45.58 | 51.03 | 53.41 | 53.61 |
| Alumina (Al2O3) | 14.54 | 18,91 | 15.72 | 14.44 | 12.43 | 13.79 | 14.10 | 21.63 | 11.65 | 16.86 |
| Iron oxide (Fe2O3) | 5.40 | 3.98 | 4.30 | 3.37 | 4.19 | 4.29 | 4.30 | 7.61 | 5.44 | 4.66 |
| Titanium oxide (TiO2)* | 1.03 | 0.86 | 1.18 | 1.00 | 0.85 | 0.29 | 0.29 | 1.20 | 1.96 | 1.12 |
| Calcium oxide (CaO) | 2.31 | 2,50 | 6.19 | 3.03 | 4.29 | 5.06 | 5.46 | 2.44 | 4.33 | 3.32 |
| Magnesium oxide (MgO) | 2.65 | 2.19 | 1.74 | 1.64 | 1.55 | 1.87 | 0.99 | 2.25 | 1.83 | 2.41 |
| Phosphorus pentoxide (P2O5) | 0.92 | 1.65 | 0.09 | 1.29 | 3.20 | 2.08 | 4.24 | Trace | 2.30 | 0.86 |
| Sulfur trioxide (SO3) | 0.49 | 0.13 | 0.96 | 0.39 | 0.35 | 1.24 | Trace | 0.84 | 0.12 | 1.95 |
| Potassium oxide (K2O) | N.D. | 3.87 | N.D. | N.D. | 2.07 | N.D. | N.D. | N.D. | N.D. | 3.46 |
| Sodium oxide (Na2O) | N.D. | N.D. | N.D. | N.D. | N.D. | N.D. | N.D. | N.D. | N.D. | N.D. |
| Total nitrogen (N) | N.D. | N.D. | N.D. | N.D. | 0.20 | N.D. | N.D. | N.D. | N.D. | 0.10 |
| Loss on ignition at 1000°C. Dried at 140°C. | 20.12 | 5.46 | 10.74 | 21.42 | 18.00 | 20.22 | 21.77 | 8.45 | 16.10 | 11.41 |
| *Gravimetric method used (Runnels and Dubins, 1949, p. 16) | ||||||||||
Spectrographic analyses--All analyses were made with a 1.5 meter Applied Research Laboratory grating spectrograph. Analyses were made using special high purity graphite electrodes wherever the routine qualitative "shot" was inconclusive. Elements recorded as "not seen" are ones which can be detected consistently only by special methods. In most cases, however, only extremely minute amounts are likely to be present if the element is not detected. Special spectrograms were made after leaching 20 grams of the shale in distilled water for 12 to 15 hours. The soluble salts were dried out, taken up with powdered graphite, and analyzed with super-pure electrodes. The results were qualitative only; all results are shown in Tables 5 and 6.
Table 5--Qualitative spectrographic analyses of shales (analyses by A. C. Reed).
| Lab. No. | Name of shale | P | B | Si | Mn | Cr | Mo | Fe | Al | Ti | Zr | V | Cu | Zn | Pb | Ag | K | Na | Ca | Mg | Sr |
|---|---|---|---|---|---|---|---|---|---|---|---|---|---|---|---|---|---|---|---|---|---|
| 48-98 | Muncie Creek |
x6 | 6 | * | 9 | 7 | 5 | * | * | * | 4 | 9 | 7 | 6 | 7 | 5 | * | * | * | * | - |
| 48-99 | Quivira | 6 | 5 | 9 | 4 | 8 | - | 9 | 10 | 10 | 6 | 10 | 6 | 6 | - | 6 | 6 | 7 | 9 | 9 | - |
| 48-219 | Upper Bourbon |
x6 | 6 | * | 10 | 8 | 2 | * | * | * | 5 | 6 | 7 | 5 | 4 | 2 | * | * | * | * | - |
| 48-220 | Little Anna |
6 | - | 8 | 5 | 9 | - | 8 | 9 | 9 | 5 | 8 | 6 | 5 | - | 4 | 8 | 5 | 8 | 9 | - |
| x7 | 6 | * | 6 | 8 | 2 | * | * | * | 2 | 6 | 7 | 3 | 5 | 4 | * | * | * | * | - | ||
| 48-224 | Bourbon | 8 | 6 | * | 8 | 9 | 5 | * | * | * | 4 | 7 | 8 | 5 | 4 | 5 | * | * | * | * | - |
| 48-295 | Stark Quarry |
8 | - | 8 | 6 | 7 | - | 7 | 7 | 7 | 3 | 7 | 6 | 5 | - | 4 | 6 | 7 | 7 | 8 | - |
| x8 | 6 | * | 9 | 9 | 7 | * | * | * | 1 | 9 | 9 | 4 | 6 | 5 | * | * | * | * | - | ||
| 48-296 | Above Croweburg coal |
9 | - | 8 | 5 | 7 | - | 8 | 8 | 7 | 4 | 7 | 6 | 4 | - | 3 | 6 | 6 | 7 | 7 | - |
| x9 | 6 | * | 6 | 9 | 6 | * | * | * | - | 7 | 8 | 4 | 5 | 4 | * | * | * | * | - | ||
| 48-297 | Above Bevier coal |
- | - | 8 | 8 | 5 | - | 9 | 7 | 8 | 4 | 6 | 5 | 3 | - | - | 7 | 6 | 5 | 8 | - |
| x5 | 6 | * | 10 | 3 | - | * | * | * | - | 6 | 7 | - | 3 | - | * | * | * | * | - | ||
| 48-298 | Above Mulky coal |
7 | - | 8 | 8 | 9 | - | 9 | 10 | 9 | 8 | 9 | 6 | 6 | - | 4 | 8 | 6 | 8 | 9 | - |
| x9 | 6 | * | 10 | 9 | 5 | * | * | * | - | 9 | 9 | 4 | 7 | 5 | * | * | * | * | - | ||
| 48-311 | Eudora Ross Quarry |
5 | 5 | 8 | 5 | 6 | - | 8 | 6 | 9 | - | 6 | 7 | 2 | - | 2 | 5 | 6 | 6 | 7 | - |
| x Used special high purity graphite electrodes to determine trace elements. * Analyzed chemically. 10, strongest; 5, trace; 1, very very weak; -, not seen |
|||||||||||||||||||||
Table 6--Spectrographic analyses of water extraction from selected shales using special high-purity graphite electrodes. (Analyses by A. C. Reed.)
| Lab. No. | Name of shale | P | B | Si | Mn | Cr | Mo | Fe | Al | Ti | Zr | V | Cu | Zn | Pb | Ag | K | Na | Ca | Mg | Sr |
|---|---|---|---|---|---|---|---|---|---|---|---|---|---|---|---|---|---|---|---|---|---|
| 48-98 | Muncie Creek |
- | - | 6 | 8 | - | - | 4 | 4 | - | - | - | 9 | - | - | 4 | - | 6 | 8 | 7 | 5? |
| 48-99 | Quivira | - | - | 5 | - | - | - | 2 | 3 | - | - | - | 6 | - | - | 2 | - | 4 | 7 | 8 | 5? |
| 48-224 | Pleasanton | - | - | 6 | 4 | - | - | 4 | 6 | - | - | - | 7 | - | - | 2 | - | 7 | 9 | 9 | 5? |
| 48-298 | Above Mulky Coal |
- | - | 5 | - | - | - | 3 | 2 | - | - | - | 7 | - | - | 6 | - | 2 | 6 | 6 | - |
| 49-173* | Pleasanton | - | 5 | 5 | 6 | - | 8 | 7 | 6 | - | - | 6 | 7 | - | - | - | 9 | 10 | 10 | 9 | 6 |
| 10, strongest; 5, trace; 1, very very weak; -, not seen * Special sample--100 grams leached with 2 liters of water and total solids at 1400C determined. Percentage of salts obtained was 0.11. |
|||||||||||||||||||||
Determination of the citric acid soluble and total P2O5 content indicates that sufficient phosphate is present in the shales to be of benefit to soils, when applied in sufficient amounts. The chemical analyses show relatively large percentages of K2O, MgO, and iron that would be available as the shale was weathered. The spectrographic analyses show a rather wide range of trace elements that are known to be beneficial. These include boron, manganese, copper, zinc, and molybdenum. Other elements that do not have any recognized value but were noted to be present in small amounts were lead, silver, chromium, vanadium, and zirconium. The water soluble determinations showed iron, aluminum, copper, silver, sodium, calcium, magnesium, and strontium. Strontium is considered to be present in extremely small quantities and was seen because of the relative concentration of the other salts.
Tentative identification of the clay minerals in the shales as illite (Norman Plummer, personal communication) cannot be substantiated until thermal analysis equipment is available. This equipment should be operating by 1950.
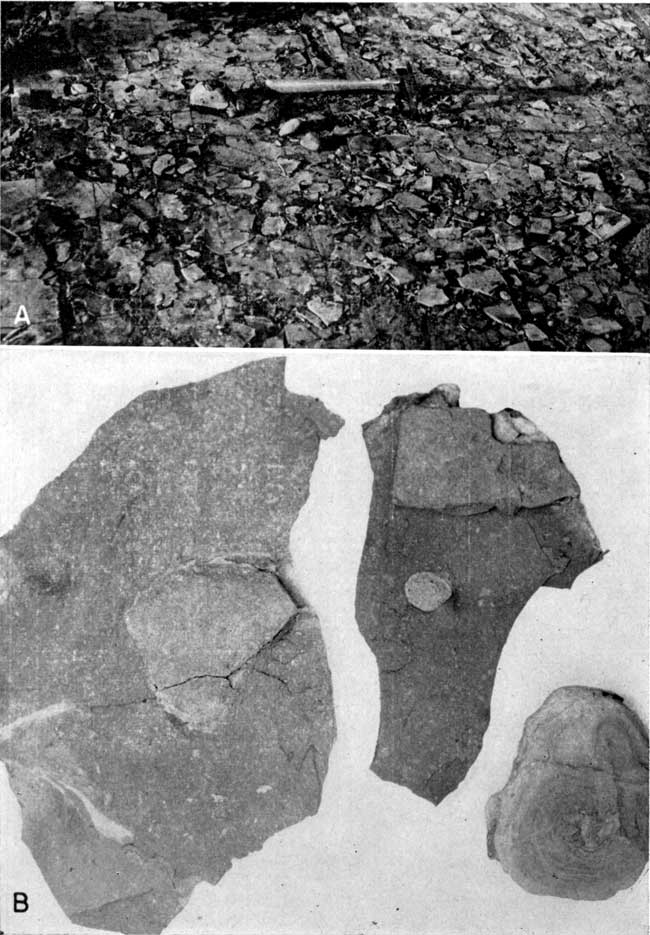
Plate 2--A, Nodules of phosphate-bearing shale on the floor of a county quarry, sec. 17, T. 32 S., R. 19 E., Labette County; B, typical size and shape of phosphate-bearing shale nodules, 2/3 normal size [note: enlarged somewhat for web to show detail]. (Photos by A, Earl K. Nixon; B, Roy Jindra.)
The properties of the phosphatic shales studied that are judged to be of benefit to soils are considered in two groups: (1) those producing immediate results, and (2) beneficial properties derived from weathering and available over a long period of time. They are as follows. (1) Immediate reactions: P2O5 content of soil is increased; base exchange capacity of soil possibly would be increased (Byers, Anderson, and Bradfield, 1938; Joffe and McLean, 1926, 1927); water soluble elements are released. (2) Weathering reactions: ferrous salts, magnesium salts, potash (previously nonsoluble K2O), and the remainder of trace elements are released to soil; small amounts of nitrogen become available.
The investigation under way at Kansas State College on the utilization Of P2O5 will have an important bearing on evaluation of these shales as a beneficial application to soils for plant growth. It is expected that these studies will be completed during the year 1949.
Byers, H. G., Anderson, M. S., and Bradfield, Richard, 1938, General chemistry of the soil: U. S. Dept. Agri., Soils and Men, 1933, pp. 911-928, figs. 1-2.
Hillebrand W. G., and Lundell, G. E. F., 1946, Applied inorganic analyses: 9th prtg., pp. 1-929, figs. 1-40, John Wiley & Sons, Inc., New York.
Joffe, G. S., and McLean, H. C., 1926, Colloidal behavior of soils and soil fertility, II, the soil complex capable of base exchange and soil acidity: Soil Sci., vol. 21, pp. 181-195, figs. 1-3.
Joffe, G. S., and McLean, H. C., 1927, Colloidal behavior of soils and soil fertility, III, cation replacement and saturation of soil with calcium: Soil Sci., vol. 23, pp. 127-135.
Kolthoff, I. M., and Sandell, E. B., 1946, Textbook of quantitative inorganic analysis: rev. ed., pp. 1-794, figs. 1-131, Macmillan Co., New York.
Lepper, H. A., et al., 1945, The official and tentative methods of analysis: Assoc. Official Agricultural Chemists, Washington, D. C.
Oakes, M. C., 1938, Phosphate: Oklahoma Geol. Survey, Min. Rept. 2, pp. 1-34, pl. 1.
Runnels, R. T., and Dubins, I. M., 1949, Chemical and petrographic studies of the Fort Hays chalk in Kansas: Kansas Geol. Survey, Bull. 82, pt. 1, pp. 1-36, figs. 1-6, pl. 1. [available online]
Scott, W. W., 1939, Standard methods of chemical analyses: vol. 1, 5th ed., pp. 1-1234, figs. 1-132 (N. H. Furman, editor), D. Van Nostrand Co., Inc., New York.
Kansas Geological Survey, Preliminary Report on Phosphate-Bearing Shales in Eastern Kansas
Placed on web Feb. 10, 2010; originally published in August 1949.
Comments to webadmin@kgs.ku.edu
The URL for this page is http://www.kgs.ku.edu/Publications/Bulletins/82_2/index.html