Kansas Geological Survey, Bulletin 76, part 1, originally published in 1948
Originally published in 1948 as Kansas Geological Survey Bulletin 76, part 1. This is, in general, the original text as published. The information has not been updated. An Acrobat PDF version of this report is available (4 MB).
This brief paper relates the density of Kansas oil-field brines to the major dissolved constituents so as to permit rapid and inexpensive estimation of the composition of these Paleozoic brines when only the density is known. By use of graphs given in the paper, reasonably accurate estimates of the concentrations of sodium, calcium, magnesium, and dissolved solids may be made readily after determining the density. These relationships seem essentially similar regardless of depth, age, or composition of the producing formation. Minor constituents seem not related consistently to the density.
A comparison of the density-concentration relationships of the Kansas brines with those from the Appalachian area indicates that the eastern brines differ significantly in percentages of dissolved constituents.
Reliable information on the composition of oil-field brines is of increasing interest in Kansas as attempts are made to alleviate the difficult brine-disposal problems. Also, studies on corrosion of oilfield equipment and on the character of waters used in secondary recovery operations require a knowledge of the composition of the brines. Moreover, the concentration of some constituents of brines has an important bearing on possible commercial utilization of the brine, and on potential use of these brines for regeneration of base-exchange water softeners.
This brief paper, therefore, relates graphically the density of the Kansas oil-field brines to their several major constituents, in order to afford a rapid and inexpensive method for estimating the approximate composition of these brines in Kansas. The basic analytical data comprise analyses of 167 representative Paleozoic brines from nearly 80 major oil fields in Kansas (Schoewe, 1943, tables 5-14; Jones, 1945, pp. 159-164). Of these analyses 149 were made for the Geological Survey by R. Q. Brewster and Calvin Vander Werf of the University of Kansas. A few other published analyses (Case, 1934; Runyon and Rankin, 1940) have been used to check the method here proposed, but these data are not included in the figures.
Grateful acknowledgment is made to H. A. Hoskins of the West Virginia Geological Survey for counsel in earlier studies on brines in the Appalachian area. Dr. Hoskins' (1937,1947) papers have outlined the relationship of density to the concentrations of dissolved salts in brines, and this article applies his methods to the slightly different brines in Kansas.
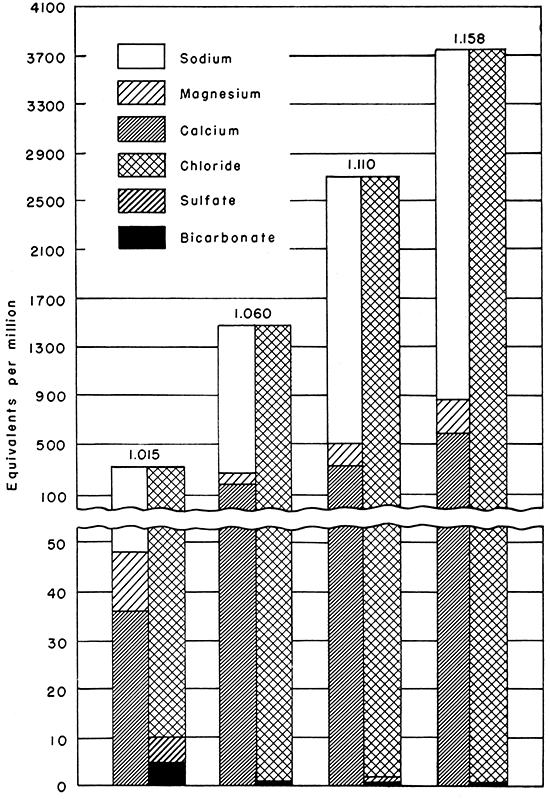
The brines associated with petroleum in the rock formations of Kansas comprise modified marine waters that have been diluted locally by the entrance of fresh water from precipitation on the surface or have been concentrated and changed by numerous other factors. Sodium and chloride are the major constituents, but appreciable amounts of calcium and magnesium are present also. Smaller quantities of iron, aluminum, bicarbonate, sulfate, iodine, and bromine have been identified in some of the brines, and presumably sulfide, strontium, barium, ammonia, silica, and other constituents occur. Typical analyses of brines ranging in density from 1.015 to 1.158 grams per milliliter at 60° F. are shown in Figure 1.
Figure 1--Typical analyses of Kansas brines ranging in density from 1.015 to 1.158 grams per milliliter.
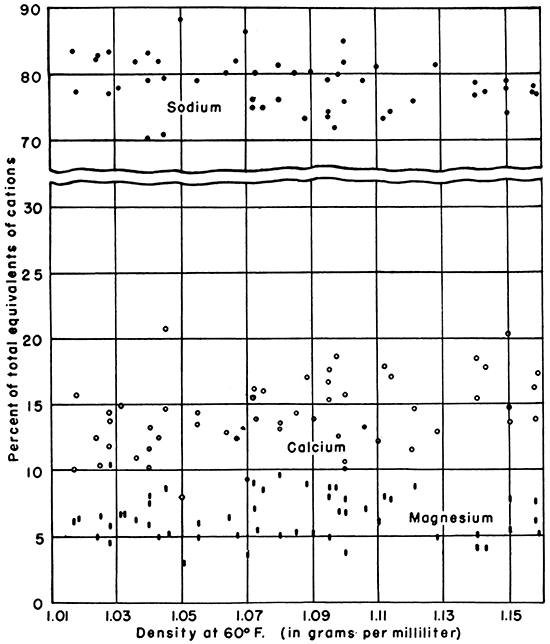
When the effects of concentration are eliminated by expressing the constituents as percentages of the total chemical equivalents of the cations or anions, the percentages of the major ions are relatively similar for the brines. For example, sodium averages about 77 percent, calcium 15 percent, and magnesium 8 percent of the cations (Fig 2). Although the brines were collected from 16 different geologic strata which include the Kansas City-Lansing, "Bartlesville," "Chat," "Mississippi lime," Viola, Simpson, Arbuckle, and others, the effect of the different composition of the source beds seems to have caused only slight modification of the brines. There seems to be a slight increase in the percentage of calcium and magnesium and a decrease in the sodium with increasing densities. The variation in these percentages for several brines having the same density, however, is as great as the difference between low and high density brines.
Figure 2--Graph showing the relationship of density to sodium, calcium, and magnesium, expressed as percentages of total chemical equivalents of cations.
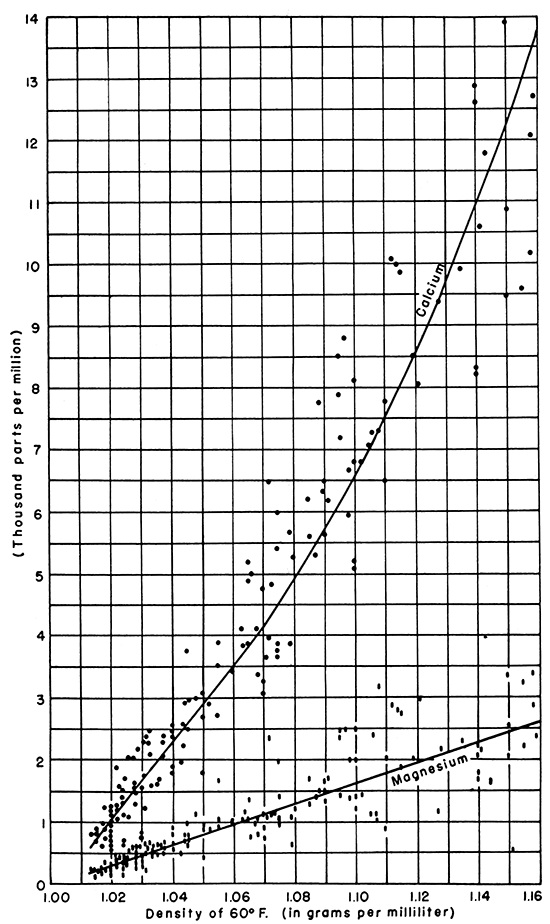
Following the method applied by Hoskins (1937, 1947) to brines in the Appalachian area, the density of each of the Kansas brines is plotted against the concentration of sodium, chloride, and dissolved solids, respectively, in Figure 3, and the concentrations of magnesium and calcium against the density in Figure 4. [Note: The concentrations of dissolved constituents are reported in milligrams per liter by Schoewe and Jones, but they are converted to the more familiar units, parts per million, for use in this paper.] The plotted points on these figures fall rather closely along definite trends which are approximated by the solid lines drawn by inspection through the points. The points representing the concentrations of sodium, chloride, magnesium, and dissolved solids seem to fall along straight lines for the densities plotted, but the line through the points representing calcium steepens above a density of about 1.070 grams per milliliter.
Figure 3--Graph showing the relationship of density to concentration of sodium, chloride, and dissolved solids, in parts per million, for Kansas oil-field brines.
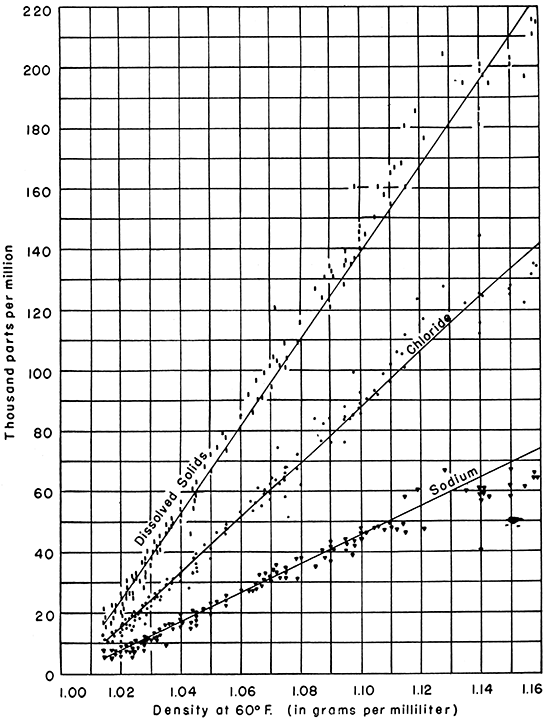
Figure 4--Graph showing the relationship of density to concentration of calcium and magnesium, in parts per million, for Kansas oil-field brines.
These graphs indicate that the concentrations of the major constituents vary directly as the density. Moreover, brines having the same density are similar in general composition, regardless of the depth, age, or composition of the producing formation.
The concentration of minor dissolved constituents that were reported in the analyses as sulfate, bicarbonate, bromine, iodine, iron, and aluminum, are not related consistently to the density of the brines. The analytical determination of sulfates and bicarbonates, however, may be affected in some brines by appreciable quantities of sulfide and probably other ions. Presumably the amount of sulfate in many brines is a function of the amount of barium that had entered the brine.
Preliminary study of other Paleozoic brines in the midcontinent area, as those from eight formations in the Fitts pool in Oklahoma (Taylor and Owens, 1942, p. 15), indicates that the relationship between density and the major constituents is reasonably accurate also in the states bordering on Kansas.
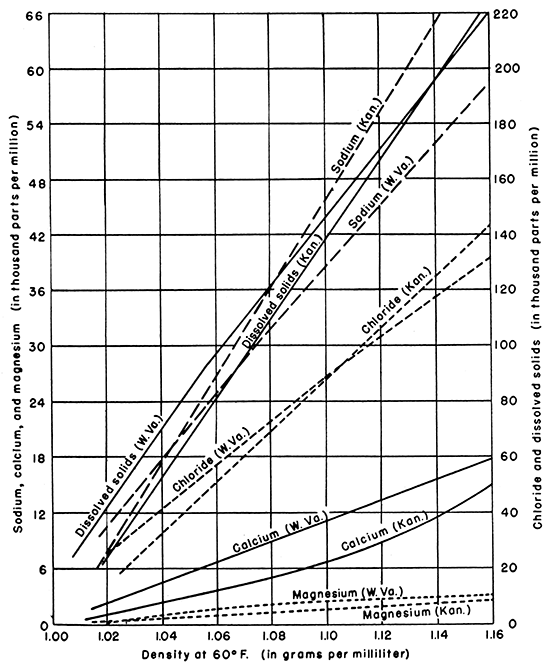
According to the graphs given by Hoskins (1937, figs. 8-18; 1947, p. 21), however, the relationship of density to the major constituents in the Appalachian brines differs significantly from these relationships in Kansas (Fig. 5). A part of this difference may result from the variation in temperature at which densities for the eastern brines were determined. In general, the ratio of sodium to calcium plus magnesium is somewhat larger in the Kansas brines. Also, available data on brines in Kansas do not include those having densities above 1.16 grams per milliliter, whereas maximum densities in the West Virginia brines are more than 1.22 grams per milliliter.
Figure 5--Graph comparing the density-concentration lines for brines in Kansas with brines in the Appalachian area. (Appalachian data from Hoskins, 1947).
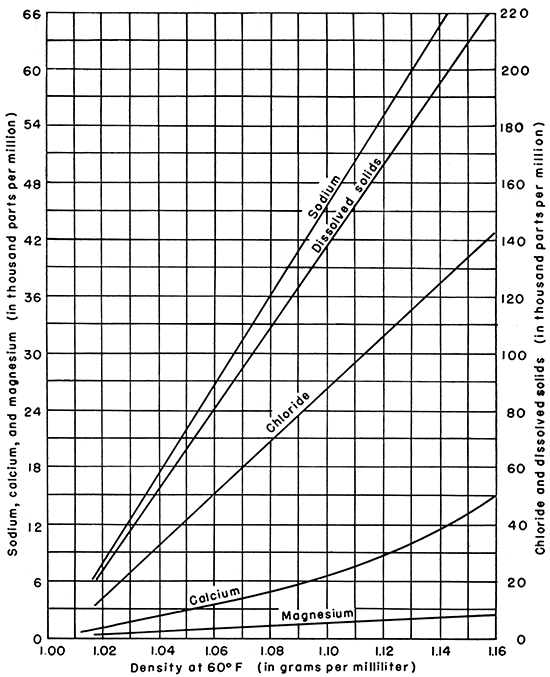
On the basis of the available analyses of Kansas oil-field brines, reasonably accurate estimates of the concentration of sodium, calcium, magnesium, chloride, and dissolved solids in brines from the sampled Paleozoic formations may be read graphically after determination of the density only (Fig. 6). Also, similar estimates may be made on the basis of .the concentration of a single ion, such as chloride, when the density value is lacking. The minor constituents, including bicarbonate, sulfate, aluminum, iron, bromine, and iodine, have no consistent relationship to density.
Figure 6--Graph for estimating the composition of a Kansas brine from the determination of the density.
The application of this graphic method should make available many additional data on Kansas oil-field brines and aid in the selection of samples for accurate chemical analyses. The evident general similarities in concentrations of dissolved constituents for similar densities, however, does not preclude the use of more detailed data on the character of the brines to distinguish between producing formations or to recognize several water-bearing zones in a single area.
Case, L. C., 1934, Subsurface water characteristics in Oklahoma and Kansas: Problems of Petroleum Geology: Am. Assoc. Petroleum Geologists, Sidney Powers Mem. vol., pp. 855-868, figs. 1-4.
Hoskins, H. A., 1937, Salt brines of West Virginia: History of the brine salt industry: West Virginia Geol. Survey, vol. 8, pp. 3-33, fig. 1, pls. 2-5.
Hoskins, H. A., 1947, Analyses of West Virginia brines: West Virginia Geol. Survey, Rept. Investigations 1, pp. 1-22, figs. 1-2.
Jones, O. S., 1945, Disposition of oil field brines: Univ. of Kansas Publi., pp. 1-192.
Runyon, H. E., and Rankin, Roy, 1940, Chemical analyses of some oil-well waters of Ellis and Trego Counties, Kansas: Kansas Acad. Sci. Trans., vol. 43, pp. 235-241.
Schoewe, W. H., 1943, Kansas oil field brines and their magnesium content: Kansas Geol. Survey, Bull. 47, pt. 2, pp. 37-76, figs. 1-3. [available online]
Taylor, S. S., and Owens, E. O., 1942, Subsurface disposal of oil-field brines in Oklahoma: U. S. Bureau of Mines, Rept. Investigations 3603, pp. 1-54, figs. 1-5.
Kansas Geological Survey, Graphic Representation of Oil-field Brines in Kansas
Placed on web Sept. 13, 2016; originally published March 15, 1948.
Comments to webadmin@kgs.ku.edu
The URL for this page is http://www.kgs.ku.edu/Publications/Bulletins/76_1/index.html