![]()
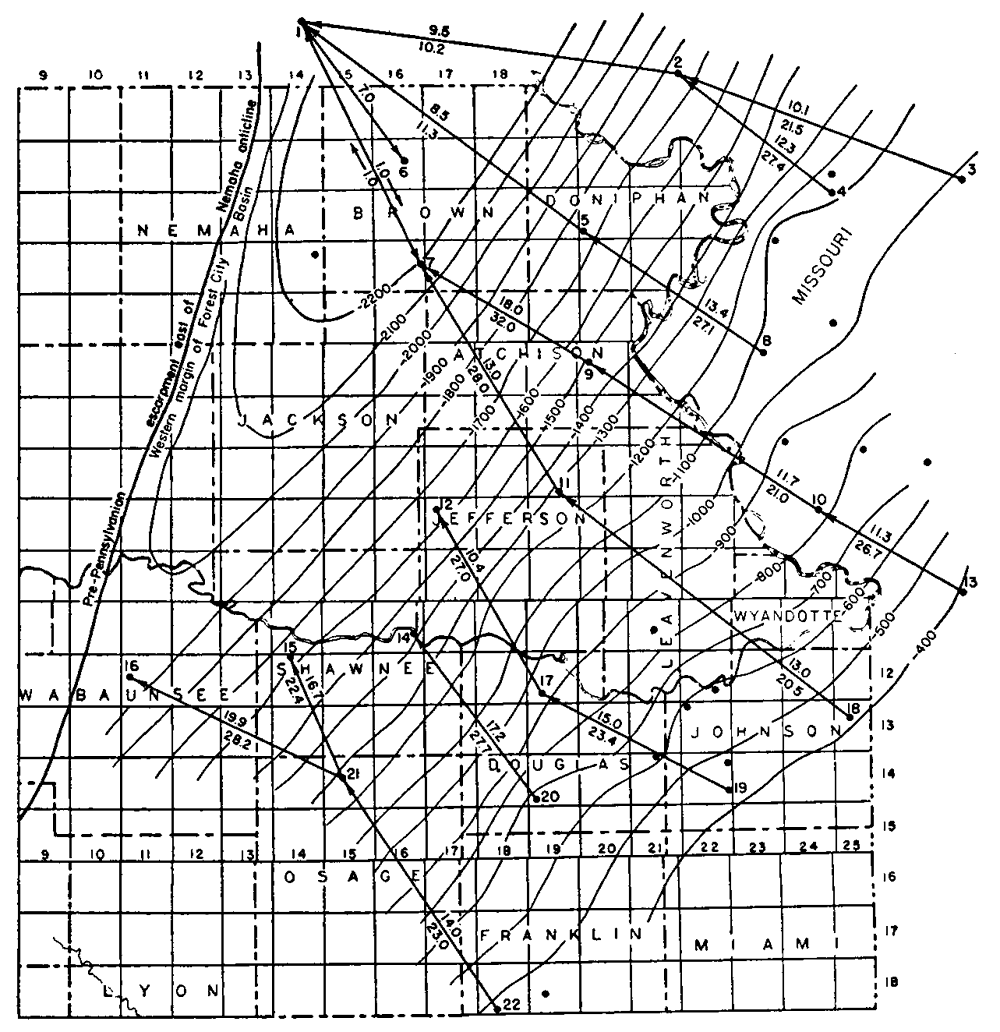
Figure 22--Contour map of northeastern Kansas and adjacent areas showing the structure of the top of the St. Peter sandstone.
The average rate of dip of the base of the Hertha limestone is indicated by figures in feet per mile above the lines connecting the wells, and the dip of the top of the St. Peter sandstone by figures below the lines. The arrows indicate the direction of dip between wells. Altitudes of contours are in feet below sea level. Structure contour interval is 100 feet.
Kansas Geological Survey, Forest City Basin
Comments to webadmin@kgs.ku.edu
Web version July 2005. Original publication date Dec. 1943.
URL=http://www.kgs.ku.edu/Publications/Bulletins/51/fig22.html