![]()
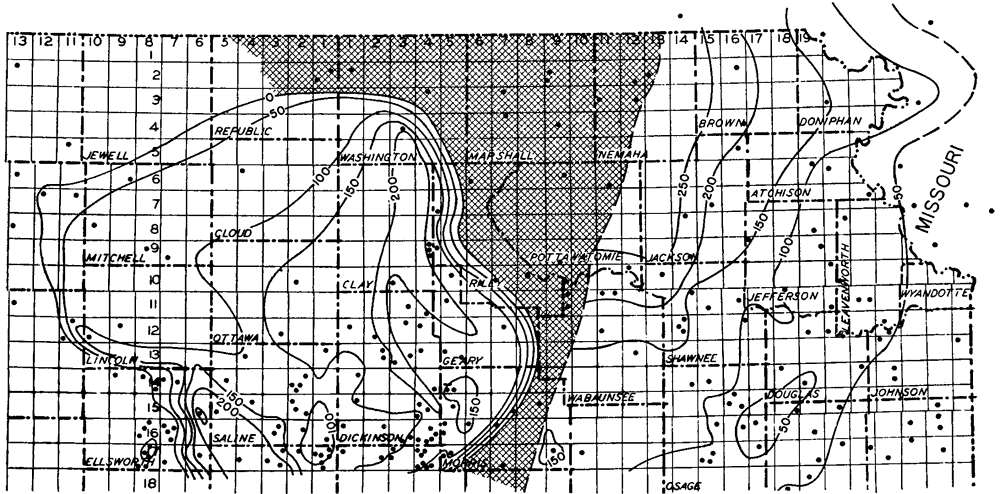
Figure 14--Map of northeastern Kansas showing the thickness of the Chattanooga shale. The thickening of the Chattanooga shale toward the north indicates that the sinking of the North Kansas basin continued into Chattanooga time. The irregularities in the smoothness of the contours seem to be the expression of topographic relief upon the pre-Chattanooga peneplain (see fig. 12). In Dickinson County the thickness map of the Chattanooga and the underlying rocks is detailed enough to show thinning of the underlying rocks where the Chattanooga is thickest.
Checkered pattern shows area from which Chattanooga shale was removed by post-Mississippian erosion. Isopachus lines connecting points of equal thickness are drawn at 50-foot intervals. Dots show locations of wells used as source data.
Kansas Geological Survey, Forest City Basin
Comments to webadmin@kgs.ku.edu
Web version July 2005. Original publication date Dec. 1943.
URL=http://www.kgs.ku.edu/Publications/Bulletins/51/fig14.html